Report Code: A00703 | Mar 2019 | Pages: 283 | ||
Tables: 151 | Charts: 54 |
|
Pandemic disrupted the entire world and affected many industries.
Get detailed COVID-19 impact analysis on the Orthobiologics Market
Request Now !The global orthobiologics market was valued at $4,870 million in 2017 and is projected to reach $6,870 million by 2025, registering a CAGR of 4.3% from 2018 to 2025.
Orthobiologics are also called regenerative cellular therapies. Products related to orthobiologics contain growth factors or sometimes secrete growth factors to facilitate tissue healing, improve pain, and help restore the normal functioning. There are various types of orthobiologics present in the market, which rely on different mechanism of actions. An autologous is derived from patients own body, which under right conditions divide to form precursor cells. Orthobiologics find their application for the treatment of conditions such as fracture recovery, spinal fusion, and others. These are also available as hip, knee, ankle, spine wrist and other body parts. Orthobiologics mainly help in faster healing of injuries.
Surge in geriatric population across the globe, which is prone to various diseases such as osteoarthritis and others boost the growth of the orthobiologics market. Increase in awareness of orthobiologics and rise in demand for advanced treatment are other factors expected to boost the expansion of the market. Other key factors that are responsible for the growth of the orthobiologics market are surge in obesity and rise in number of sports accidents and road accidents.
Moreover, high growth potential in developing nations and upsurge in demand for advanced treatment are expected to create new opportunities for the market players during the forecast period. However, higher cost of orthobiologics and stringent approval process are the major factors that impede the growth of the market.
Global Orthobilogics Market Segmentation
The global orthobiologics market is segmented based on product, application, type, end user, and region. Based on product, the market is classified into demineralized bone matrix (DBM), allograft, bone morphogenetic protein (BMP), Viscosupplementation products, synthetic bone substitutes, and others. Based on type, the market is categorized into knee, ankle, hip, wrist & shoulder, spine, and others. Based on end user, the market is divided into hospitals & ambulatory centers, research & academic institute, and dental clinics. Based on application, the market is further fragmented into osteoarthritis & degenerative arthritis, spinal fusion, fracture recovery, soft tissue injuries, and maxillofacial & dental applications.
Based on region, it is studied across North America (U.S., Canada, and Mexico), Europe (Germany, France, the UK, Italy, Spain, and rest of Europe), Asia-Pacific (China, Japan, Australia, India, South Korea, and rest of Asia-Pacific), and LAMEA (Brazil, South Africa, Saudi Arabia, and rest of LAMEA).
Segment review
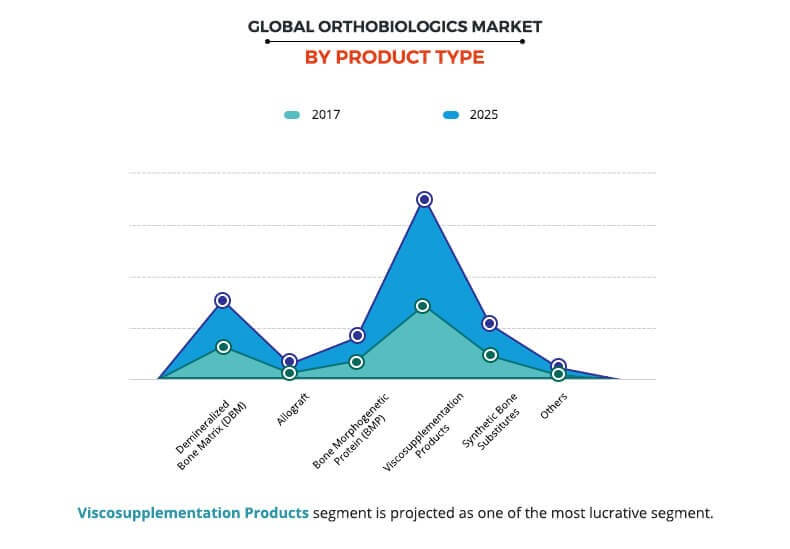
According to product, the Viscosupplementation product segment occupied the largest orthobiologics market share in 2017. This is due to better reimbursement scenario for the products as these are approved by the U.S. FDA. Moreover, the reimbursement scenario is expected to further increase the use of Viscosupplementation. France has a well-defined reimbursement policy for viscosupplementation products. In addition, the viscosupplementation product is also the fastest growing segment during the forecast period registering a CAGR of 4.8% from 2018 to 20205. This is attributed to the increase in geriatric population, rise in prevalence of osteoarthritis, and growth in lifestyle-induced disorders, such as obesity.
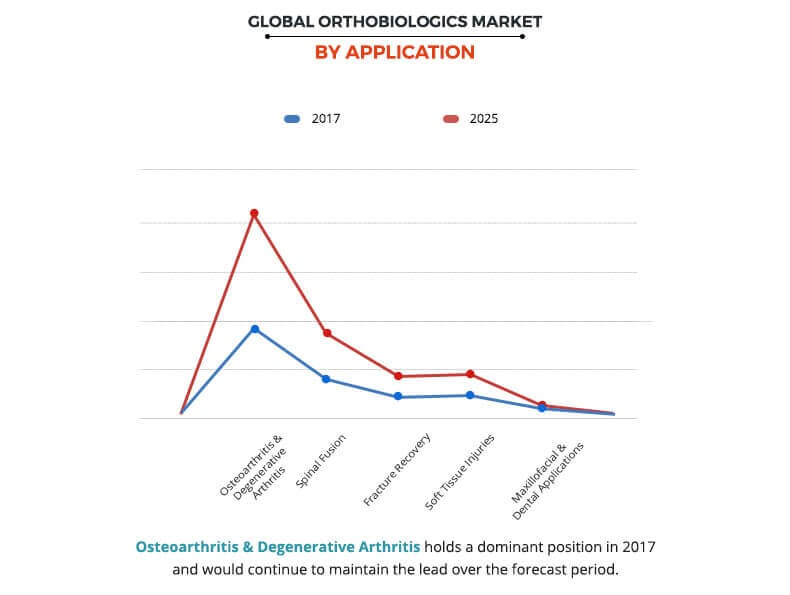
According to application, the osteoarthritis & degenerative arthritis segment occupied the largest orthobiologics market share in 2017. This is due to presence of huge geriatric population, which is more prone to osteoarthritis. The spinal fusion segment is the fastest growing segment during the forecast period owing to the benefits offered by orthobiologics in the treatment spine such as biological healing that promotes the spinal fusion process.
Snapshot of Asia-Pacific orthobiologics market
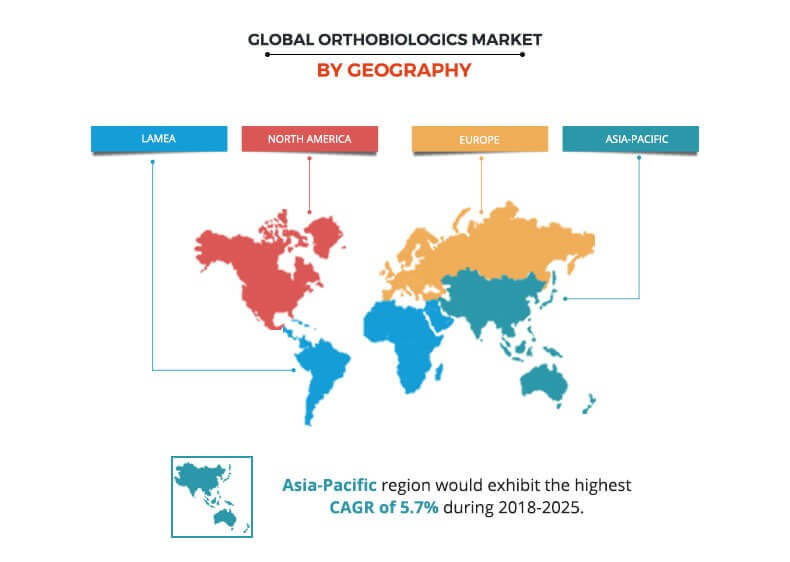
Asia-Pacific occupies a significant share of the orthobiologics market size and possesses high growth potential, owing to rise in geriatric population and surge in obesity. Moreover, increase in disposable income; surge in research, development, & innovation activities; and rise in awareness related to use of orthobiologics are other factors that contribute toward the growth of the orthobiologics market in this region. In addition, rise in number of sports related accidents and road accidents fuel the orthobiologics market growth.
The other factors which contribute towards the growth of orthobiologics market in Asia-Pacific include the rise in prevalence of chronic arthritis, osteoarthritis and other orthopedic conditions. These aforementioned factors have led to a rise in demand for orthobiologics in Asia-Pacific.
The report provides an extensive competitive analysis and profiles of the key market players such as Stryker Corporation, Zimmer Biomet Holdings, Inc., Wright Medical Group, Inc., Integra LifeSciences Holdings Corporation, Arthrex, Inc. (Arthrex), Johnson and Johnson (J&J), Exactec Inc., Medline Industries, Inc., Globus Medical, Inc., and NuVasive Inc.
The other players in the value chain include Kuros Biosciences AG, XTANT MEDICAL, and Bioventus.
Orthobiologics Market Report Highlights
Aspects | Details |
---|---|
By PRODUCT |
|
By APPLICATION |
|
By Type |
|
By END USER |
|
By Region |
|
Key Market Players | ZIMMER BIOMET HOLDINGS, INC, EXACTECH, INC., NUVASIVE INC., MEDLINE INDUSTRIES, INC., ARTHREX, INC., STRYKER CORPORATION, INTEGRA LIFESCIENCES HOLDINGS CORPORATION (DERMA SCIENCES INC.), GLOBUS MEDICAL INC., WRIGHT MEDICAL GROUP, INC., JOHNSON & JOHNSON (DEPUY SYNTHES) |
CHAPTER 1: INTRODUCTION
1.1. Report description
1.2. Key benefits for stakeholders
1.3. Key market segments
1.4. Research methodology
1.4.1. Secondary research
1.4.2. Primary research
1.5. Analyst tools and models
CHAPTER 2: EXECUTIVE SUMMARY
2.1. Key findings of the study
2.2. CXO perspective
CHAPTER 3: MARKET OVERVIEW
3.1. Market definition and scope
3.2. Key findings
3.2.1. Top investment pockets
3.2.2. Top winning strategies
3.2.3. Porters five forces analysis
3.3. Market dynamics
3.3.1. Drivers
3.3.1.1. Rise in incidence of orthopedic diseases & injury
3.3.1.2. Growth in aging population
3.3.1.3. Increase in sports injuries
3.3.2. Restraints
3.3.2.1. High cost of orthobiologics product
3.3.2.2. Stringent approval process
3.3.3. Opportunity
3.3.3.1. Improvement in healthcare infrastructure
3.4. Top player positioning, 2017
CHAPTER 4: ORTHOBIOLOGICS MARKET, BY PRODUCT
4.1. Overview
4.1.1. Market size and forecast
4.2. Demineralized bone matrix (DBM)
4.2.1. Key market trends, growth factors, and opportunities
4.2.2. Market size and forecast
4.2.3. Market analysis, by country
4.3. Allograft
4.3.1. Key market trends, growth factors, and opportunities
4.3.2. Market size and forecast
4.3.3. Market analysis, by country
4.4. Bone morphogenetic protein (BPM)
4.4.1. Key market trends, growth factors, and opportunities
4.4.2. Market size and forecast
4.4.3. Market analysis, by country
4.5. Viscosupplementation products
4.5.1. Key market trends, growth factors, and opportunities
4.5.2. Market size and forecast
4.5.3. Market analysis, by country
4.6. Synthetic bone substitutes
4.6.1. Key market trends, growth factors, and opportunities
4.6.2. Market size and forecast
4.6.3. Market analysis, by country
4.7. Others
4.7.1. Key market trends, growth factors, and opportunities
4.7.2. Market size and forecast
4.7.3. Market analysis, by country
CHAPTER 5: ORTHOBIOLOGICS MARKET, BY APPLICATION
5.1. Overview
5.1.1. Market size and forecast
5.2. Osteoarthritis & degenerative arthritis
5.2.1. Market size and forecast
5.2.2. Market analysis, by country
5.3. Spinal fusion
5.3.1. Market size and forecast
5.3.2. Market analysis, by country
5.4. Fracture recovery
5.4.1. Market size and forecast
5.4.2. Market analysis, by country
5.5. Soft tissue injuries
5.5.1. Market size and forecast
5.5.2. Market analysis, by country
5.6. Maxillofacial & dental applications
5.6.1. Market size and forecast
5.6.2. Market analysis, by country
CHAPTER 6: ORTHOBIOLOGICS MARKET, BY TYPE
6.1. Overview
6.1.1. Market size and forecast
6.2. Knee
6.2.1. Market size and forecast
6.2.2. Market analysis, by country
6.3. Ankle
6.3.1. Market size and forecast
6.3.2. Market analysis, by country
6.4. Hip
6.4.1. Market size and forecast
6.4.2. Market analysis, by country
6.5. Wrist & shoulder
6.5.1. Market size and forecast
6.5.2. Market analysis, by country
6.6. Spine
6.6.1. Market size and forecast
6.6.2. Market analysis, by country
6.7. Others
6.7.1. Market size and forecast
6.7.2. Market analysis, by country
CHAPTER 7: ORTHOBIOLOGICS MARKET, BY END USER
7.1. Overview
7.1.1. Market size and forecast
7.2. Hospitals & ambulatory centers
7.2.1. Market size and forecast
7.2.2. Market analysis, by country
7.3. Research & academic institute
7.3.1. Market size and forecast
7.3.2. Market analysis, by country
7.4. Dental clinics
7.4.1. Market size and forecast
7.4.2. Market analysis, by country
CHAPTER 8: GLOBAL ORTHOBIOLOGICS MARKET, BY REGION
8.1. Overview
8.1.1. Market size and forecast
8.2. North America
8.2.1. Key market trends and opportunities
8.2.1.1. US
8.2.1.1.1. Market size and forecast, by product type
8.2.1.1.2. Market size and forecast, by application
8.2.1.1.3. Market size and forecast, by type
8.2.1.1.4. Market size and forecast, by end user
8.2.1.2. Canada
8.2.1.2.1. Market size and forecast, by product type
8.2.1.2.2. Market size and forecast, by application
8.2.1.2.3. Market size and forecast, by type
8.2.1.2.4. Market size and forecast, by end user
8.2.1.3. Mexico
8.2.1.3.1. Market size and forecast, by product type
8.2.1.3.2. Market size and forecast, by application
8.2.1.3.3. Market size and forecast, by type
8.2.1.3.4. Market size and forecast, by end user
8.2.2. North America Orthobiologics Market size and forecast, by product type
8.2.3. North America Orthobiologics Market size and forecast, by application
8.2.4. North America Orthobiologics Market size and forecast, by type
8.2.5. North America Orthobiologics Market size and forecast, by end user
8.2.6. North America Orthobiologics Market size and forecast, by region
8.3. Europe
8.3.1. Key market trends and opportunities
8.3.1.1. Germany
8.3.1.1.1. Market size and forecast, by product type
8.3.1.1.2. Market size and forecast, by application
8.3.1.1.3. Market size and forecast, by type
8.3.1.1.4. Market size and forecast, by end user
8.3.1.2. France
8.3.1.2.1. Market size and forecast, by product type
8.3.1.2.2. Market size and forecast, by application
8.3.1.2.3. Market size and forecast, by type
8.3.1.2.4. Market size and forecast, by end user
8.3.1.3. UK
8.3.1.3.1. Market size and forecast, by product type
8.3.1.3.2. Market size and forecast, by application
8.3.1.3.3. Market size and forecast, by type
8.3.1.3.4. Market size and forecast, by end user
8.3.1.4. Italy
8.3.1.4.1. Market size and forecast, by product type
8.3.1.4.2. Market size and forecast, by application
8.3.1.4.3. Market size and forecast, by type
8.3.1.4.4. Market size and forecast, by end user
8.3.1.5. Spain
8.3.1.5.1. Market size and forecast, by product type
8.3.1.5.2. Market size and forecast, by application
8.3.1.5.3. Market size and forecast, by type
8.3.1.5.4. Market size and forecast, by end user
8.3.1.6. Rest of Europe
8.3.1.6.1. Market size and forecast, by product type
8.3.1.6.2. Market size and forecast, by application
8.3.1.6.3. Market size and forecast, by type
8.3.1.6.4. Market size and forecast, by end user
8.3.2. Europe Orthobiologics Market size and forecast, by product type
8.3.3. Europe Orthobiologics Market size and forecast, by application
8.3.4. Europe Orthobiologics Market size and forecast, by type
8.3.5. Europe Orthobiologics Market size and forecast, by end user
8.3.6. Europe Orthobiologics Market size and forecast, by region
8.4. Asia-Pacific
8.4.1. Key market trends and opportunities
8.4.1.1. Japan
8.4.1.1.1. Market size and forecast, by product type
8.4.1.1.2. Market size and forecast, by application
8.4.1.1.3. Market size and forecast, by type
8.4.1.1.4. Market size and forecast, by end user
8.4.1.2. China
8.4.1.2.1. Market size and forecast, by product type
8.4.1.2.2. Market size and forecast, by application
8.4.1.2.3. Market size and forecast, by type
8.4.1.2.4. Market size and forecast, by end user
8.4.1.3. Australia
8.4.1.3.1. Market size and forecast, by product type
8.4.1.3.2. Market size and forecast, by application
8.4.1.3.3. Market size and forecast, by type
8.4.1.3.4. Market size and forecast, by end user
8.4.1.4. India
8.4.1.4.1. Market size and forecast, by product type
8.4.1.4.2. Market size and forecast, by application
8.4.1.4.3. Market size and forecast, by type
8.4.1.4.4. Market size and forecast, by end user
8.4.1.5. South Korea
8.4.1.5.1. Market size and forecast, by product type
8.4.1.5.2. Market size and forecast, by application
8.4.1.5.3. Market size and forecast, by type
8.4.1.5.4. Market size and forecast, by end user
8.4.1.6. Rest of Asia-Pacific
8.4.1.6.1. Market size and forecast, by product type
8.4.1.6.2. Market size and forecast, by application
8.4.1.6.3. Market size and forecast, by type
8.4.1.6.4. Market size and forecast, by end user
8.4.2. Asia-Pacific Orthobiologics Market size and forecast, by product type
8.4.3. Asia-Pacific Orthobiologics Market size and forecast, by application
8.4.4. Asia-Pacific Orthobiologics Market size and forecast, by type
8.4.5. Asia-Pacific Orthobiologics Market size and forecast, by end user
8.4.6. Asia-Pacific Orthobiologics Market size and forecast, by region
8.5. LAMEA
8.5.1. Key market trends and opportunities
8.5.1.1. Brazil
8.5.1.1.1. Market size and forecast, by product type
8.5.1.1.2. Market size and forecast, by application
8.5.1.1.3. Market size and forecast, by type
8.5.1.1.4. Market size and forecast, by end user
8.5.1.2. Saudi Arabia
8.5.1.2.1. Market size and forecast, by product type
8.5.1.2.2. Market size and forecast, by application
8.5.1.2.3. Market size and forecast, by type
8.5.1.2.4. Market size and forecast, by end user
8.5.1.3. South Africa
8.5.1.3.1. Market size and forecast, by product type
8.5.1.3.2. Market size and forecast, by application
8.5.1.3.3. Market size and forecast, by type
8.5.1.3.4. Market size and forecast, by end user
8.5.1.4. Rest of LAMEA
8.5.1.4.1. Market size and forecast, by product type
8.5.1.4.2. Market size and forecast, by application
8.5.1.4.3. Market size and forecast, by type
8.5.1.4.4. Market size and forecast, by end user
8.5.2. LAMEA Orthobiologics Market size and forecast, by product type
8.5.3. LAMEA Orthobiologics Market size and forecast, by application
8.5.4. LAMEA Orthobiologics Market size and forecast, by type
8.5.5. LAMEA Orthobiologics Market size and forecast, by end user
8.5.6. LAMEA Orthobiologics Market size and forecast, by region
CHAPTER 9: COMPANY PROFILES
9.1. ARTHREX, INC.
9.1.1. Company overview
9.1.2. Company snapshot
9.1.3. Operating business segments
9.1.4. Product portfolio
9.2. EXACTECH, INC.
9.2.1. Company overview
9.2.2. Company snapshot
9.2.3. Operating business segments
9.2.4. Product portfolio
9.2.5. Business performance
9.2.6. Key strategic moves and developments
9.3. GLOBUS MEDICAL INC.
9.3.1. Company overview
9.3.2. Company snapshot
9.3.3. Operating business segments
9.3.4. Product portfolio
9.3.5. Business performance
9.4. INTEGRA LIFESCIENCES HOLDINGS CORPORATION (DERMA SCIENCES INC.)
9.4.1. Company overview
9.4.2. Company snapshot
9.4.3. Operating business segments
9.4.4. Product portfolio
9.4.5. Business performance
9.5. JOHNSON & JOHNSON (DEPUY SYNTHES)
9.5.1. Company overview
9.5.2. Company snapshot
9.5.3. Operating business segments
9.5.4. Product portfolio
9.5.5. Business performance
9.5.6. Key strategic moves and developments
9.6. MEDLINE INDUSTRIES, INC.
9.6.1. Company overview
9.6.2. Company snapshot
9.6.3. Operating product segments
9.6.4. Product Portfolio
9.7. NUVASIVE INC.
9.7.1. Company overview
9.7.2. Company snapshot
9.7.3. Operating business segments
9.7.4. Product portfolio
9.7.5. Business performance
9.7.6. Key strategic moves and developments
9.8. STRYKER CORPORATION
9.8.1. Company overview
9.8.2. Company snapshot
9.8.3. Operating business segments
9.8.4. Product portfolio
9.8.5. Business performance
9.8.6. Key strategic moves and developments
9.9. WRIGHT MEDICAL GROUP, INC.
9.9.1. Company overview
9.9.2. Company snapshot
9.9.3. Operating business segments
9.9.4. Product portfolio
9.9.5. Business performance
9.9.6. Key strategic moves and developments
9.10. ZIMMER BIOMET HOLDINGS, INC
9.10.1. Company overview
9.10.2. Company snapshot
9.10.3. Operating business segments
9.10.4. Product portfolio
9.10.5. Business performance
9.10.6. Key strategic moves and developments
LIST OF TABLES
TABLE 01. GLOBAL ORTHOBIOLOGICS MARKET, BY PRODUCT TYPE, 20172025 ($MILLION)
TABLE 02. DEMINERALIZED BONE MATRIX (DBM) ORTHOBIOLOGICS MARKET, BY REGION, 20172025 ($MILLION)
TABLE 03. ALLOGRAFT ORTHOBIOLOGICS MARKET, BY REGION, 20172025 ($MILLION)
TABLE 04. BONE MORPHOGENETIC PROTEIN (BMP) ORTHOBIOLOGICS MARKET, BY REGION, 20172025 ($MILLION)
TABLE 05. VISCOSUPPLEMENTATION PRODUCTS ORTHOBIOLOGICS MARKET, BY REGION, 20172025 ($MILLION)
TABLE 06. SYNTHETIC BONE SUBSTITUTES ORTHOBIOLOGICS MARKET, BY REGION, 20172025 ($MILLION)
TABLE 07. OTHERS ORTHOBIOLOGICS MARKET, BY REGION, 20172025 ($MILLION)
TABLE 08. GLOBAL ORTHOBIOLOGICS MARKET, BY APPLICATION, 20172025 ($MILLION)
TABLE 09. OSTEOARTHRITIS & DEGENERATIVE ARTHRITIS ORTHOBIOLOGICS MARKET, BY REGION, 20172025 ($MILLION)
TABLE 10. SPINAL FUSION ORTHOBIOLOGICS MARKET, BY REGION, 20172025 ($MILLION)
TABLE 11. FRACTURE RECOVERY ORTHOBIOLOGICS MARKET, BY REGION, 20172025 ($MILLION)
TABLE 12. SOFT TISSUE INJURIES ORTHOBIOLOGICS MARKET, BY REGION, 20172025 ($MILLION)
TABLE 13. MAXILLOFACIAL & DENTAL APPLICATIONS ORTHOBIOLOGICS MARKET, BY REGION, 20172025 ($MILLION)
TABLE 14. GLOBAL ORTHOBIOLOGICS MARKET, BY TYPE, 20172025 ($MILLION)
TABLE 15. KNEE ORTHOBIOLOGICS MARKET, BY REGION, 20172025 ($MILLION)
TABLE 16. ANKLE ORTHOBIOLOGICS MARKET, BY REGION, 20172025 ($MILLION)
TABLE 17. HIP ORTHOBIOLOGICS MARKET, BY REGION, 20172025 ($MILLION)
TABLE 18. WRIST & SHOULDER ORTHOBIOLOGICS MARKET, BY REGION, 20172025 ($MILLION)
TABLE 19. SPINE ORTHOBIOLOGICS MARKET, BY REGION, 20172025 ($MILLION)
TABLE 20. OTHERS ORTHOBIOLOGICS MARKET, BY REGION, 20172025 ($MILLION)
TABLE 21. GLOBAL ORTHOBIOLOGICS MARKET, BY END USER, 20172025 ($MILLION)
TABLE 22. HOSPITALS & AMBULATORY CENTERS ORTHOBIOLOGICS MARKET, BY REGION, 20172025 ($MILLION)
TABLE 23. RESEARCH & ACADEMIC INSTITUTE ORTHOBIOLOGICS MARKET, BY REGION, 20172025 ($MILLION)
TABLE 24. DENTAL CLINICS ORTHOBIOLOGICS MARKET, BY REGION, 20172025 ($MILLION)
TABLE 25. GLOBAL ORTHOBIOLOGICS MARKET BY REGION, 2017-2025, ($MILLION)
TABLE 26. US ORTHOBIOLOGICS MARKET BY PRODUCT TYPE, 2017-2025, ($MILLION)
TABLE 27. US ORTHOBIOLOGICS MARKET BY APPLICATION, 2017-2025, ($MILLION)
TABLE 28. US ORTHOBIOLOGICS MARKET BY TYPE, 2017-2025, ($MILLION)
TABLE 29. US ORTHOBIOLOGICS MARKET BY END USER 2017-2025, ($MILLION)
TABLE 30. CANADA ORTHOBIOLOGICS MARKET BY PRODUCT TYPE, 2017-2025, ($MILLION)
TABLE 31. CANADA ORTHOBIOLOGICS MARKET BY APPLICATION, 2017-2025, ($MILLION)
TABLE 32. CANADA ORTHOBIOLOGICS MARKET BY TYPE, 2017-2025, ($MILLION)
TABLE 33. CANADA ORTHOBIOLOGICS MARKET BY END USER 2017-2025, ($MILLION)
TABLE 34. MEXICO ORTHOBIOLOGICS MARKET BY PRODUCT TYPE, 2017-2025, ($MILLION)
TABLE 35. MEXICO ORTHOBIOLOGICS MARKET BY APPLICATION, 2017-2025, ($MILLION)
TABLE 36. MEXICO ORTHOBIOLOGICS MARKET BY TYPE, 2017-2025, ($MILLION)
TABLE 37. MEXICO ORTHOBIOLOGICS MARKET BY END USER 2017-2025, ($MILLION)
TABLE 38. NORTH AMERICA ORTHOBIOLOGICS MARKET BY PRODUCT TYPE, 2017-2025, ($MILLION)
TABLE 39. NORTH AMERICA ORTHOBIOLOGICS MARKET BY APPLICATION, 2017-2025, ($MILLION)
TABLE 40. NORTH AMERICA ORTHOBIOLOGICS MARKET BY TYPE, 2017-2025, ($MILLION)
TABLE 41. NORTH AMERICA ORTHOBIOLOGICS MARKET BY END USER 2017-2025, ($MILLION)
TABLE 42. NORTH AMERICA ORTHOBIOLOGICS MARKET BY REGION 2017-2025, ($MILLION)
TABLE 43. GERMANY ORTHOBIOLOGICS MARKET BY PRODUCT TYPE, 2017-2025, ($MILLION)
TABLE 44. GERMANY ORTHOBIOLOGICS MARKET BY APPLICATION, 2017-2025, ($MILLION)
TABLE 45. GERMANY ORTHOBIOLOGICS MARKET BY TYPE, 2017-2025, ($MILLION)
TABLE 46. GERMANY ORTHOBIOLOGICS MARKET BY END USER 2017-2025, ($MILLION)
TABLE 47. FRANCE ORTHOBIOLOGICS MARKET BY PRODUCT TYPE, 2017-2025, ($MILLION)
TABLE 48. FRANCE ORTHOBIOLOGICS MARKET BY APPLICATION, 2017-2025, ($MILLION)
TABLE 49. FRANCE ORTHOBIOLOGICS MARKET BY TYPE, 2017-2025, ($MILLION)
TABLE 50. FRANCE ORTHOBIOLOGICS MARKET BY END USER 2017-2025, ($MILLION)
TABLE 51. UK ORTHOBIOLOGICS MARKET BY PRODUCT TYPE, 2017-2025, ($MILLION)
TABLE 52. UK ORTHOBIOLOGICS MARKET BY APPLICATION, 2017-2025, ($MILLION)
TABLE 53. UK ORTHOBIOLOGICS MARKET BY TYPE, 2017-2025, ($MILLION)
TABLE 54. UK ORTHOBIOLOGICS MARKET BY END USER 2017-2025, ($MILLION)
TABLE 55. ITALY ORTHOBIOLOGICS MARKET BY PRODUCT TYPE, 2017-2025, ($MILLION)
TABLE 56. ITALY ORTHOBIOLOGICS MARKET BY APPLICATION, 2017-2025, ($MILLION)
TABLE 57. ITALY ORTHOBIOLOGICS MARKET BY TYPE, 2017-2025, ($MILLION)
TABLE 58. ITALY ORTHOBIOLOGICS MARKET BY END USER 2017-2025, ($MILLION)
TABLE 59. SPAIN ORTHOBIOLOGICS MARKET BY PRODUCT TYPE, 2017-2025, ($MILLION)
TABLE 60. SPAIN ORTHOBIOLOGICS MARKET BY APPLICATION, 2017-2025, ($MILLION)
TABLE 61. SPAIN ORTHOBIOLOGICS MARKET BY TYPE, 2017-2025, ($MILLION)
TABLE 62. SPAIN ORTHOBIOLOGICS MARKET BY END USER 2017-2025, ($MILLION)
TABLE 63. REST OF EUROPE ORTHOBIOLOGICS MARKET BY PRODUCT TYPE, 2017-2025, ($MILLION)
TABLE 64. REST OF EUROPE ORTHOBIOLOGICS MARKET BY APPLICATION, 2017-2025, ($MILLION)
TABLE 65. REST OF EUROPE ORTHOBIOLOGICS MARKET BY TYPE, 2017-2025, ($MILLION)
TABLE 66. REST OF EUROPE ORTHOBIOLOGICS MARKET BY END USER 2017-2025, ($MILLION)
TABLE 67. EUROPE ORTHOBIOLOGICS MARKET BY PRODUCT TYPE, 2017-2025, ($MILLION)
TABLE 68. EUROPE ORTHOBIOLOGICS MARKET BY APPLICATION, 2017-2025, ($MILLION)
TABLE 69. EUROPE ORTHOBIOLOGICS MARKET BY TYPE, 2017-2025, ($MILLION)
TABLE 70. EUROPE ORTHOBIOLOGICS MARKET BY END USER 2017-2025, ($MILLION)
TABLE 71. EUROPE ORTHOBIOLOGICS MARKET BY REGION 2017-2025, ($MILLION)
TABLE 72. JAPAN ORTHOBIOLOGICS MARKET BY PRODUCT TYPE, 2017-2025, ($MILLION)
TABLE 73. JAPAN ORTHOBIOLOGICS MARKET BY APPLICATION, 2017-2025, ($MILLION)
TABLE 74. GERMANY ORTHOBIOLOGICS MARKET BY TYPE, 2017-2025, ($MILLION)
TABLE 75. JAPAN ORTHOBIOLOGICS MARKET BY END USER 2017-2025, ($MILLION)
TABLE 76. CHINA ORTHOBIOLOGICS MARKET BY PRODUCT TYPE, 2017-2025, ($MILLION)
TABLE 77. CHINA ORTHOBIOLOGICS MARKET BY APPLICATION, 2017-2025, ($MILLION)
TABLE 78. CHINA ORTHOBIOLOGICS MARKET BY TYPE, 2017-2025, ($MILLION)
TABLE 79. CHINA ORTHOBIOLOGICS MARKET BY END USER 2017-2025, ($MILLION)
TABLE 80. AUSTRALIA ORTHOBIOLOGICS MARKET BY PRODUCT TYPE, 2017-2025, ($MILLION)
TABLE 81. AUSTRALIA ORTHOBIOLOGICS MARKET BY APPLICATION, 2017-2025, ($MILLION)
TABLE 82. AUSTRALIA ORTHOBIOLOGICS MARKET BY TYPE, 2017-2025, ($MILLION)
TABLE 83. UK ORTHOBIOLOGICS MARKET BY END USER 2017-2025, ($MILLION)
TABLE 84. INDIA ORTHOBIOLOGICS MARKET BY PRODUCT TYPE, 2017-2025, ($MILLION)
TABLE 85. INDIA ORTHOBIOLOGICS MARKET BY APPLICATION, 2017-2025, ($MILLION)
TABLE 86. INDIA ORTHOBIOLOGICS MARKET BY TYPE, 2017-2025, ($MILLION)
TABLE 87. INDIA ORTHOBIOLOGICS MARKET BY END USER 2017-2025, ($MILLION)
TABLE 88. SOUTH KOREA ORTHOBIOLOGICS MARKET BY PRODUCT TYPE, 2017-2025, ($MILLION)
TABLE 89. SOUTH KOREA ORTHOBIOLOGICS MARKET BY APPLICATION, 2017-2025, ($MILLION)
TABLE 90. SOUTH KOREA ORTHOBIOLOGICS MARKET BY TYPE, 2017-2025, ($MILLION)
TABLE 91. SOUTH KOREA ORTHOBIOLOGICS MARKET BY END USER 2017-2025, ($MILLION)
TABLE 92. REST OF ASIA-PACIFIC ORTHOBIOLOGICS MARKET BY PRODUCT TYPE, 2017-2025, ($MILLION)
TABLE 93. REST OF ASIA-PACIFIC ORTHOBIOLOGICS MARKET BY APPLICATION, 2017-2025, ($MILLION)
TABLE 94. REST OF ASIA-PACIFIC ORTHOBIOLOGICS MARKET BY TYPE, 2017-2025, ($MILLION)
TABLE 95. REST OF ASIA-PACIFIC ORTHOBIOLOGICS MARKET BY END USER 2017-2025, ($MILLION)
TABLE 96. ASIA-PACIFIC ORTHOBIOLOGICS MARKET BY PRODUCT TYPE, 2017-2025, ($MILLION)
TABLE 97. ASIA-PACIFIC ORTHOBIOLOGICS MARKET BY APPLICATION, 2017-2025, ($MILLION)
TABLE 98. ASIA-PACIFIC ORTHOBIOLOGICS MARKET BY TYPE, 2017-2025, ($MILLION)
TABLE 99. ASIA-PACIFIC ORTHOBIOLOGICS MARKET BY END USER 2017-2025, ($MILLION)
TABLE 100. ASIA-PACIFIC ORTHOBIOLOGICS MARKET BY REGION 2017-2025, ($MILLION)
TABLE 101. BRAZIL ORTHOBIOLOGICS MARKET BY PRODUCT TYPE, 2017-2025, ($MILLION)
TABLE 102. BRAZIL ORTHOBIOLOGICS MARKET BY APPLICATION, 2017-2025, ($MILLION)
TABLE 103. BRAZIL ORTHOBIOLOGICS MARKET BY TYPE, 2017-2025, ($MILLION)
TABLE 104. BRAZIL ORTHOBIOLOGICS MARKET BY END USER 2017-2025, ($MILLION)
TABLE 105. SAUDI ARABIA ORTHOBIOLOGICS MARKET BY PRODUCT TYPE, 2017-2025, ($MILLION)
TABLE 106. SAUDI ARABIA ORTHOBIOLOGICS MARKET BY APPLICATION, 2017-2025, ($MILLION)
TABLE 107. SAUDI ARABIA ORTHOBIOLOGICS MARKET BY TYPE, 2017-2025, ($MILLION)
TABLE 108. SAUDI ARABIA ORTHOBIOLOGICS MARKET BY END USER 2017-2025, ($MILLION)
TABLE 109. SOUTH AFRICA ORTHOBIOLOGICS MARKET BY PRODUCT TYPE, 2017-2025, ($MILLION)
TABLE 110. SOUTH AFRICA ORTHOBIOLOGICS MARKET BY APPLICATION, 2017-2025, ($MILLION)
TABLE 111. SOUTH AFRICA ORTHOBIOLOGICS MARKET BY TYPE, 2017-2025, ($MILLION)
TABLE 112. SOUTH AFRICA ORTHOBIOLOGICS MARKET BY END USER 2017-2025, ($MILLION)
TABLE 113. REST OF LAMEA ORTHOBIOLOGICS MARKET BY PRODUCT TYPE, 2017-2025, ($MILLION)
TABLE 114. REST OF LAMEA ORTHOBIOLOGICS MARKET BY APPLICATION, 2017-2025, ($MILLION)
TABLE 115. REST OF LAMEA ORTHOBIOLOGICS MARKET BY TYPE, 2017-2025, ($MILLION)
TABLE 116. REST OF LAMEA ORTHOBIOLOGICS MARKET BY END USER 2017-2025, ($MILLION)
TABLE 117. LAMEA ORTHOBIOLOGICS MARKET BY PRODUCT TYPE, 2017-2025, ($MILLION)
TABLE 118. LAMEA ORTHOBIOLOGICS MARKET BY APPLICATION, 2017-2025, ($MILLION)
TABLE 119. LAMEA ORTHOBIOLOGICS MARKET BY TYPE, 2017-2025, ($MILLION)
TABLE 120. LAMEA ORTHOBIOLOGICS MARKET BY END USER 2017-2025, ($MILLION)
TABLE 121. LAMEA ORTHOBIOLOGICS MARKET BY REGION 2017-2025, ($MILLION)
TABLE 122. ARTHREX: COMPANY SNAPSHOT
TABLE 123. ARTHREX: OPERATING SEGMENTS
TABLE 124. ARTHREX: PRODUCT PORTFOLIO
TABLE 125. EXACTEC INC.: COMPANY SNAPSHOT
TABLE 126. EXACTEC INC.: OPERATING SEGMENTS
TABLE 127. EXACTEC INC.: PRODUCT PORTFOLIO
TABLE 128. GLOBUS MEDICAL, INC.: COMPANY SNAPSHOT
TABLE 129. GLOBUS MEDICAL, INC.: OPERATING SEGMENTS
TABLE 130. GLOBUS MEDICAL, INC.: PRODUCT PORTFOLIO
TABLE 131. INTEGRA: COMPANY SNAPSHOT
TABLE 132. INTEGRA: OPERATING SEGMENTS
TABLE 133. INTEGRA: PRODUCT PORTFOLIO
TABLE 134. J&J: COMPANY SNAPSHOT
TABLE 135. J&J: OPERATING SEGMENTS
TABLE 136. J&J: PRODUCT PORTFOLIO
TABLE 137. MEDLINE: COMPANY SNAPSHOT
TABLE 138. MEDLINE: PRODUCT SEGMENTS
TABLE 139. MEDLINE: PRODUCT PORTFOLIO
TABLE 140. NUVASIVE, INC.: COMPANY SNAPSHOT
TABLE 141. NUVASIVE, INC.: OPERATING SEGMENTS
TABLE 142. NUVASIVE, INC.: PRODUCT PORTFOLIO
TABLE 143. STRYKER: COMPANY SNAPSHOT
TABLE 144. STRYKER: OPERATING SEGMENTS
TABLE 145. STRYKER: PRODUCT PORTFOLIO
TABLE 146. WRIGHT COMPANY SNAPSHOT
TABLE 147. WRIGHT: PRODUCT SEGMENTS
TABLE 148. WRIGHT: PRODUCT PORTFOLIO
TABLE 149. ZIMMER COMPANY SNAPSHOT
TABLE 150. ZIMMER: PRODUCT SEGMENTS
TABLE 151. ZIMMER: PRODUCT PORTFOLIO
LIST OF FIGURES
FIGURE 01. GLOBAL ORTHOBIOLOGICS MARKET SEGMENTATION
FIGURE 02. TOP INVESTMENT POCKETS
FIGURE 03. TOP WINNING STRATEGIES, BY YEAR, 20152018*
FIGURE 04. TOP WINNING STRATEGIES, BY DEVELOPMENT, 20152018* (%)
FIGURE 05. TOP WINNING STRATEGIES, BY COMPANY, 20152018*
FIGURE 06. LOW BARGAINING POWER OF SUPPLIERS
FIGURE 07. MODERATE BARGAINING POWER OF BUYERS
FIGURE 08. MODERATE THREAT OF NEW ENTRANTS
FIGURE 09. LOW THREAT OF SUBSTITUTES
FIGURE 10. LOW INTENSITY OF COMPETITIVE RIVALRY
FIGURE 11. GLOBAL ORTHOBIOLOGICS MARKET DYNAMICS
FIGURE 12. TOP PLAYER POSITIONNG, 2017
FIGURE 13. COMPARATIVE ANALYSIS OF DEMINERALIZED BONE MATRIX (DBM) ORTHOBIOLOGICS MARKET, BY COUNTRY, 2017 & 2025 ($MILLION)
FIGURE 14. COMPARATIVE ANALYSIS OF ALLOGRAFT ORTHOBIOLOGICS MARKET, BY COUNTRY, 2017 & 2025 ($MILLION)
FIGURE 15. COMPARATIVE ANALYSIS OF BONE MORPHOGENETIC PROTEIN (BMP) ORTHOBIOLOGICS MARKET, BY COUNTRY, 2017 & 2025 ($MILLION)
FIGURE 16. COMPARATIVE ANALYSIS OF VISCOSUPPLEMENTATION PRODUCTS ORTHOBIOLOGICS MARKET, BY COUNTRY, 2017 & 2025 ($MILLION)
FIGURE 17. COMPARATIVE ANALYSIS OF SYNTHETIC BONE SUBSTITUTES ORTHOBIOLOGICS MARKET, BY COUNTRY, 2017 & 2025 ($MILLION)
FIGURE 18. COMPARATIVE ANALYSIS OF OTHERS ORTHOBIOLOGICS MARKET, BY COUNTRY, 2017 & 2025 ($MILLION)
FIGURE 19. COMPARATIVE ANALYSIS OF OSTEOARTHRITIS & DEGENERATIVE ARTHRITIS ORTHOBIOLOGICS MARKET, BY COUNTRY, 2017 & 2025 ($MILLION)
FIGURE 20. COMPARATIVE ANALYSIS OF SPINAL FUSION ORTHOBIOLOGICS MARKET, BY COUNTRY, 2017 & 2025 ($MILLION)
FIGURE 21. COMPARATIVE ANALYSIS OF FRACTURE RECOVERY ORTHOBIOLOGICS MARKET, BY COUNTRY, 2017 & 2025 ($MILLION)
FIGURE 22. COMPARATIVE ANALYSIS OF SOFT TISSUE INJURIES ORTHOBIOLOGICS MARKET, BY COUNTRY, 2017 & 2025 ($MILLION)
FIGURE 23. COMPARATIVE ANALYSIS OF MAXILLOFACIAL & DENTAL APPLICATIONS ORTHOBIOLOGICS MARKET, BY COUNTRY, 2017 & 2025 ($MILLION)
FIGURE 24. COMPARATIVE ANALYSIS OF KNEE ORTHOBIOLOGICS MARKET, BY COUNTRY, 2017 & 2025 ($MILLION)
FIGURE 25. COMPARATIVE ANALYSIS OF ANKLE ORTHOBIOLOGICS MARKET, BY COUNTRY, 2017 & 2025 ($MILLION)
FIGURE 26. COMPARATIVE ANALYSIS OF HIP ORTHOBIOLOGICS MARKET, BY COUNTRY, 2017 & 2025 ($MILLION)
FIGURE 27. COMPARATIVE ANALYSIS OF WRIST & SHOULDER ORTHOBIOLOGICS MARKET, BY COUNTRY, 2017 & 2025 ($MILLION)
FIGURE 28. COMPARATIVE ANALYSIS OF SPINE ORTHOBIOLOGICS MARKET, BY COUNTRY, 2017 & 2025 ($MILLION)
FIGURE 29. COMPARATIVE ANALYSIS OF OTHERS ORTHOBIOLOGICS MARKET, BY COUNTRY, 2017 & 2025 ($MILLION)
FIGURE 30. COMPARATIVE ANALYSIS OF HOSPITALS & AMBULATORY CENTERS ORTHOBIOLOGICS MARKET, BY COUNTRY, 2017 & 2025 ($MILLION)
FIGURE 31. COMPARATIVE ANALYSIS OF RESEARCH & ACADEMIC INSTITUTE ORTHOBIOLOGICS MARKET, BY COUNTRY, 2017 & 2025 ($MILLION)
FIGURE 32. COMPARATIVE ANALYSIS OF DENTAL CLINICS ORTHOBIOLOGICS MARKET, BY COUNTRY, 2017 & 2025 ($MILLION)
FIGURE 33. EXACTEC INC. NET SALES, 20142016 ($MILLION)
FIGURE 34. EXACTEC INC.: REVENUE SHARE BY SEGMENT, 2018 (%)
FIGURE 35. GLOBUS MEDICAL, INC.: NET SALES, 20152017 ($MILLION)
FIGURE 36. GLOBUS MEDICAL, INC.: REVENUE SHARE BY SEGMENT, 2017 (%)
FIGURE 37. GLOBUS MEDICAL, INC.: REVENUE SHARE BY REGION, 2017 (%)
FIGURE 38. INTEGRA: NET SALES, 20152018 ($MILLION)
FIGURE 39. INTEGRA: REVENUE SHARE BY SEGMENT, 2018 (%)
FIGURE 40. INTEGRA: REVENUE SHARE BY GEOGRAPY, 2018 (%)
FIGURE 41. J&J: NET SALES, 20162018 ($MILLION)
FIGURE 42. J&J: REVENUE SHARE BY SEGMENT, 2018 (%)
FIGURE 43. J&J: REVENUE SHARE BY REGION, 2018 (%)
FIGURE 44. NUVASIVE, INC.: NET SALES, 20152017 ($MILLION)
FIGURE 45. NUVASIVE, INC.: REVENUE SHARE BY SEGMENT, 2017 (%)
FIGURE 46. STRYKER: NET SALES, 20152017 ($MILLION)
FIGURE 47. STRYKER: REVENUE SHARE BY SEGMENT, 2017 (%)
FIGURE 48. STRYKER: REVENUE SHARE BY REGION, 2017 (%)
FIGURE 49. WRETH: NET SALES, 20152017 ($MILLION)
FIGURE 50. WRIGHT: REVENUE SHARE BY PRODUCT, 2017 (%)
FIGURE 51. WRIGHT: REVENUE SHARE BY REGION, 2017 (%)
FIGURE 52. ZIMMER: NET SALES, 20152018 ($MILLION)
FIGURE 53. ZIMMER: NET SALES, BY SEGMENT 2018 (%)
FIGURE 54. ZIMMER: NET SALES BY REGION 2018 (%)
Orthobiologics are biological substances designed with the capability to promote healing of the cartilage, ligament, muscle tendon, and others. Orthobiologics constitute of stem cells, extracellular membrane, platelet rich plasma (PRP), and others. These are available demineralized bone matrix (DBM), allograft, bone morphogenetic protein (BMP), viscosupplementation products, synthetic bone substitutes, and other types. Orthobiologics are used in the treatment of various diseases such as osteoarthritis & degenerative arthritis spinal fusion, fracture recovery, and soft tissue injuries. These are also used in maxillofacial & dental applications. The key factor responsible for the growth of orthobiologics market is rise in geriatric population, which is more prone to diseases such as osteoarthritis and others. The other factors that drive the growth of this market include increase in number of road accident & sports related accidents, surge in obesity across the globe, and rise in awareness among patients and athletes related to the use of orthobiologics.
North America accounted for the highest market share in 2017, due to availability of orthobiologics, increased in obesity, and favorable reimbursement rates, followed by Europe and Asia-Pacific. In addition, pharmaceutical companies have focused on expanding their presence in emerging economies, which is anticipated to drive the market growth.
Start reading instantly.
This Report and over 66,804+ more Reports, Available with Avenue Library. T&C*.
Enterprise
License/PDF
Library
Membership
*Taxes/Fees, if applicable will be added during checkout. All prices in USD
To ensure high-level data integrity, accurate analysis, and impeccable forecasts
For complete satisfaction
On-demand customization of scope of the report to exactly meet your needs
Targeted market view to provide pertinent information and save time of readers
Get insights on topics that are crucial for your business. Stay abreast of your interest areas.
Get Industry Data AlertsTo ensure high-level data integrity, accurate analysis, and impeccable forecasts
For complete satisfaction
On-demand customization of scope of the report to exactly meet your needs
Targeted market view to provide pertinent information and save time of readers