0
2018
Orthopedic Orthotics Market

Orthopedic Orthotics Market

by Posture (Static Orthotic Devices, and Dynamic Orthotic Devices), Anatomical Region (Upper Limb Orthotic Devices, Lower Limb Orthotic Devices, and Spinal Orthotic Devices), and Manufacturing (Prefabricated Orthotic Devices, Custom-Fitted Orthotic Devices, and Custom-Fabricated Orthotic Devices) - Global Opportunity Analysis and Industry Forecast, 2017-2023

Report Code: A02432
Jan 2018 | Pages: 210
Tables: 118
Charts: 47
  • Formats*:

  • pdf

    Single User License, Five User
    License & Enterprise User License

  • xls

    Data Pack Excel License

  • ppt

    It comes with the additional cost
    of $2500.00 contact sales.


COVID-19

Pandemic disrupted the entire world and affected many industries.

Get detailed COVID-19 impact analysis on the Orthopedic Orthotics Market

Request Now !

Orthopedic Orthotics Market Overview:

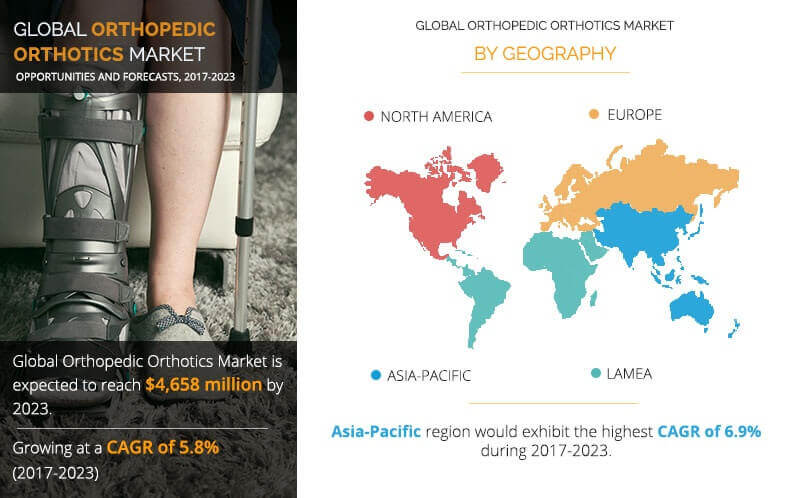
The Global Orthopedic Orthotics Market was valued at $3,130 million in 2016, and is projected to reach $4,658 million by 2023, growing at a CAGR of 5.8% during the study period. Orthotic devices include braces, splints, and other artificial external devices that are commonly used to treat conditions of the upper and lower extremities, frequently for patients with spina bifida, muscular dystrophy, and multiple sclerosis. Growth in geriatric population susceptible to osteoporosis, osteoarthritis, and other bone disorders, rise in prevalence of bone injuries and increase in sports-related injuries due to growing physical health consciousness fuel the market growth are expected to drive the growth of the global optical fibers in endoscopy market. However, high cost of the customized orthotic devices are expected to restrain the market growth.

Increase in incidence of arthritis is one of the prime reasons for the rise in adoption of orthotic devices. For instance, according to the Arthritis Foundation, in the U.S., knee osteoarthritis (OA) increases every decade, mainly in the age group 55 and 64 years. In 2016, there were around 14 million individuals in the U.S. suffering with symptomatic knee osteoarthritis.

In addition, increase in geriatric population is expected to further boost the market growth. The elderly population has led to an increase in the number of high-risk patients for occurrence of orthopedic disorders, including those with comorbidities and/or compromised immunity. According to an article published in Tohoku Journal of Experimental Medicine in February 2016, approximately 23.1% of the Japanese population was aged > 65 years and 11.4% was aged >75 years at the end of 2010. By 2025, it is estimated that 30.5% of the population will be aged >65 years.

Moreover, with the rise in road accidents, increase in aging population, and high incidence of sport-related injuries, the prevalence of chronic arthritis and other orthopedic diseases has rapidly increased in this region. For instance, around 15% (180 million) of the population suffered from arthritis as stated by the National Health Portal, India in 2015.

Orthopedic Orthotics Market Segmentation

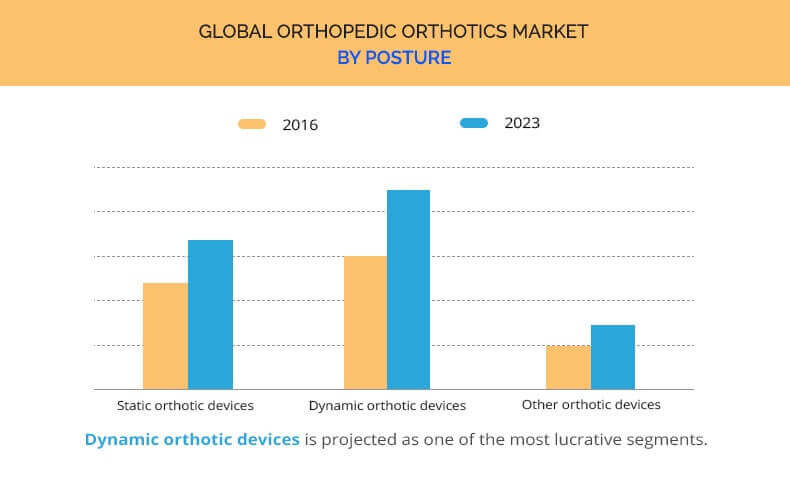
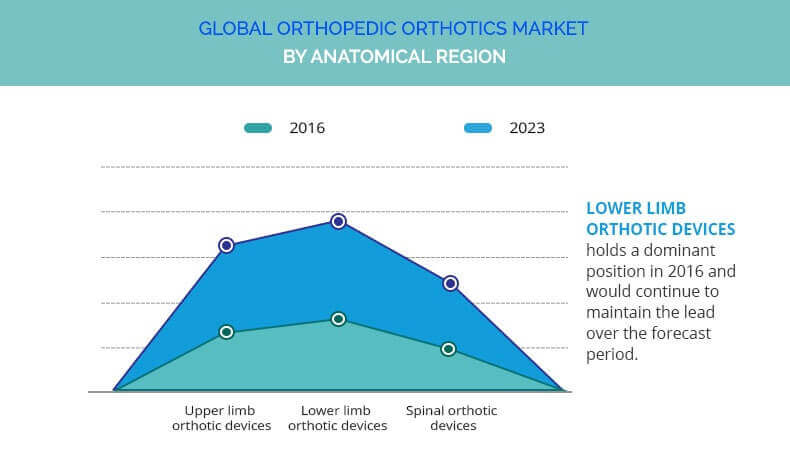
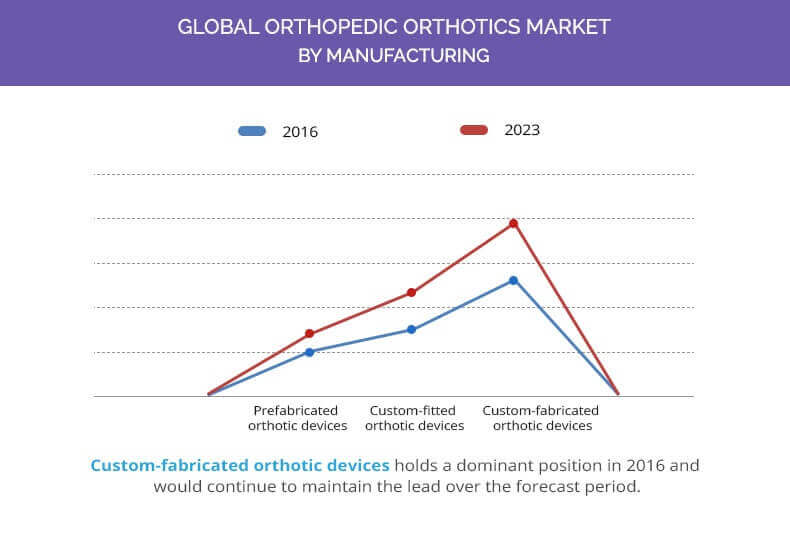
The global orthopedic orthotics market is segmented on the basis of posture, anatomical region, manufacturing, and region. Based on posture, it is categorized into static orthotic device, dynamic orthotic device, and other orthotic devices. On the basis of anatomical region, the market is divided into upper limb orthotic devices, lower limb orthotic devices, and spinal orthotic devices. Based on the manufacturing, it is classified into prefabricated orthotic devices, custom-fitted orthotic devices, and custom-fabricated orthotic devices. By region, it is analyzed across North America, Europe, Asia-Pacific, and LAMEA.

The key companies operating in the orthopedic orthotics market includes Bauerfeind AG, Breg, Inc., BSN Medical, DeRoyal Industries, Inc., DJO Global, Ossur, Ottobock, and Truelife, Hanger, Inc., and Fillauer LLC.

Key Benefits

  • The study provides an in-depth analysis of the global optical fibers in endoscopy market, with current trends and future estimations to elucidate the imminent investment pockets.
  • Quantitative analysis from 2014 to 2022 is expected to enable the stakeholders to capitalize on prevailing market opportunities.
  • The report provides data for 2014 and year-on-year forecast from 2016 to 2022.
  • Comprehensive analysis of all geographical regions is provided to determine the prevailing opportunities.
  • Extensive analysis is conducted by closely following key product positioning and monitoring the top contenders within the market framework.

Orthopedic Orthotics Market Key Segments:

By Posture

  • Static Orthotic Devices
  • Dynamic Orthotic Devices
  • Other Orthotic Devices

By Anatomical Region

  • Upper Limb Orthotic Devices
    • Shoulder Orthotic Devices
    • Elbow Orthotic Devices
    • Hand & Wrist Orthotic Devices
    • Other Upper Limb Orthotic Devices
  • Lower Limb Orthotic Devices
    • Foot & Ankle Orthotic Devices
    • Knee Orthotic Devices
    • Hip Orthotic Devices
    • Other Lower Limb Orthotic Devices
  • Spinal Orthotic Devices
    • Cervical Orthotic Devices (CO)    
    • Lumbosacral Orthotic Devices (LSO)
    • Thoracic-Lumbo-Sacral Orthotic Devices (TLSO)    
    • Cervical-Thoracic-Lumbar-Sacral Orthotic Devices (CTLSO)
    • Other Spinal Orthotic Devices

By Manufacturing

  • Prefabricated Orthotic Devices
  • Custom-fitted Orthotic Devices
  • Custom-fabricated Orthotic Devices

By Region

  • North America
    • U.S.
    • Canada
    • Mexico
  • Europe
    • Germany
    • France
    • UK
    • Italy
    • Spain
    • Rest of Europe
  • Asia-Pacific
    • Japan
    •  China
    •  India
    •  Australia
    • Rest of Asia-Pacific
  • LAMEA
    • Brazil
    •  Saudi Arabia
    •  South Africa
    •  Rest of LAMEA

Orthopedic Orthotics Market Report Highlights

Aspects Details
By ANATOMICAL REGION
  • UPPER LIMB ORTHOTIC DEVICES
    • Shoulder orthotic devices
    • Hand & wrist orthotic device
    • Elbow orthotic devices
    • Other upper limb orthotic devices
  • LOWER LIMB ORTHOTIC DEVICES
    • Foot & ankle orthotic devices
    • Knee orthotic devices
    • Hip orthotic devices
    • Other lower limb orthotic devices
  • SPINAL ORTHOTIC DEVICES
    • Cervical orthotic devices
    • Lumbosacral orthotic devices
    • Thoracic-lumbo-sacral orthotic devices
    • Cervical-thoracic-lumbar-sacral orthotic devices
    • Other spinal orthotic devices
By POSTURE
  • STATIC ORTHOTIC DEVICES
  • DYNAMIC ORTHOTIC DEVICES
  • OTHER ORTHOTIC DEVICES
By MANUFACTURING
  • PREFABRICATED ORTHOTIC DEVICES
  • CUSTOM FITTED
  • CUSTOM FABRICATED
By Region
  • North America  (U.S., Canada, Mexico)
  • Europe  (France, Germany, Italy, Spain, UK, Russia, Rest of Europe)
  • Asia-Pacific  (China, Japan, India, South Korea, Australia, Thailand, Malaysia, Indonesia, Rest of Asia-Pacific)
  • LAMEA  (Brazil, South Africa, Saudi Arabia, UAE, Argentina, Rest of LAMEA)
Key Market Players HANGER, INC., SVENSKA CELLULOSA AKTIEBOLAGET (BSN MEDICAL LUXEMBOURG GROUP HOLDING S.A R.L.), FILLAUER LLC, JO, LLC, OTTO BOCK HEALTHCARE GMBH, ÖSSUR HF., TRULIFE, BAUERFEIND AG, BREG, INC., DEROYAL INDUSTRIES, INC.
 

CHAPTER 1 INTRODUCTION

1.1. REPORT DESCRIPTION
1.2. KEY BENEFITS FOR STAKEHOLDERS
1.3. KEY MARKET SEGMENTS
1.4. RESEARCH METHODOLOGY

1.4.1. Secondary research
1.4.2. Primary research
1.4.3. Analyst tools and models

CHAPTER 2 EXECUTIVE SUMMARY

2.1. KEY FINDINGS OF THE STUDY
2.2. CXO PERSPECTIVE

CHAPTER 3 MARKET OVERVIEW

3.1. MARKET DEFINITION AND SCOPE
3.2. KEY FINDINGS

3.2.1. Top investment pockets
3.2.2. Top winning strategies

3.3. MARKET SHARE ANALYSIS
3.4. MARKET DYNAMICS

3.4.1. Drivers

3.4.1.1. Rapidly aging population
3.4.1.2. High incidence of orthopedic disorders
3.4.1.3. Rise in physical health consciousness
3.4.1.4. Improvement of healthcare infrastructure in developing countries

3.4.2. Restraint

3.4.2.1. High cost of custom orthotic devices

3.4.3. Opportunity

3.4.3.1. Lucrative opportunities in emerging economies

3.4.4. Impact analysis

3.5. PORTERS FIVE FORCES ANALYSIS

3.5.1. Bargaining power of buyers
3.5.2. Bargaining power of suppliers
3.5.3. Threat of substitutes
3.5.4. Threat of new entrants
3.5.5. Competitive rivalry

3.6. GOVERNMENT REGULATIONS

3.6.1. U.S. FDA’s premarket clearance and approval requirements
3.6.2. European Union
3.6.3. Japan

CHAPTER 4 ORTHOPEDIC ORTHOTICS MARKET, BY ANATOMICAL REGION

4.1. OVERVIEW

4.1.1. Market size and forecast

4.2. UPPER LIMB ORTHOTIC DEVICES

4.2.1. Key market trends
4.2.2. Growth factors and opportunities
4.2.3. Market size and forecast, by region
4.2.4. Market analysis, by country
4.2.5. Market size and forecast, by type

4.2.5.1. Shoulder orthotic devices

4.2.5.1.1. Market size and forecast

4.2.5.2. Hand & wrist orthotic devices

4.2.5.2.1. Market size and forecast

4.2.5.3. Elbow orthotic devices

4.2.5.3.1. Market size and forecast

4.2.5.4. Other upper limb orthotic devices

4.2.5.4.1. Market size and forecast

4.3. LOWER LIMB ORTHOTIC DEVICES

4.3.1. Key market trends
4.3.2. Growth factors and opportunities
4.3.3. Market size and forecast, by region
4.3.4. Market analysis, by country
4.3.5. Market size and forecast, by type

4.3.5.1. Foot & ankle orthotic devices

4.3.5.1.1. Market size and forecast

4.3.5.2. Knee orthotic devices

4.3.5.2.1. Market size and forecast

4.3.5.3. Hip orthotic devices

4.3.5.3.1. Market size and forecast

4.3.5.4. Other lower limb orthotic devices

4.3.5.4.1. Market size and forecast

4.4. SPINAL ORTHOTIC DEVICES

4.4.1. Key market trends
4.4.2. Growth factor and opportunities
4.4.3. Market size and forecast, by type
4.4.4. Market size and forecast, by region
4.4.5. Market analysis, by country

4.4.5.1. Cervical orthotic devices

4.4.5.1.1. Market size and forecast

4.4.5.2. Lumbosacral orthotic devices

4.4.5.2.1. Market size and forecast

4.4.5.3. Thoracic-lumbo-sacral orthotic devices

4.4.5.3.1. Market size and forecast

4.4.5.4. Cervical-thoracic-lumbar-sacral orthotic devices

4.4.5.4.1. Market size and forecast

4.4.5.5. Other spinal orthotic devices

4.4.5.5.1. Market size and forecast

CHAPTER 5 ORTHOPEDIC ORTHOTICS MARKET, BY POSTURE

5.1. OVERVIEW

5.1.1. Market size and forecast

5.2. STATIC ORTHOTIC DEVICES

5.2.1. Market size and forecast, by region
5.2.2. Market analysis, by country

5.3. DYNAMIC ORTHOTIC DEVICES

5.3.1. Market size and forecast, by region
5.3.2. Market analysis, by country

5.4. OTHER ORTHOTIC DEVICES

5.4.1. Market size and forecast, by region
5.4.2. Market analysis, by country

CHAPTER 6 ORTHOPEDIC ORTHOTICS MARKET, BY MANUFACTURING

6.1. OVERVIEW

6.1.1. Market size and forecast

6.2. PREFABRICATED ORTHOTIC DEVICES

6.2.1. Market size and forecast, by region
6.2.2. Market analysis, by country

6.3. CUSTOM FITTED

6.3.1. Market size and forecast, by region
6.3.2. Market analysis, by country

6.4. CUSTOM FABRICATED

6.4.1. Market size and forecast, by region
6.4.2. Market analysis, by country

CHAPTER 7 ORTHOPEDIC ORTHOTICS MARKET, BY REGION

7.1. OVERVIEW

7.1.1. Market size and forecast

7.2. NORTH AMERICA

7.2.1. Key market trends
7.2.2. Growth factors and opportunities
7.2.3. Market size and forecast, by anatomical region
7.2.4. Market size and forecast, by posture
7.2.5. Market size and forecast, by manufacturing
7.2.6. Market size and forecast, by country

7.2.6.1. U.S. orthopedic orthotics market

7.2.6.1.1. Market size and forecast, by anatomical region
7.2.6.1.2. Market size and forecast, by posture
7.2.6.1.3. Market size and forecast, by manufacturing

7.2.6.2. Canada orthopedic orthotics market

7.2.6.2.1. Market size and forecast, by anatomical region
7.2.6.2.2. Market size and forecast, by posture
7.2.6.2.3. Market size and forecast, by manufacturing

7.2.6.3. Mexico orthopedic orthotics market

7.2.6.3.1. Market size and forecast, by anatomical region
7.2.6.3.2. Market size and forecast, by posture
7.2.6.3.3. Market size and forecast, by manufacturing

7.3. EUROPE

7.3.1. Key market trends
7.3.2. Growth factors and opportunities
7.3.3. Market size and forecast, by anatomical region
7.3.4. Market size and forecast, by posture
7.3.5. Market size and forecast, by manufacturing
7.3.6. Market size and forecast, by country

7.3.6.1. Germany orthopedic orthotics market

7.3.6.1.1. Market size and forecast, by anatomical region
7.3.6.1.2. Market size and forecast, by posture
7.3.6.1.3. Market size and forecast, by manufacturing

7.3.6.2. France orthopedic orthotics market

7.3.6.2.1. Market size and forecast, by anatomical region
7.3.6.2.2. Market size and forecast, by posture
7.3.6.2.3. Market size and forecast, by manufacturing

7.3.6.3. UK orthopedic orthotics market

7.3.6.3.1. Market size and forecast, by anatomical region
7.3.6.3.2. Market size and forecast, by posture
7.3.6.3.3. Market size and forecast, by manufacturing

7.3.6.4. Italy orthopedic orthotics market

7.3.6.4.1. Market size and forecast, by anatomical region
7.3.6.4.2. Market size and forecast, by posture
7.3.6.4.3. Market size and forecast, by manufacturing

7.3.6.5. Spain orthopedic orthotics market

7.3.6.5.1. Market size and forecast, by anatomical region
7.3.6.5.2. Market size and forecast, by posture
7.3.6.5.3. Market size and forecast, by manufacturing

7.3.6.6. Rest of Europe orthopedic orthotics market

7.3.6.6.1. Market size and forecast, by anatomical region
7.3.6.6.2. Market size and forecast, by posture
7.3.6.6.3. Market size and forecast, by manufacturing

7.4. ASIA-PACIFIC

7.4.1. Key market trends
7.4.2. Growth factors and opportunities
7.4.3. Market size and forecast, by anatomical region
7.4.4. Market size and forecast, by posture
7.4.5. Market size and forecast, by manufacturing
7.4.6. Market size and forecast, by country

7.4.6.1. Japan orthopedic orthotics market

7.4.6.1.1. Market size and forecast, by anatomical region
7.4.6.1.2. Market size and forecast, by posture
7.4.6.1.3. Market size and forecast, by manufacturing

7.4.6.2. China orthopedic orthotics market

7.4.6.2.1. Market size and forecast, by anatomical region
7.4.6.2.2. Market size and forecast, by posture
7.4.6.2.3. Market size and forecast, by manufacturing

7.4.6.3. India orthopedic orthotics market

7.4.6.3.1. Market size and forecast, by anatomical region
7.4.6.3.2. Market size and forecast, by posture
7.4.6.3.3. Market size and forecast, by manufacturing

7.4.6.4. Australia orthopedic orthotics market

7.4.6.4.1. Market size and forecast, by anatomical region
7.4.6.4.2. Market size and forecast, by posture
7.4.6.4.3. Market size and forecast, by manufacturing

7.4.6.5. Rest of Asia-Pacific orthopedic orthotics market

7.4.6.5.1. Market size and forecast, by anatomical region
7.4.6.5.2. Market size and forecast, by posture
7.4.6.5.3. Market size and forecast, by manufacturing

7.5. LAMEA

7.5.1. Key market trends
7.5.2. Growth factors and opportunities
7.5.3. Market size and forecast, by anatomical region
7.5.4. Market size and forecast, by posture
7.5.5. Market size and forecast, by manufacturing
7.5.6. Market size and forecast, by country

7.5.6.1. Brazil orthopedic orthotics market

7.5.6.1.1. Market size and forecast, by anatomical region
7.5.6.1.2. Market size and forecast, by posture
7.5.6.1.3. Market size and forecast, by manufacturing

7.5.6.2. Saudi Arabia orthopedic orthotics market

7.5.6.2.1. Market size and forecast, by anatomical region
7.5.6.2.2. Market size and forecast, by posture
7.5.6.2.3. Market size and forecast, by manufacturing

7.5.6.3. South Africa orthopedic orthotics market

7.5.6.3.1. Market size and forecast, by anatomical region
7.5.6.3.2. Market size and forecast, by posture
7.5.6.3.3. Market size and forecast, by manufacturing

7.5.6.4. Rest of LAMEA orthopedic orthotics market

7.5.6.4.1. Market size and forecast, by anatomical region
7.5.6.4.2. Market size and forecast, by posture
7.5.6.4.3. Market size and forecast, by manufacturing

CHAPTER 8 COMPANY PROFILE

8.1. BAUERFEIND AG

8.1.1. Company overview
8.1.2. Company snapshot
8.1.3. Operating business segments
8.1.4. Product portfolio
8.1.5. Key strategic moves and developments

8.2. BREG, INC.

8.2.1. Company overview
8.2.2. Company snapshot
8.2.3. Operating business segments
8.2.4. Product portfolio
8.2.5. Key strategic moves and developments

8.3. SVENSKA CELLULOSA AKTIEBOLAGET (BSN MEDICAL LUXEMBOURG GROUP HOLDING S.A R.L.)

8.3.1. Company overview
8.3.2. Company snapshot
8.3.3. Operating business segments
8.3.4. Product portfolio
8.3.5. Business performance
8.3.6. Key strategic moves and developments

8.4. DEROYAL INDUSTRIES, INC.

8.4.1. Company overview
8.4.2. Company snapshot
8.4.3. Operating business segments
8.4.4. Product portfolio

8.5. JO, LLC

8.5.1. Company overview
8.5.2. Company snapshot
8.5.3. Operating business segments
8.5.4. Product portfolio
8.5.5. Business performance
8.5.6. Key strategic moves and developments

8.6. FILLAUER LLC

8.6.1. Company overview
8.6.2. Company snapshot
8.6.3. Operating business segments
8.6.4. Product portfolio

8.7. HANGER, INC.

8.7.1. Company overview
8.7.2. Company snapshot
8.7.3. Operating business segments
8.7.4. Product portfolio
8.7.5. Business performance

8.8. ÖSSUR HF.

8.8.1. Company overview
8.8.2. Company snapshot
8.8.3. Operating business segments
8.8.4. Product portfolio
8.8.5. Business performance
8.8.6. Key strategic moves and developments

8.9. OTTO BOCK HEALTHCARE GMBH

8.9.1. Company overview
8.9.2. Company snapshot
8.9.3. Operating business segments
8.9.4. Product portfolio

8.10. TRULIFE

8.10.1. Company overview
8.10.2. Company snapshot
8.10.3. Operating business segments
8.10.4. Product portfolio

 LIST OF TABLES

TABLE 1. FDA CLASSIFICATION OF MEDICAL DEVICES
TABLE 2. GLOBAL ORTHOPEDIC ORTHOTICS MARKET, BY ANATOMICAL REGION, 2016-2023 ($MILLION)
TABLE 3. UPPER LIMB ORTHOTIC DEVICES MARKET, BY REGION, 2016-2023 ($MILLION)
TABLE 4. UPPER LIMB ORTHOTIC DEVICES MARKET, BY TYPE, 2016-2023 ($MILLION)
TABLE 5. LOWER LIMB ORTHOTIC DEVICES MARKET, BY REGION, 2016-2023 ($MILLION)
TABLE 6. LOWER LIMB ORTHOTIC DEVICES MARKET, BY TYPE, 2016-2023 ($MILLION)
TABLE 7. SPINAL ORTHOTIC DEVICES MARKET, BY TYPE, 2016-2023 ($MILLION)
TABLE 8. SPINAL ORTHOTIC DEVICES MARKET, BY REGION, 2016-2023 ($MILLION)
TABLE 9. GLOBAL ORTHOPEDIC ORTHOTICS MARKET, BY POSTURE, 2016-2023 ($MILLION)
TABLE 10. STATIC ORTHOTIC DEVICES MARKET, BY REGION, 2016-2023 ($MILLION)
TABLE 11. DYNAMIC ORTHOTIC DEVICES MARKET, BY REGION, 2016-2023 ($MILLION)
TABLE 12. OTHER ORTHOTIC DEVICES MARKET, BY REGION, 2016-2023 ($MILLION)
TABLE 13. GLOBAL ORTHOPEDIC ORTHOTICS MARKET, BY MANUFACTURING, 2016-2023 ($MILLION)
TABLE 14. PREFABRICATED ORTHOTIC DEVICES MARKET, BY REGION, 2016-2023 ($MILLION)
TABLE 15. CUSTOM-FITTED ORTHOTIC DEVICES MARKET, BY REGION, 2016-2023 ($MILLION)
TABLE 16. CUSTOM-FABRICATED ORTHOTIC DEVICES MARKET, BY REGION, 2016-2023 ($MILLION)
TABLE 17. ORTHOPEDIC ORTHOTICS MARKET, BY REGION, 2016-2023 ($MILLION)
TABLE 18. NORTH AMERICA ORTHOPEDIC ORTHOTICS MARKET, BY ANATOMICAL REGION, 2016-2023 ($MILLION)
TABLE 19. NORTH AMERICA ORTHOPEDIC ORTHOTICS MARKET, BY POSTURE, 2016-2023 ($MILLION)
TABLE 20. NORTH AMERICA ORTHOPEDIC ORTHOTICS MARKET, BY MANUFACTURING, 2016-2023 ($MILLION)
TABLE 21. NORTH AMERICA ORTHOPEDIC ORTHOTICS MARKET, BY COUNTRY, 2016-2023 ($MILLION)
TABLE 22. U.S. ORTHOPEDIC ORTHOTICS MARKET, BY ANATOMICAL REGION, 2016-2023 ($MILLION)
TABLE 23. U.S. ORTHOPEDIC ORTHOTICS MARKET, BY POSTURE, 2016-2023 ($MILLION)
TABLE 24. U.S. ORTHOPEDIC ORTHOTICS MARKET, BY MANUFACTURING, 2016-2023 ($MILLION)
TABLE 25. CANADA ORTHOPEDIC ORTHOTICS MARKET, BY ANATOMICAL REGION, 2016-2023 ($MILLION)
TABLE 26. CANADA ORTHOPEDIC ORTHOTICS MARKET, BY POSTURE, 2016-2023 ($MILLION)
TABLE 27. CANADA ORTHOPEDIC ORTHOTICS MARKET, BY MANUFACTURING, 2016-2023 ($MILLION)
TABLE 28. MEXICO ORTHOPEDIC ORTHOTICS MARKET, BY ANATOMICAL REGION, 2016-2023 ($MILLION)
TABLE 29. MEXICO ORTHOPEDIC ORTHOTICS MARKET, BY POSTURE, 2016-2023 ($MILLION)
TABLE 30. MEXICO ORTHOPEDIC ORTHOTICS MARKET, BY MANUFACTURING, 2016-2023 ($MILLION)
TABLE 31. ANNUAL RHEUMATOID ARTHRITIS CASES IN THE UK
TABLE 32. EUROPE ORTHOPEDIC ORTHOTICS MARKET, BY ANATOMICAL REGION, 2016-2023 ($MILLION)
TABLE 33. EUROPE ORTHOPEDIC ORTHOTICS MARKET, BY POSTURE, 2016-2023 ($MILLION)
TABLE 34. EUROPE ORTHOPEDIC ORTHOTICS MARKET, BY MANUFACTURING, 2016-2023 ($MILLION)
TABLE 35. EUROPE ORTHOPEDIC ORTHOTICS MARKET, BY COUNTRY, 2016-2023 ($MILLION)
TABLE 36. GERMANY ORTHOPEDIC ORTHOTICS MARKET, BY ANATOMICAL REGION, 2016-2023 ($MILLION)
TABLE 37. GERMANY ORTHOPEDIC ORTHOTICS MARKET, BY POSTURE, 2016-2023 ($MILLION)
TABLE 38. GERMANY ORTHOPEDIC ORTHOTICS MARKET, BY MANUFACTURING, 2016-2023 ($MILLION)
TABLE 39. FRANCE ORTHOPEDIC ORTHOTICS MARKET, BY ANATOMICAL REGION, 2016-2023 ($MILLION)
TABLE 40. FRANCE ORTHOPEDIC ORTHOTICS MARKET, BY POSTURE, 2016-2023 ($MILLION)
TABLE 41. FRANCE ORTHOPEDIC ORTHOTICS MARKET, BY MANUFACTURING, 2016-2023 ($MILLION)
TABLE 42. UK ORTHOPEDIC ORTHOTICS MARKET, BY ANATOMICAL REGION, 2016-2023 ($MILLION)
TABLE 43. UK ORTHOPEDIC ORTHOTICS MARKET, BY POSTURE, 2016-2023 ($MILLION)
TABLE 44. UK ORTHOPEDIC ORTHOTICS MARKET, BY MANUFACTURING, 2016-2023 ($MILLION)
TABLE 45. ITALY ORTHOPEDIC ORTHOTICS MARKET, BY ANATOMICAL REGION, 2016-2023 ($MILLION)
TABLE 46. ITALY ORTHOPEDIC ORTHOTICS MARKET, BY POSTURE, 2016-2023 ($MILLION)
TABLE 47. ITALY ORTHOPEDIC ORTHOTICS MARKET, BY MANUFACTURING, 2016-2023 ($MILLION)
TABLE 48. SPAIN ORTHOPEDIC ORTHOTICS MARKET, BY ANATOMICAL REGION, 2016-2023 ($MILLION)
TABLE 49. SPAIN ORTHOPEDIC ORTHOTICS MARKET, BY POSTURE, 2016-2023 ($MILLION)
TABLE 50. SPAIN ORTHOPEDIC ORTHOTICS MARKET, BY MANUFACTURING, 2016-2023 ($MILLION)
TABLE 51. REST OF EUROPE ORTHOPEDIC ORTHOTICS MARKET, BY ANATOMICAL REGION, 2016-2023 ($MILLION)
TABLE 52. REST OF EUROPE ORTHOPEDIC ORTHOTICS MARKET, BY POSTURE, 2016-2023 ($MILLION)
TABLE 53. REST OF EUROPE ORTHOPEDIC ORTHOTICS MARKET, BY MANUFACTURING, 2016-2023 ($MILLION)
TABLE 54. ASIA-PACIFIC ORTHOPEDIC ORTHOTICS MARKET, BY ANATOMICAL REGION, 2016-2023 ($MILLION)
TABLE 55. ASIA-PACIFIC ORTHOPEDIC ORTHOTICS MARKET, BY POSTURE, 2016-2023 ($MILLION)
TABLE 56. ASIA-PACIFIC ORTHOPEDIC ORTHOTICS MARKET, BY MANUFACTURING, 2016-2023 ($MILLION)
TABLE 57. ASIA-PACIFIC ORTHOPEDIC ORTHOTICS MARKET, BY COUNTRY, 2016-2023 ($MILLION)
TABLE 58. JAPAN ORTHOPEDIC ORTHOTICS MARKET, BY ANATOMICAL REGION, 2016-2023 ($MILLION)
TABLE 59. JAPAN ORTHOPEDIC ORTHOTICS MARKET, BY POSTURE, 2016-2023 ($MILLION)
TABLE 60. JAPAN ORTHOPEDIC ORTHOTICS MARKET, BY MANUFACTURING, 2016-2023 ($MILLION)
TABLE 61. CHINA ORTHOPEDIC ORTHOTICS MARKET, BY ANATOMICAL REGION, 2016-2023 ($MILLION)
TABLE 62. CHINA ORTHOPEDIC ORTHOTICS MARKET, BY POSTURE, 2016-2023 ($MILLION)
TABLE 63. CHINA ORTHOPEDIC ORTHOTICS MARKET, BY MANUFACTURING, 2016-2023 ($MILLION)
TABLE 64. INDIA ORTHOPEDIC ORTHOTICS MARKET, BY ANATOMICAL REGION, 2016-2023 ($MILLION)
TABLE 65. INDIA ORTHOPEDIC ORTHOTICS MARKET, BY POSTURE, 2016-2023 ($MILLION)
TABLE 66. INDIA ORTHOPEDIC ORTHOTICS MARKET, BY MANUFACTURING, 2016-2023 ($MILLION)
TABLE 67. AUSTRALIA ORTHOPEDIC ORTHOTICS MARKET, BY ANATOMICAL REGION, 2016-2023 ($MILLION)
TABLE 68. AUSTRALIA ORTHOPEDIC ORTHOTICS MARKET, BY POSTURE, 2016-2023 ($MILLION)
TABLE 69. AUSTRALIA ORTHOPEDIC ORTHOTICS MARKET, BY MANUFACTURING, 2016-2023 ($MILLION)
TABLE 70. REST OF ASIA-PACIFIC ORTHOPEDIC ORTHOTICS MARKET, BY ANATOMICAL REGION, 2016-2023 ($MILLION)
TABLE 71. REST OF ASIA-PACIFIC ORTHOPEDIC ORTHOTICS MARKET, BY POSTURE, 2016-2023 ($MILLION)
TABLE 72. REST OF ASIA-PACIFIC ORTHOPEDIC ORTHOTICS MARKET, BY MANUFACTURING, 2016-2023 ($MILLION)
TABLE 73. LAMEA ORTHOPEDIC ORTHOTICS MARKET, BY ANATOMICAL REGION, 2016-2023 ($MILLION)
TABLE 74. LAMEA ORTHOPEDIC ORTHOTICS MARKET, BY POSTURE, 2016-2023 ($MILLION)
TABLE 75. LAMEA ORTHOPEDIC ORTHOTICS MARKET, BY MANUFACTURING, 2016-2023 ($MILLION)
TABLE 76. LAMEA ORTHOPEDIC ORTHOTICS MARKET, BY COUNTRY, 2016-2023 ($MILLION)
TABLE 77. BRAZIL ORTHOPEDIC ORTHOTICS MARKET, BY ANATOMICAL REGION, 2016-2023 ($MILLION)
TABLE 78. BRAZIL ORTHOPEDIC ORTHOTICS MARKET, BY POSTURE, 2016-2023 ($MILLION)
TABLE 79. BRAZIL ORTHOPEDIC ORTHOTICS MARKET, BY MANUFACTURING, 2016-2023 ($MILLION)
TABLE 80. SAUDI ARABIA ORTHOPEDIC ORTHOTICS MARKET, BY ANATOMICAL REGION, 2016-2023 ($MILLION)
TABLE 81. SAUDI ARABIA ORTHOPEDIC ORTHOTICS MARKET, BY POSTURE, 2016-2023 ($MILLION)
TABLE 82. SAUDI ARABIA ORTHOPEDIC ORTHOTICS MARKET, BY MANUFACTURING, 2016-2023 ($MILLION)
TABLE 83. SOUTH AFRICA ORTHOPEDIC ORTHOTICS MARKET, BY ANATOMICAL REGION, 2016-2023 ($MILLION)
TABLE 84. SOUTH AFRICA ORTHOPEDIC ORTHOTICS MARKET, BY POSTURE, 2016-2023 ($MILLION)
TABLE 85. SOUTH AFRICA ORTHOPEDIC ORTHOTICS MARKET, BY MANUFACTURING, 2016-2023 ($MILLION)
TABLE 86. REST OF LAMEA ORTHOPEDIC ORTHOTICS MARKET, BY ANATOMICAL REGION, 2016-2023 ($MILLION)
TABLE 87. REST OF LAMEA ORTHOPEDIC ORTHOTICS MARKET, BY POSTURE, 2016-2023 ($MILLION)
TABLE 88. REST OF LAMEA ORTHOPEDIC ORTHOTICS MARKET, BY MANUFACTURING, 2016-2023 ($MILLION)
TABLE 89. BAUERFEIND AG: COMPANY SNAPSHOT
TABLE 90. BAUERFEIND AG: PRODUCT CATEGORIES
TABLE 91. BAUERFEIND AG: PRODUCT PORTFOLIO
TABLE 92. BREG, INC.: COMPANY SNAPSHOT
TABLE 93. BREG, INC.: PRODUCT CATEGORIES
TABLE 94. BREG, INC.: PRODUCT PORTFOLIO
TABLE 95. SVENSKA CELLULOSA AKTIEBOLAGET: COMPANY SNAPSHOT
TABLE 96. SVENSKA CELLULOSA AKTIEBOLAGET: OPERATING SEGMENTS
TABLE 97. BSN MEDICAL LUXEMBOURG GROUP HOLDING S.A R.L: PRODUCT PORTFOLIO
TABLE 98. DEROYAL INDUSTRIES, INC.: COMPANY SNAPSHOT
TABLE 99. DEROYAL INDUSTRIES, INC.: PRODUCT CATEGORIES
TABLE 100. DEROYAL INDUSTRIES, INC.: PRODUCT PORTFOLIO
TABLE 101. DJO, LLC: COMPANY SNAPSHOT
TABLE 102. DJO, LLC: OPERATING SEGMENTS
TABLE 103. DJO, LLC: PRODUCT PORTFOLIO
TABLE 104. FILLAUER LLC: COMPANY SNAPSHOT
TABLE 105. FILLAUER LLC: OPERATING SEGMENTS
TABLE 106. FILLAUER LLC: PRODUCT PORTFOLIO
TABLE 107. HANGER, INC.: COMPANY SNAPSHOT
TABLE 108. HANGER, INC.: OPERATING SEGMENTS
TABLE 109. HANGER, INC.: PRODUCT PORTFOLIO
TABLE 110. ÖSSUR HF.: COMPANY SNAPSHOT
TABLE 111. ÖSSUR HF.: OPERATING SEGMENTS
TABLE 112. ÖSSUR HF.: PRODUCT PORTFOLIO
TABLE 113. OTTO BOCK HEALTHCARE GMBH: COMPANY SNAPSHOT
TABLE 114. OTTO BOCK HEALTHCARE GMBH: OPERATING SEGMENTS
TABLE 115. OTTO BOCK HEALTHCARE GMBH: PRODUCT PORTFOLIO
TABLE 116. TRULIFE: COMPANY SNAPSHOT
TABLE 117. TRULIFE: OPERATING SEGMENTS
TABLE 118. TRULIFE: PRODUCT PORTFOLIO

 LIST OF FIGURES

FIGURE 1. ORTHOPEDIC ORTHOTICS MARKET SEGMENTATION
FIGURE 2. TOP INVESTMENT POCKETS
FIGURE 3. TOP WINNING STRATEGIES, BY YEAR, 2015-2018*
FIGURE 4. TOP WINNING STRATEGIES, BY DEVELOPMENT, 2015-2018*(%)
FIGURE 5. TOP WINNING STRATEGIES, BY COMPANY, 2015-2018*
FIGURE 6. MARKET SHARE ANALYSIS, 2016
FIGURE 7. IMPACT ANALYSIS
FIGURE 8. HIGH BARGAINING POWER OF BUYERS
FIGURE 9. LOW BARGAINING POWER OF SUPPLIERS
FIGURE 10. LOW THREAT OF SUBSTITUTES
FIGURE 11. HIGH THREAT OF NEW ENTRANTS
FIGURE 12. HIGH COMPETITIVE RIVALRY
FIGURE 13. COMPARATIVE ANALYSIS OF UPPER LIMB ORTHOTIC DEVICES MARKET REVENUE, BY COUNTRY, 2016 & 2023 (%)
FIGURE 14. SHOULDER ORTHOTIC DEVICES MARKET, 2016-2023 ($MILLION)
FIGURE 15. HAND & WRIST ORTHOTIC DEVICES MARKET, 2016-2023 ($MILLION)
FIGURE 16. ELBOW ORTHOTIC DEVICES MARKET, 2016-2023 ($MILLION)
FIGURE 17. OTHER UPPER LIMB ORTHOTIC DEVICES MARKET, 2016-2023 ($MILLION)
FIGURE 18. COMPARATIVE ANALYSIS OF LOWER LIMB ORTHOTIC DEVICES MARKET REVENUE, BY COUNTRY, 2016 & 2023 (%)
FIGURE 19. FOOT & ANKLE ORTHOTIC DEVICES MARKET, 2016-2023 ($MILLION)
FIGURE 20. KNEE ORTHOTIC DEVICES MARKET, 2016-2023 ($MILLION)
FIGURE 21. HIP ORTHOTIC DEVICES MARKET, 2016-2023 ($MILLION)
FIGURE 22. OTHER LOWER LIMB ORTHOTIC DEVICES MARKET, 2016-2023 ($MILLION)
FIGURE 23. COMPARATIVE ANALYSIS OF SPINAL ORTHOTIC DEVICES MARKET REVENUE, BY COUNTRY, 2016 & 2023 (%)
FIGURE 24. CERVICAL ORTHOTIC DEVICES MARKET, 2016-2023 ($MILLION)
FIGURE 25. LUMBOSACRAL ORTHOTIC DEVICES MARKET, 2016-2023 ($MILLION)
FIGURE 26. THORACIC-LUMBO-SACRAL ORTHOTIC DEVICES MARKET, 2016-2023 ($MILLION)
FIGURE 27. CERVICAL-THORACIC-LUMBAR-SACRAL ORTHOTIC DEVICES MARKET, 2016-2023 ($MILLION)
FIGURE 28. OTHER SPINAL ORTHOTIC DEVICES MARKET, 2016-2023 ($MILLION)
FIGURE 29. COMPARATIVE ANALYSIS OF STATIC ORTHOTIC DEVICES MARKET REVENUE, BY COUNTRY, 2016 & 2023 (%)
FIGURE 30. COMPARATIVE ANALYSIS OF DYNAMIC ORTHOTIC DEVICES MARKET REVENUE, BY COUNTRY, 2016 & 2023 (%)
FIGURE 31. COMPARATIVE ANALYSIS OF OTHER ORTHOTIC DEVICES MARKET REVENUE, BY COUNTRY, 2016 & 2023 (%)
FIGURE 32. COMPARATIVE ANALYSIS OF PREFABRICATED ORTHOTIC DEVICES MARKET REVENUE, BY COUNTRY, 2016 & 2023 (%)
FIGURE 33. COMPARATIVE ANALYSIS OF CUSTOM-FITTED ORTHOTIC DEVICES MARKET REVENUE, BY COUNTRY, 2016 & 2023 (%)
FIGURE 34. COMPARATIVE ANALYSIS OF CUSTOM-FABRICATED ORTHOTIC DEVICES MARKET REVENUE, BY COUNTRY, 2016 & 2023 (%)
FIGURE 35. NUMBER OF ADULTS WITH DOCTOR-DIAGNOSED ARTHRITIS IN THE U.S., 2004 AND 2045 (IN MILLION)
FIGURE 36. POPULATION STRUCTURE BY MAJOR AGE GROUPS, EU-28
FIGURE 37. SVENSKA CELLULOSA AKTIEBOLAGET: REVENUE, 2014-2016 ($MILLION)
FIGURE 38. SVENSKA CELLULOSA AKTIEBOLAGET: REVENUE SHARE BY SEGMENT, 2016 (%)
FIGURE 39. SVENSKA CELLULOSA AKTIEBOLAGET: REVENUE SHARE BY GEOGRAPHY, 2016 (%)
FIGURE 40. DJO, LLC: REVENUE, 2014-2016 ($MILLION)
FIGURE 41. DJO, LLC: REVENUE SHARE BY SEGMENT, 2016 (%)
FIGURE 42. DJO, LLC: REVENUE SHARE BY GEOGRAPHY, 2016 (%)
FIGURE 43. HANGER, INC.: REVENUE, 2014-2016 ($MILLION)
FIGURE 44. HANGER, INC.: REVENUE SHARE BY SEGMENT, 2016 (%)
FIGURE 45. ÖSSUR HF.: REVENUE, 2014-2016 ($MILLION)
FIGURE 46. ÖSSUR HF.: REVENUE SHARE BY SEGMENT, 2016 (%)
FIGURE 47. ÖSSUR HF.: REVENUE SHARE BY GEOGRAPHY, 2016 (%)


Orthopedic orthotic devices are braces, splints or externally used devices which is used by patients suffering primarily from orthopedic disorders. These devices can also be used in recovery of patients suffering congenital conditions, trauma injury, postoperative, osteoarthritis care, and other conditions.

Increase in incidence of rise in geriatric population, which is at a higher risk of orthopedic diseases are primarily attributed to increase the demand for endoscopy. Moreover, rise in adoption of the devices owing to increasing incidents of accidents and sports related injuries in turn stimulates the market growth. However, the high cost of the customized orthopedic orthotics are expected to restrain the market growth.

Asia-Pacific offers lucrative growth opportunity for the market due to increase in healthcare expenditure, growth in geriatric population, and rise in incidence of population suffering from arthritis. Thus, the emerging economies such as China and India possess high market potential.

PURCHASE OPTIONS

Call or Email us

U.S.-Canada Toll-free: +1-800-792-5285
Int'l : +1-503-894-6022
Europe : +44-845-528-1300
Email : help@alliedmarketresearch.com

Looking for Customization?

 Customization Request

Have a Question?

 Speak with Analyst

Any Confusion?

 Inquire Before Buying

Have a glance of the Report

  Request Sample

Purchase Full Report of
Orthopedic Orthotics Market

Start reading instantly.
This Report and over 67,404+ more Reports, Available with Avenue Library. T&C*.

  • Online Only
  • $3,456
  • Online cloud access only
  • Restricted print, copy, paste & download
  • Read only
  • Free industry update
    (Within 180 days)
  • Free report update in next update cycle
    (Jan 2019 - Jan 2020)
  • Data Pack
  • $3,840
  • Restricted to one authorized user
  • One print only
  • Available in
    Excel
  • Free industry update
    (Within 180 days)
  •   Free report update in next update cycle
    (Jan 2019 - Jan 2020)
  • Single User
  • $5,769
  • Restricted to one authorized user
  • One print only
  • Available in
    PDF
  • Free industry update
    (Within 180 days)
  •   Free report update in next update cycle
    (Jan 2019 - Jan 2020)
  • Five Users
  • $6,450
  • Limited to five authorized users
  • Print upto five copies
  • Available in
    PDF
  • Free industry update
    (Within 180 days)
  •   Free report update in next update cycle
    (Jan 2019 - Jan 2020)
  • Enterprise
    License/PDF

  • $10,995
  • Unlimited
    within
    company/enterprise
  • Available in Excel & PDF
  • Free industry update
    (Within 180 days)
  •   Free report update in next update cycle
    (Jan 2019 - Jan 2020)
  • Library
    Membership

  • $999 $ 1,175
    Per User/ Per month/ Billed annually
  • Published Content
    E-access
  • Company Profiles
    E-access
  • Newly Added Content Access
  • 10 PDF
    Downloads
  • 5 Excel Data
    Pack Downloads
  • 250 Company Profiles PDF Downloads
  • Buy Now

*Taxes/Fees, if applicable will be added during checkout. All prices in USD

RELATED REPORTS
 

Why Allied Market Research?


Infallible Methodology

To ensure high-level data integrity, accurate analysis, and impeccable forecasts

Analyst Support

For complete satisfaction

Customization

On-demand customization of scope of the report to exactly meet your needs

TARGETED MARKET VIEW

Targeted market view to provide pertinent information and save time of readers

Get fresh content delivered

Get insights on topics that are crucial for your business. Stay abreast of your interest areas.

Get Industry Data Alerts

Why Allied Market Research?

Infallible Methodology

To ensure high-level data integrity, accurate analysis, and impeccable forecasts

Analyst Support

For complete satisfaction

Customization

On-demand customization of scope of the report to exactly meet your needs

TARGETED MARKET VIEW

Targeted market view to provide pertinent information and save time of readers