0
2023
Osteosynthesis Devices Market

Osteosynthesis Devices Market

by Device Type (Internal Fixation Devices, External Fixation Devices), by Fracture Type (Hip Fracture, Knee Fracture, Spine Fracture, Shoulder Fracture, Foot and Ankle Fracture, Facial bones Fracture, Others), by End User (Hospitals, Orthopaedic Clinics, Ambulatory surgical Centers): Global Opportunity Analysis and Industry Forecast, 2021-2031

Report Code: A03370
Feb 2023 | Pages: 256
Tables: 136
Charts: 69
  • Formats*:

  • pdf

    Single User License, Five User
    License & Enterprise User License

  • xls

    Data Pack Excel License

  • ppt

    It comes with the additional cost
    of $2500.00 contact sales.


Osteosynthesis Devices Market Research, 2031

The global Osteosynthesis Devices Market Size was valued at $9,061.20 million in 2021 and is estimated to reach $14,214.92 million by 2031, growing at a CAGR of 4.6% from 2022 to 2031. Osteosynthesis devices are medical implants used to stabilize and support broken or fractured bones during the healing process. These devices are designed to hold bone fragments together in the correct position to allow new bone tissue to grow and fuse the fragments back into a single, solid bone. Osteosynthesis devices such as screws & plates, wires & pins, intramedullary rods & nails, and spinal fixation devices are used for joining the ends of a broken bone after a fracture, an osteotomy, or a non-union from a previous fracture.
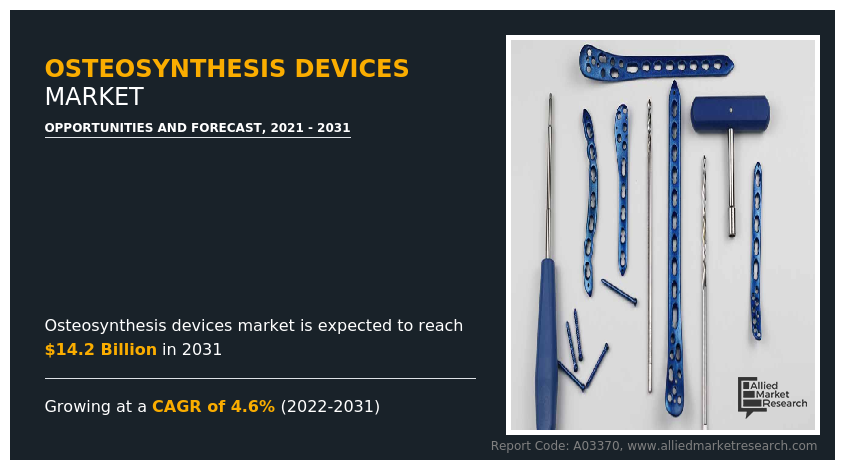
The COVID-19 and the associated restrictions and lockdowns affected the overall sales of osteosynthesis devices, owing to the cancellation of appointments with doctors, a huge number of medical colleges and hospitals across the globe were restructured to increase hospital capacity for patients diagnosed with COVID-19 and the shortage of supply chain. Therefore, the COVID-19 outbreak had a negative impact on the osteosynthesis devices market.

Osteosynthesis Devices Market

Historical overview 

The Osteosynthesis Devices Market Size was analyzed qualitatively and quantitatively from 2018 to 2020. Most of the growth during this period was derived from the Asia-Pacific, owing to the rise in the prevalence of sports-related injuries and road accidents. In addition, rise in disposable incomes, as well as the well-established presence of key pharmaceutical device manufacturers in the region.  

Market dynamics

The key factor that drives the growth of the market is a rise in the number of sports injuries which has led to increasing in the demand for osteosynthesis devices for the treatment of various fractures across the world. For instance, according to a John Hopkins Medicine article, 30 million individuals participate in organized sports, resulting in more than 3.5 million sports injuries annually in the U.S.

Moreover, the rise in the incidence of road accidents further led to fractures which further boost the growth of market. For instance, according to the data of the World Health Organization, in June 2021, about 1.3 million people die every year due to road traffic accidents and about 20 to 50 million people suffer from non-fatal injuries, with many incurring disabilities owing to the injury.

In addition, osteoporosis is a disease in which bones become very weak and are more likely to break. Therefore, the rise in the prevalence of orthopedic disorders such as arthritis and osteoporosis drives the growth of the osteosynthesis devices market. For instance, according to the American Academy of Orthopedic Surgeons 2019, an estimated 54 million Americans have either osteoporosis or low bone mass. Moreover, in old age, the body builds fewer new bone cells to replace the old bone cells. Therefore, older people are at greater risk for osteoporosis and fracture. Thus, a rise in the geriatric population is more susceptible to bone fracture is anticipated to drive the demand for osteosynthesis devices.

Furthermore, the launch of novel osteosynthesis devices by key players provides a lucrative opportunity for the growth of the osteosynthesis devices market during the forecast period. For instance, in May 2020, Precision Spine, Inc., a medical device company, announced the national launch of Simplicity HP Anterior Cervical Plating (ACP) System, which enables surgeons to accommodate diverse patient anatomies and pathologies with low profile constrained semi-constrained or hybrid constructs.

The overall impact of the COVID-19 pandemic was negative on the osteosynthesis devices market owing to the cancellation of appointments with doctors and postponed surgeries. For instance, according to a study published in the British Journal of Surgery, in May 2020, based on 12 weeks of peak disruption to hospital services due to COVID-19, around 28.4 million elective surgeries worldwide were canceled or postponed in 2020. In addition, according to a study conducted by an international consortium in May 2020, more than 580,000 planned surgeries in India might be canceled or delayed due to the COVID-19 pandemic. Thus, with the delay of these non-emergent services, the demand for osteosynthesis devices decreases.

In addition, with the pandemic, researchers identify an alarming shortage of critical osteosynthesis devices. According to the review article “Effects of COVID-19 pandemic in the field of orthopedics” of National Library Medicine, published in 2020, performing orthopedics surgery has become a significant challenge with the non-availability of hospital staff and operation facilities during COVID-19. It had a significant effect on the manufacturing of osteosynthesis devices including orthopedic implants, prosthetics, tools, orthopedic biomedicine, and routine ongoing research and development.

Furthermore, the overall impact of the COVID-19 pandemic had negative for key players in the osteosynthesis devices market industry. For instance, 12-month revenue from Zimmer Biomet declined by 12% to around $7 billion in 2020, while orthopedics’ revenue from Johnson and Johnson decreased by 12.2% to nearly $7.8 billion. Stryker Orthopedics’ organic net sales decreased by 8.1% in 2020, including 6.6% from decreased unit volume and 1.5% from lower prices. Smith and Nephew reported a revenue loss of around 13% for its orthopedics and sports medicine business.

However, with relaxation in lockdowns, the positive impacts of vaccinations, and the decline in COVID-19 cases, companies have re-started their processes to meet the demand for products. In countries such as Japan and India, quarantine and the pandemic situation are improving and showing obvious signs of recovery. Various practitioners have started their service by implementing international and local guidance.

Furthermore, the osteosynthesis devices market witnessed an incline in the sales of osteosynthesis devices during the forecast period, owing to an increase in the number of patients for screening of orthopedic disorders, a rise in technological advancement in osteosynthesis devices, an increase in initiatives taken by the government to reduce the burden of orthopedic disorders, and increase in product launch. For instance, in September 2021, Precision Spine, Inc., a medical device company, announced the launch of the Dakota ACDF Standalone System in the treatment of degenerative disc disease (DDD). This system features a titanium plate polyetheretherketone (PEEK) cage with cortical cancellous screws for maximum support and a generous cavity for the autogenous bone graft to help facilitate fusion.

In addition, a rise in accidents, sports injuries, and a significant rise in the geriatric population are expected to witness the growth of the osteosynthesis devices market during the forecast period. Thus, such trends are expected to offer various lucrative Osteosynthesis Devices Market Opportunity during the forecast period.

Segmental Overview

The osteosynthesis devices market is segmented on the basis of device type, fracture type, end user, and region. On the basis of device type, the market is classified into internal fixation devices and external fixation devices. The internal fixation device segment is further divided into screws & plates, wires & pins, intramedullary rods & nails, and spinal fixation devices. The external fixation device segment is further divided into fracture fixation devices and bone lengthening devices. On the basis of fracture type, the market is classified into hip, knee, spine, shoulder, foot & ankle, facial bones, and others.

On the basis of end users, the market is classified into hospitals, orthopedic clinics, and ambulatory surgical centers. Region-wise, the market is analyzed across North America (the U.S., Canada, and Mexico), Europe (Germany, France, the UK, Italy, Spain, and the rest of Europe), Asia-Pacific (China, Japan, Australia, India, South Korea, and rest of Asia-Pacific), and LAMEA (Brazil, South Africa, Saudi Arabia, and rest of LAMEA).

By Device Type

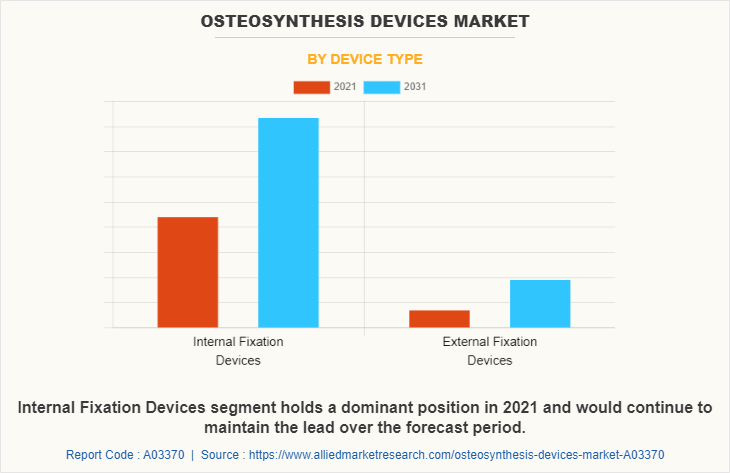
The osteosynthesis devices market is segmented into internal fixation devices and external fixation devices. The internal fixation device segment generated the maximum Osteosynthesis Devices Market share in 2021, owing to the high adoption of internal fixation devices, and the availability of various internal fixation devices such as screws and plates. The same segment is expected to witness the highest CAGR during the forecast period, owing to an increase in the use of internal fixation devices such as screws & plates, wires & pins, intramedullary rods & nails, and a rise in the prevalence of osteoporosis disease that further led to the fracture.
Osteosynthesis Devices Market

By Fracture Type

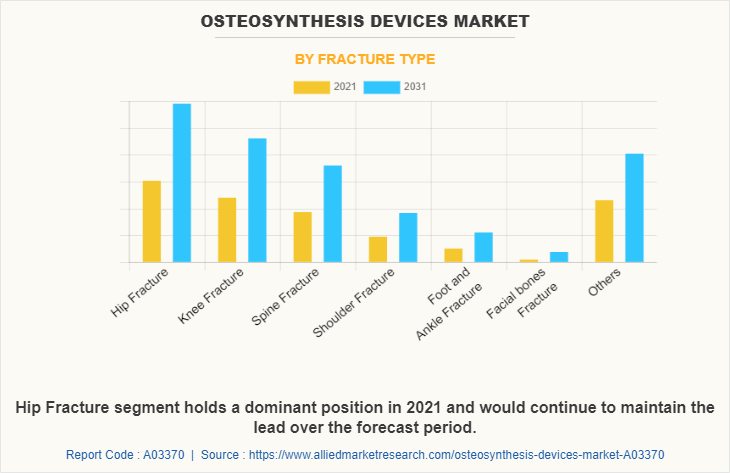
The osteosynthesis devices market is segregated into hip, knee, spine, shoulder, foot & ankle, facial bones, and others. The hip segment generated the maximum Osteosynthesis Devices Market share in 2021, owing to the high demand for osteosynthesis devices for hip fractures, and the high incidence of hip fractures. The same segment is expected to witness the highest CAGR during the forecast period, owing to a rise in accidental cases & sports injuries, and an increase in cases of hip fractures in elderly people.
Osteosynthesis Devices Market

By End User

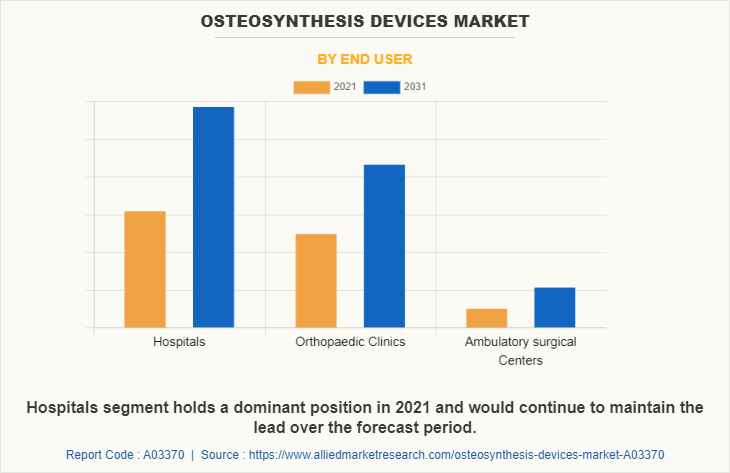
The Osteosynthesis Devices Industry is segregated into hospitals, orthopedic clinics, and ambulatory surgical centers. The hospital's segment generated maximum revenue in 2021, owing to an increase in health coverage for hospital-based treatment, an increase in hospital admission, and a higher preference for hospitals. The same segment is expected to witness the highest CAGR during the forecast period, owing to a rise in the prevalence of sports injuries, and road accidents which led to major fractures, and the presence of skilled orthopedic doctors in hospitals is the key factor that drives the growth of the market.
Osteosynthesis Devices Market

By Region

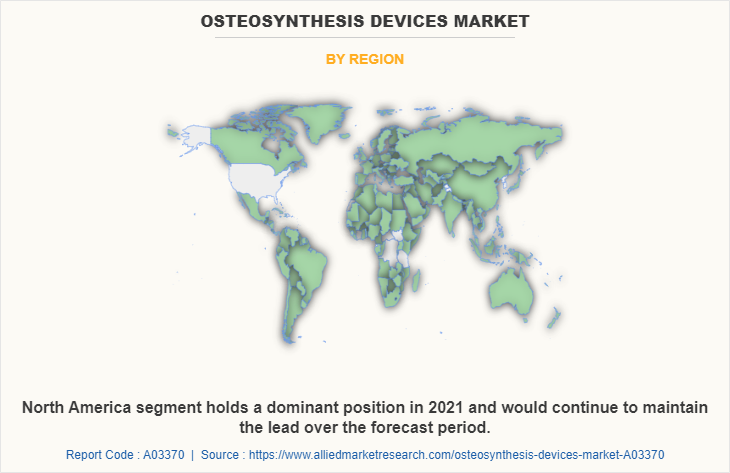
The Osteosynthesis Devices Industry market is studied across North America, Europe, Asia-Pacific, and LAMEA. North America accounted for a major share of the osteosynthesis devices market in 2021 and is expected to maintain its dominance during the forecast period. The presence of several major players, such as Arthrex, Inc., Johnson & Johnson (DePuy Synthes, Inc.), Globus Medical, Inc., GS Solutions, Inc., Life Spine, Inc., Precision Spine, Inc, Stryker Corporation, Zimmer Biomet Inc. and advancement in manufacturing technology of osteosynthesis devices in the region drive the growth of the market.

Furthermore, the existence of a sophisticated reimbursement structure that aims to reduce expenditure levels drives the growth of the market. Hence, such factors propel market growth. In addition, the U.S. is anticipated to contribute to a major share of the regional market and is expected to drive the growth of the osteosynthesis devices market throughout the forecast period. The presence of well-established healthcare infrastructure, high purchasing power, a rise in the adoption rate of osteosynthesis devices, and a significant rise in capital income in developed countries are expected to drive market growth.

Asia-Pacific is expected to grow at the highest rate during the osteosynthesis devices market forecast period. The osteosynthesis devices market growth in this region is attributable to the rise in the number of road accidents and orthopedic diseases in this region as well as growth in the purchasing power of populated countries, such as China and India. The countries in Asia-Pacific possess a huge population base, with China being the first having 1,397,715 population in 2020 and India being the second most populated country having 1,366,417.75 population in 2020.

COMPETITION ANALYSIS

Competitive analysis and profiles of the major players in the osteosynthesis devices market, such as Arthrex, Inc., Johnson & Johnson (DePuy Synthes, Inc.), Globus Medical, Inc., GS Solutions, Inc., Life Spine, Inc., Medtronic plc, Precision Spine, Inc, Smith & Nephew, Stryker Corporation, and Zimmer Biomet Inc. are provided in the report. There are some important players in the market such as Arthrex, Inc., Johnson & Johnson (DePuy Synthes, Inc.), Life Spine, Inc., Precision Spine, Inc, and Medtronic plc., which have adopted agreement, product development, product launch, and product approval, as key developmental strategies to improve the product portfolio of the osteosynthesis devices market.
Osteosynthesis Devices Market

Some examples of Product Approval in the market

  • In March 2022, Life Spine, a medical device company that designs, develops, manufactures, and markets products for the surgical treatment of spinal disorders, received clearance from the U.S. Food & Drug Administration (FDA) to market SImpact Si Joint Fixation System for Posterior-Oblique approaches.
  • In June 2021, Medtronic plc, one of the global leaders in medical technology, announced the U.S. Food and Drug Administration (FDA) approval of patient-specific UNiD Rods for use with Medtronic CD Horizon Solera Voyager and Infinity OCT spinal systems, expanding the utility of the company's UNiD Adaptative Spine Intelligence (ASI) technology. These are designed for each patient and industrially pre-bent prior to surgery to accurately match an artificial intelligence (AI)-driven pre-operative surgical plan.

Product Upgrade/development in the market

  • In October 2021, Globus Medical, Inc., a leading musculoskeletal solutions company, announced to feature of its new ANTHEM Mini Fragment Fracture System at the annual Orthopedic Trauma Association (OTA) meeting in Fort Worth, Texas. This addition to the growing Globus trauma portfolio aligns with the upward trend among surgeons to supplement the treatment of complex long bone fractures with mini fragment plates.

Product Launch in the market

  • In September 2021, Precision Spine, Inc., a medical device company, announced the launch of the Dakota ACDF Standalone System in the treatment of degenerative disc disease (DDD). This system features a titanium plate polyetheretherketone (PEEK) cage with cortical cancellous screws for maximum support and a generous cavity for the autogenous bone graft to help facilitate fusion.
  • In June 2021, Johnson & Johnson (DePuy Synthes), a healthcare company announced the launch of 2.7 mm Variable Angle Locking Compression Plate (VA LCP) Clavicle Plate System for the treatment of lateral, shaft and medial fractures for small, medium, and large clavicles. This new system offers plate shapes that reflect the correlation between patient stature and clavicle size to match the bow and contour of the clavicle and accommodate a broad range of anatomic variability of the clavicle.
  • In April 2020, Precision Spine, Inc., a medical device company, announced the national launch of ShurFit ACIF 2C Anterior Cervical, TLIF 2C, and TPLIF 2C Posterior Interbody Systems, which is made from medical grade polyetheretherketone (Peek Optima, LT1) and coated with both commercially pure Titanium (Ti) and Hydroxyapatite (HA).
  • In March 2020, Precision Spine, Inc., a medical device company, announced the national launch of the SureLOK MIS 3L Percutaneous Screw System, which provides spine surgeons with outstanding versatility and flexibility in terms of procedural approaches and application of its various components.

Agreement in the market

  • In December 2020, Globus Medical, Inc., a leading musculoskeletal solutions company, received an award for a group purchasing agreement with Premier, one of the largest group purchasing organizations in the U.S. The agreement covers Globus’ Trauma Platform, which includes ANTHEM Plating, AUTOBAHN Nailing, ARBOR External Fixation, and CAPTIVATE Screw Platforms.

Key Benefits For Stakeholders

  • This report provides a quantitative analysis of the market segments, current trends, estimations, and dynamics of the osteosynthesis devices market analysis from 2021 to 2031 to identify the prevailing osteosynthesis devices market opportunities.
  • The market research is offered along with information related to key drivers, restraints, and opportunities.
  • Porter's five forces analysis highlights the potency of buyers and suppliers to enable stakeholders make profit-oriented business decisions and strengthen their supplier-buyer network.
  • In-depth analysis of the osteosynthesis devices market segmentation assists to determine the prevailing market opportunities.
  • Major countries in each region are mapped according to their revenue contribution to the global market.
  • Market player positioning facilitates benchmarking and provides a clear understanding of the present position of the market players.
  • The report includes the analysis of the regional as well as global osteosynthesis devices market trends, key players, market segments, application areas, and market growth strategies.

Osteosynthesis Devices Market Report Highlights

Aspects Details
Market Size By 2031 USD 14.2 billion
Growth Rate CAGR of 4.6%
Forecast period 2021 - 2031
Report Pages 256
By Device Type
  • External Fixation Devices
    • Type
      •  Fracture Fixation Devices
      •  Bone Lengthening Devices
  • Internal Fixation Devices
    • Type
      • Screws and Plates
      • Wires and Pins
      • Intramedullary Rods and Nails
      • Spinal Fixation Devices
By Fracture Type
  • Hip Fracture
  • Knee Fracture
  • Spine Fracture
  • Shoulder Fracture
  • Foot and Ankle Fracture
  • Facial bones Fracture
  • Others
By End User
  • Hospitals
  • Orthopaedic Clinics
  • Ambulatory surgical Centers
By Region
  • North America  (U.S., Canada, Mexico)
  • Europe  (Germany, France, UK, Italy, Spain, Rest of Europe)
  • Asia-Pacific  (Japan, China, Australia, India, South Korea, Rest of Asia-Pacific)
  • LAMEA  (Brazil, Saudi Arabia, South Africa, Rest of LAMEA)
Key Market Players Zimmer Biomet Holding Inc., Medtronic plc, Johnson & Johnson, Arthrex, Inc., Life Spine, Inc., Precision Spine, Inc., Smith & Nephew plc, Stryker Corporation, GS Solutions, Inc., Globus Medical, Inc.
 
  • CHAPTER 1: INTRODUCTION

    • 1.1. Report description

    • 1.2. Key market segments

    • 1.3. Key benefits to the stakeholders

    • 1.4. Research Methodology

      • 1.4.1. Primary research

      • 1.4.2. Secondary research

      • 1.4.3. Analyst tools and models

  • CHAPTER 2: EXECUTIVE SUMMARY

    • 2.1. CXO Perspective

  • CHAPTER 3: MARKET OVERVIEW

    • 3.1. Market definition and scope

    • 3.2. Key findings

      • 3.2.1. Top impacting factors

      • 3.2.2. Top investment pockets

    • 3.3. Porter’s five forces analysis

      • 3.3.1. Bargaining power of suppliers

      • 3.3.2. Bargaining power of buyers

      • 3.3.3. Threat of substitutes

      • 3.3.4. Threat of new entrants

      • 3.3.5. Intensity of rivalry

    • 3.4. Market dynamics

      • 3.4.1. Drivers

        • 3.4.1.1. Rise in prevalence of orthopedic disorders
        • 3.4.1.2. Rise in number of accidents & sports injuries
        • 3.4.1.3. Rise in geriatric population

      • 3.4.2. Restraints

        • 3.4.2.1. Complications associated with osteosynthesis devices.

      • 3.4.3. Opportunities

        • 3.4.3.1. Launch of novel osteosynthesis devices

    • 3.5. COVID-19 Impact Analysis on the market

  • CHAPTER 4: OSTEOSYNTHESIS DEVICES MARKET, BY DEVICE TYPE

    • 4.1. Overview

      • 4.1.1. Market size and forecast

    • 4.2. Internal Fixation Devices

      • 4.2.1. Key market trends, growth factors and opportunities

      • 4.2.2. Market size and forecast, by region

      • 4.2.3. Market share analysis by country

      • 4.2.4. Internal Fixation Devices Osteosynthesis Devices Market by Type

    • 4.3. External Fixation Devices

      • 4.3.1. Key market trends, growth factors and opportunities

      • 4.3.2. Market size and forecast, by region

      • 4.3.3. Market share analysis by country

      • 4.3.4. External Fixation Devices Osteosynthesis Devices Market by Type

  • CHAPTER 5: OSTEOSYNTHESIS DEVICES MARKET, BY FRACTURE TYPE

    • 5.1. Overview

      • 5.1.1. Market size and forecast

    • 5.2. Hip Fracture

      • 5.2.1. Key market trends, growth factors and opportunities

      • 5.2.2. Market size and forecast, by region

      • 5.2.3. Market share analysis by country

    • 5.3. Knee Fracture

      • 5.3.1. Key market trends, growth factors and opportunities

      • 5.3.2. Market size and forecast, by region

      • 5.3.3. Market share analysis by country

    • 5.4. Spine Fracture

      • 5.4.1. Key market trends, growth factors and opportunities

      • 5.4.2. Market size and forecast, by region

      • 5.4.3. Market share analysis by country

    • 5.5. Shoulder Fracture

      • 5.5.1. Key market trends, growth factors and opportunities

      • 5.5.2. Market size and forecast, by region

      • 5.5.3. Market share analysis by country

    • 5.6. Foot and Ankle Fracture

      • 5.6.1. Key market trends, growth factors and opportunities

      • 5.6.2. Market size and forecast, by region

      • 5.6.3. Market share analysis by country

    • 5.7. Facial bones Fracture

      • 5.7.1. Key market trends, growth factors and opportunities

      • 5.7.2. Market size and forecast, by region

      • 5.7.3. Market share analysis by country

    • 5.8. Others

      • 5.8.1. Key market trends, growth factors and opportunities

      • 5.8.2. Market size and forecast, by region

      • 5.8.3. Market share analysis by country

  • CHAPTER 6: OSTEOSYNTHESIS DEVICES MARKET, BY END USER

    • 6.1. Overview

      • 6.1.1. Market size and forecast

    • 6.2. Hospitals

      • 6.2.1. Key market trends, growth factors and opportunities

      • 6.2.2. Market size and forecast, by region

      • 6.2.3. Market share analysis by country

    • 6.3. Orthopaedic Clinics

      • 6.3.1. Key market trends, growth factors and opportunities

      • 6.3.2. Market size and forecast, by region

      • 6.3.3. Market share analysis by country

    • 6.4. Ambulatory surgical Centers

      • 6.4.1. Key market trends, growth factors and opportunities

      • 6.4.2. Market size and forecast, by region

      • 6.4.3. Market share analysis by country

  • CHAPTER 7: OSTEOSYNTHESIS DEVICES MARKET, BY REGION

    • 7.1. Overview

      • 7.1.1. Market size and forecast By Region

    • 7.2. North America

      • 7.2.1. Key trends and opportunities

      • 7.2.2. Market size and forecast, by Device Type

      • 7.2.3. Market size and forecast, by Fracture Type

      • 7.2.4. Market size and forecast, by End User

      • 7.2.5. Market size and forecast, by country

        • 7.2.5.1. U.S.
          • 7.2.5.1.1. Key market trends, growth factors and opportunities
          • 7.2.5.1.2. Market size and forecast, by Device Type
          • 7.2.5.1.3. Market size and forecast, by Fracture Type
          • 7.2.5.1.4. Market size and forecast, by End User
        • 7.2.5.2. Canada
          • 7.2.5.2.1. Key market trends, growth factors and opportunities
          • 7.2.5.2.2. Market size and forecast, by Device Type
          • 7.2.5.2.3. Market size and forecast, by Fracture Type
          • 7.2.5.2.4. Market size and forecast, by End User
        • 7.2.5.3. Mexico
          • 7.2.5.3.1. Key market trends, growth factors and opportunities
          • 7.2.5.3.2. Market size and forecast, by Device Type
          • 7.2.5.3.3. Market size and forecast, by Fracture Type
          • 7.2.5.3.4. Market size and forecast, by End User
    • 7.3. Europe

      • 7.3.1. Key trends and opportunities

      • 7.3.2. Market size and forecast, by Device Type

      • 7.3.3. Market size and forecast, by Fracture Type

      • 7.3.4. Market size and forecast, by End User

      • 7.3.5. Market size and forecast, by country

        • 7.3.5.1. Germany
          • 7.3.5.1.1. Key market trends, growth factors and opportunities
          • 7.3.5.1.2. Market size and forecast, by Device Type
          • 7.3.5.1.3. Market size and forecast, by Fracture Type
          • 7.3.5.1.4. Market size and forecast, by End User
        • 7.3.5.2. France
          • 7.3.5.2.1. Key market trends, growth factors and opportunities
          • 7.3.5.2.2. Market size and forecast, by Device Type
          • 7.3.5.2.3. Market size and forecast, by Fracture Type
          • 7.3.5.2.4. Market size and forecast, by End User
        • 7.3.5.3. UK
          • 7.3.5.3.1. Key market trends, growth factors and opportunities
          • 7.3.5.3.2. Market size and forecast, by Device Type
          • 7.3.5.3.3. Market size and forecast, by Fracture Type
          • 7.3.5.3.4. Market size and forecast, by End User
        • 7.3.5.4. Italy
          • 7.3.5.4.1. Key market trends, growth factors and opportunities
          • 7.3.5.4.2. Market size and forecast, by Device Type
          • 7.3.5.4.3. Market size and forecast, by Fracture Type
          • 7.3.5.4.4. Market size and forecast, by End User
        • 7.3.5.5. Spain
          • 7.3.5.5.1. Key market trends, growth factors and opportunities
          • 7.3.5.5.2. Market size and forecast, by Device Type
          • 7.3.5.5.3. Market size and forecast, by Fracture Type
          • 7.3.5.5.4. Market size and forecast, by End User
        • 7.3.5.6. Rest of Europe
          • 7.3.5.6.1. Key market trends, growth factors and opportunities
          • 7.3.5.6.2. Market size and forecast, by Device Type
          • 7.3.5.6.3. Market size and forecast, by Fracture Type
          • 7.3.5.6.4. Market size and forecast, by End User
    • 7.4. Asia-Pacific

      • 7.4.1. Key trends and opportunities

      • 7.4.2. Market size and forecast, by Device Type

      • 7.4.3. Market size and forecast, by Fracture Type

      • 7.4.4. Market size and forecast, by End User

      • 7.4.5. Market size and forecast, by country

        • 7.4.5.1. Japan
          • 7.4.5.1.1. Key market trends, growth factors and opportunities
          • 7.4.5.1.2. Market size and forecast, by Device Type
          • 7.4.5.1.3. Market size and forecast, by Fracture Type
          • 7.4.5.1.4. Market size and forecast, by End User
        • 7.4.5.2. China
          • 7.4.5.2.1. Key market trends, growth factors and opportunities
          • 7.4.5.2.2. Market size and forecast, by Device Type
          • 7.4.5.2.3. Market size and forecast, by Fracture Type
          • 7.4.5.2.4. Market size and forecast, by End User
        • 7.4.5.3. Australia
          • 7.4.5.3.1. Key market trends, growth factors and opportunities
          • 7.4.5.3.2. Market size and forecast, by Device Type
          • 7.4.5.3.3. Market size and forecast, by Fracture Type
          • 7.4.5.3.4. Market size and forecast, by End User
        • 7.4.5.4. India
          • 7.4.5.4.1. Key market trends, growth factors and opportunities
          • 7.4.5.4.2. Market size and forecast, by Device Type
          • 7.4.5.4.3. Market size and forecast, by Fracture Type
          • 7.4.5.4.4. Market size and forecast, by End User
        • 7.4.5.5. South Korea
          • 7.4.5.5.1. Key market trends, growth factors and opportunities
          • 7.4.5.5.2. Market size and forecast, by Device Type
          • 7.4.5.5.3. Market size and forecast, by Fracture Type
          • 7.4.5.5.4. Market size and forecast, by End User
        • 7.4.5.6. Rest of Asia-Pacific
          • 7.4.5.6.1. Key market trends, growth factors and opportunities
          • 7.4.5.6.2. Market size and forecast, by Device Type
          • 7.4.5.6.3. Market size and forecast, by Fracture Type
          • 7.4.5.6.4. Market size and forecast, by End User
    • 7.5. LAMEA

      • 7.5.1. Key trends and opportunities

      • 7.5.2. Market size and forecast, by Device Type

      • 7.5.3. Market size and forecast, by Fracture Type

      • 7.5.4. Market size and forecast, by End User

      • 7.5.5. Market size and forecast, by country

        • 7.5.5.1. Brazil
          • 7.5.5.1.1. Key market trends, growth factors and opportunities
          • 7.5.5.1.2. Market size and forecast, by Device Type
          • 7.5.5.1.3. Market size and forecast, by Fracture Type
          • 7.5.5.1.4. Market size and forecast, by End User
        • 7.5.5.2. Saudi Arabia
          • 7.5.5.2.1. Key market trends, growth factors and opportunities
          • 7.5.5.2.2. Market size and forecast, by Device Type
          • 7.5.5.2.3. Market size and forecast, by Fracture Type
          • 7.5.5.2.4. Market size and forecast, by End User
        • 7.5.5.3. South Africa
          • 7.5.5.3.1. Key market trends, growth factors and opportunities
          • 7.5.5.3.2. Market size and forecast, by Device Type
          • 7.5.5.3.3. Market size and forecast, by Fracture Type
          • 7.5.5.3.4. Market size and forecast, by End User
        • 7.5.5.4. Rest of LAMEA
          • 7.5.5.4.1. Key market trends, growth factors and opportunities
          • 7.5.5.4.2. Market size and forecast, by Device Type
          • 7.5.5.4.3. Market size and forecast, by Fracture Type
          • 7.5.5.4.4. Market size and forecast, by End User
  • CHAPTER 8: COMPETITIVE LANDSCAPE

    • 8.1. Introduction

    • 8.2. Top winning strategies

    • 8.3. Product Mapping of Top 10 Player

    • 8.4. Competitive Dashboard

    • 8.5. Competitive Heatmap

    • 8.6. Top player positioning, 2021

  • CHAPTER 9: COMPANY PROFILES

    • 9.1. Arthrex, Inc.

      • 9.1.1. Company overview

      • 9.1.2. Key Executives

      • 9.1.3. Company snapshot

      • 9.1.4. Operating business segments

      • 9.1.5. Product portfolio

    • 9.2. Globus Medical, Inc.

      • 9.2.1. Company overview

      • 9.2.2. Key Executives

      • 9.2.3. Company snapshot

      • 9.2.4. Operating business segments

      • 9.2.5. Product portfolio

      • 9.2.6. Business performance

      • 9.2.7. Key strategic moves and developments

    • 9.3. GS Solutions, Inc.

      • 9.3.1. Company overview

      • 9.3.2. Key Executives

      • 9.3.3. Company snapshot

      • 9.3.4. Operating business segments

      • 9.3.5. Product portfolio

    • 9.4. Johnson & Johnson

      • 9.4.1. Company overview

      • 9.4.2. Key Executives

      • 9.4.3. Company snapshot

      • 9.4.4. Operating business segments

      • 9.4.5. Product portfolio

      • 9.4.6. Business performance

      • 9.4.7. Key strategic moves and developments

    • 9.5. Life Spine, Inc.

      • 9.5.1. Company overview

      • 9.5.2. Key Executives

      • 9.5.3. Company snapshot

      • 9.5.4. Operating business segments

      • 9.5.5. Product portfolio

      • 9.5.6. Key strategic moves and developments

    • 9.6. Precision Spine, Inc.

      • 9.6.1. Company overview

      • 9.6.2. Key Executives

      • 9.6.3. Company snapshot

      • 9.6.4. Operating business segments

      • 9.6.5. Product portfolio

      • 9.6.6. Key strategic moves and developments

    • 9.7. Stryker Corporation

      • 9.7.1. Company overview

      • 9.7.2. Key Executives

      • 9.7.3. Company snapshot

      • 9.7.4. Operating business segments

      • 9.7.5. Product portfolio

      • 9.7.6. Business performance

    • 9.8. Zimmer Biomet Holding Inc.

      • 9.8.1. Company overview

      • 9.8.2. Key Executives

      • 9.8.3. Company snapshot

      • 9.8.4. Operating business segments

      • 9.8.5. Product portfolio

      • 9.8.6. Business performance

    • 9.9. Medtronic plc

      • 9.9.1. Company overview

      • 9.9.2. Key Executives

      • 9.9.3. Company snapshot

      • 9.9.4. Operating business segments

      • 9.9.5. Product portfolio

      • 9.9.6. Business performance

      • 9.9.7. Key strategic moves and developments

    • 9.10. Smith & Nephew plc

      • 9.10.1. Company overview

      • 9.10.2. Key Executives

      • 9.10.3. Company snapshot

      • 9.10.4. Operating business segments

      • 9.10.5. Product portfolio

      • 9.10.6. Business performance

  • LIST OF TABLES

  • TABLE 01. GLOBAL OSTEOSYNTHESIS DEVICES MARKET, BY DEVICE TYPE, 2021-2031 ($MILLION)
    TABLE 02. OSTEOSYNTHESIS DEVICES MARKET FOR INTERNAL FIXATION DEVICES, BY REGION, 2021-2031 ($MILLION)
    TABLE 03. GLOBAL INTERNAL FIXATION DEVICES OSTEOSYNTHESIS DEVICES MARKET, BY TYPE, 2021-2031 ($MILLION)
    TABLE 04. OSTEOSYNTHESIS DEVICES MARKET FOR EXTERNAL FIXATION DEVICES, BY REGION, 2021-2031 ($MILLION)
    TABLE 05. GLOBAL EXTERNAL FIXATION DEVICES OSTEOSYNTHESIS DEVICES MARKET, BY TYPE, 2021-2031 ($MILLION)
    TABLE 06. GLOBAL OSTEOSYNTHESIS DEVICES MARKET, BY FRACTURE TYPE, 2021-2031 ($MILLION)
    TABLE 07. OSTEOSYNTHESIS DEVICES MARKET FOR HIP FRACTURE, BY REGION, 2021-2031 ($MILLION)
    TABLE 08. OSTEOSYNTHESIS DEVICES MARKET FOR KNEE FRACTURE, BY REGION, 2021-2031 ($MILLION)
    TABLE 09. OSTEOSYNTHESIS DEVICES MARKET FOR SPINE FRACTURE, BY REGION, 2021-2031 ($MILLION)
    TABLE 10. OSTEOSYNTHESIS DEVICES MARKET FOR SHOULDER FRACTURE, BY REGION, 2021-2031 ($MILLION)
    TABLE 11. OSTEOSYNTHESIS DEVICES MARKET FOR FOOT AND ANKLE FRACTURE, BY REGION, 2021-2031 ($MILLION)
    TABLE 12. OSTEOSYNTHESIS DEVICES MARKET FOR FACIAL BONES FRACTURE, BY REGION, 2021-2031 ($MILLION)
    TABLE 13. OSTEOSYNTHESIS DEVICES MARKET FOR OTHERS, BY REGION, 2021-2031 ($MILLION)
    TABLE 14. GLOBAL OSTEOSYNTHESIS DEVICES MARKET, BY END USER, 2021-2031 ($MILLION)
    TABLE 15. OSTEOSYNTHESIS DEVICES MARKET FOR HOSPITALS, BY REGION, 2021-2031 ($MILLION)
    TABLE 16. OSTEOSYNTHESIS DEVICES MARKET FOR ORTHOPAEDIC CLINICS, BY REGION, 2021-2031 ($MILLION)
    TABLE 17. OSTEOSYNTHESIS DEVICES MARKET FOR AMBULATORY SURGICAL CENTERS, BY REGION, 2021-2031 ($MILLION)
    TABLE 18. OSTEOSYNTHESIS DEVICES MARKET, BY REGION, 2021-2031 ($MILLION)
    TABLE 19. NORTH AMERICA OSTEOSYNTHESIS DEVICES MARKET, BY DEVICE TYPE, 2021-2031 ($MILLION)
    TABLE 20. NORTH AMERICA OSTEOSYNTHESIS DEVICES MARKET, BY FRACTURE TYPE, 2021-2031 ($MILLION)
    TABLE 21. NORTH AMERICA OSTEOSYNTHESIS DEVICES MARKET, BY END USER, 2021-2031 ($MILLION)
    TABLE 22. NORTH AMERICA OSTEOSYNTHESIS DEVICES MARKET, BY COUNTRY, 2021-2031 ($MILLION)
    TABLE 23. U.S. OSTEOSYNTHESIS DEVICES MARKET, BY DEVICE TYPE, 2021-2031 ($MILLION)
    TABLE 24. U.S. OSTEOSYNTHESIS DEVICES MARKET, BY FRACTURE TYPE, 2021-2031 ($MILLION)
    TABLE 25. U.S. OSTEOSYNTHESIS DEVICES MARKET, BY END USER, 2021-2031 ($MILLION)
    TABLE 26. CANADA OSTEOSYNTHESIS DEVICES MARKET, BY DEVICE TYPE, 2021-2031 ($MILLION)
    TABLE 27. CANADA OSTEOSYNTHESIS DEVICES MARKET, BY FRACTURE TYPE, 2021-2031 ($MILLION)
    TABLE 28. CANADA OSTEOSYNTHESIS DEVICES MARKET, BY END USER, 2021-2031 ($MILLION)
    TABLE 29. MEXICO OSTEOSYNTHESIS DEVICES MARKET, BY DEVICE TYPE, 2021-2031 ($MILLION)
    TABLE 30. MEXICO OSTEOSYNTHESIS DEVICES MARKET, BY FRACTURE TYPE, 2021-2031 ($MILLION)
    TABLE 31. MEXICO OSTEOSYNTHESIS DEVICES MARKET, BY END USER, 2021-2031 ($MILLION)
    TABLE 32. EUROPE OSTEOSYNTHESIS DEVICES MARKET, BY DEVICE TYPE, 2021-2031 ($MILLION)
    TABLE 33. EUROPE OSTEOSYNTHESIS DEVICES MARKET, BY FRACTURE TYPE, 2021-2031 ($MILLION)
    TABLE 34. EUROPE OSTEOSYNTHESIS DEVICES MARKET, BY END USER, 2021-2031 ($MILLION)
    TABLE 35. EUROPE OSTEOSYNTHESIS DEVICES MARKET, BY COUNTRY, 2021-2031 ($MILLION)
    TABLE 36. GERMANY OSTEOSYNTHESIS DEVICES MARKET, BY DEVICE TYPE, 2021-2031 ($MILLION)
    TABLE 37. GERMANY OSTEOSYNTHESIS DEVICES MARKET, BY FRACTURE TYPE, 2021-2031 ($MILLION)
    TABLE 38. GERMANY OSTEOSYNTHESIS DEVICES MARKET, BY END USER, 2021-2031 ($MILLION)
    TABLE 39. FRANCE OSTEOSYNTHESIS DEVICES MARKET, BY DEVICE TYPE, 2021-2031 ($MILLION)
    TABLE 40. FRANCE OSTEOSYNTHESIS DEVICES MARKET, BY FRACTURE TYPE, 2021-2031 ($MILLION)
    TABLE 41. FRANCE OSTEOSYNTHESIS DEVICES MARKET, BY END USER, 2021-2031 ($MILLION)
    TABLE 42. UK OSTEOSYNTHESIS DEVICES MARKET, BY DEVICE TYPE, 2021-2031 ($MILLION)
    TABLE 43. UK OSTEOSYNTHESIS DEVICES MARKET, BY FRACTURE TYPE, 2021-2031 ($MILLION)
    TABLE 44. UK OSTEOSYNTHESIS DEVICES MARKET, BY END USER, 2021-2031 ($MILLION)
    TABLE 45. ITALY OSTEOSYNTHESIS DEVICES MARKET, BY DEVICE TYPE, 2021-2031 ($MILLION)
    TABLE 46. ITALY OSTEOSYNTHESIS DEVICES MARKET, BY FRACTURE TYPE, 2021-2031 ($MILLION)
    TABLE 47. ITALY OSTEOSYNTHESIS DEVICES MARKET, BY END USER, 2021-2031 ($MILLION)
    TABLE 48. SPAIN OSTEOSYNTHESIS DEVICES MARKET, BY DEVICE TYPE, 2021-2031 ($MILLION)
    TABLE 49. SPAIN OSTEOSYNTHESIS DEVICES MARKET, BY FRACTURE TYPE, 2021-2031 ($MILLION)
    TABLE 50. SPAIN OSTEOSYNTHESIS DEVICES MARKET, BY END USER, 2021-2031 ($MILLION)
    TABLE 51. REST OF EUROPE OSTEOSYNTHESIS DEVICES MARKET, BY DEVICE TYPE, 2021-2031 ($MILLION)
    TABLE 52. REST OF EUROPE OSTEOSYNTHESIS DEVICES MARKET, BY FRACTURE TYPE, 2021-2031 ($MILLION)
    TABLE 53. REST OF EUROPE OSTEOSYNTHESIS DEVICES MARKET, BY END USER, 2021-2031 ($MILLION)
    TABLE 54. ASIA-PACIFIC OSTEOSYNTHESIS DEVICES MARKET, BY DEVICE TYPE, 2021-2031 ($MILLION)
    TABLE 55. ASIA-PACIFIC OSTEOSYNTHESIS DEVICES MARKET, BY FRACTURE TYPE, 2021-2031 ($MILLION)
    TABLE 56. ASIA-PACIFIC OSTEOSYNTHESIS DEVICES MARKET, BY END USER, 2021-2031 ($MILLION)
    TABLE 57. ASIA-PACIFIC OSTEOSYNTHESIS DEVICES MARKET, BY COUNTRY, 2021-2031 ($MILLION)
    TABLE 58. JAPAN OSTEOSYNTHESIS DEVICES MARKET, BY DEVICE TYPE, 2021-2031 ($MILLION)
    TABLE 59. JAPAN OSTEOSYNTHESIS DEVICES MARKET, BY FRACTURE TYPE, 2021-2031 ($MILLION)
    TABLE 60. JAPAN OSTEOSYNTHESIS DEVICES MARKET, BY END USER, 2021-2031 ($MILLION)
    TABLE 61. CHINA OSTEOSYNTHESIS DEVICES MARKET, BY DEVICE TYPE, 2021-2031 ($MILLION)
    TABLE 62. CHINA OSTEOSYNTHESIS DEVICES MARKET, BY FRACTURE TYPE, 2021-2031 ($MILLION)
    TABLE 63. CHINA OSTEOSYNTHESIS DEVICES MARKET, BY END USER, 2021-2031 ($MILLION)
    TABLE 64. AUSTRALIA OSTEOSYNTHESIS DEVICES MARKET, BY DEVICE TYPE, 2021-2031 ($MILLION)
    TABLE 65. AUSTRALIA OSTEOSYNTHESIS DEVICES MARKET, BY FRACTURE TYPE, 2021-2031 ($MILLION)
    TABLE 66. AUSTRALIA OSTEOSYNTHESIS DEVICES MARKET, BY END USER, 2021-2031 ($MILLION)
    TABLE 67. INDIA OSTEOSYNTHESIS DEVICES MARKET, BY DEVICE TYPE, 2021-2031 ($MILLION)
    TABLE 68. INDIA OSTEOSYNTHESIS DEVICES MARKET, BY FRACTURE TYPE, 2021-2031 ($MILLION)
    TABLE 69. INDIA OSTEOSYNTHESIS DEVICES MARKET, BY END USER, 2021-2031 ($MILLION)
    TABLE 70. SOUTH KOREA OSTEOSYNTHESIS DEVICES MARKET, BY DEVICE TYPE, 2021-2031 ($MILLION)
    TABLE 71. SOUTH KOREA OSTEOSYNTHESIS DEVICES MARKET, BY FRACTURE TYPE, 2021-2031 ($MILLION)
    TABLE 72. SOUTH KOREA OSTEOSYNTHESIS DEVICES MARKET, BY END USER, 2021-2031 ($MILLION)
    TABLE 73. REST OF ASIA-PACIFIC OSTEOSYNTHESIS DEVICES MARKET, BY DEVICE TYPE, 2021-2031 ($MILLION)
    TABLE 74. REST OF ASIA-PACIFIC OSTEOSYNTHESIS DEVICES MARKET, BY FRACTURE TYPE, 2021-2031 ($MILLION)
    TABLE 75. REST OF ASIA-PACIFIC OSTEOSYNTHESIS DEVICES MARKET, BY END USER, 2021-2031 ($MILLION)
    TABLE 76. LAMEA OSTEOSYNTHESIS DEVICES MARKET, BY DEVICE TYPE, 2021-2031 ($MILLION)
    TABLE 77. LAMEA OSTEOSYNTHESIS DEVICES MARKET, BY FRACTURE TYPE, 2021-2031 ($MILLION)
    TABLE 78. LAMEA OSTEOSYNTHESIS DEVICES MARKET, BY END USER, 2021-2031 ($MILLION)
    TABLE 79. LAMEA OSTEOSYNTHESIS DEVICES MARKET, BY COUNTRY, 2021-2031 ($MILLION)
    TABLE 80. BRAZIL OSTEOSYNTHESIS DEVICES MARKET, BY DEVICE TYPE, 2021-2031 ($MILLION)
    TABLE 81. BRAZIL OSTEOSYNTHESIS DEVICES MARKET, BY FRACTURE TYPE, 2021-2031 ($MILLION)
    TABLE 82. BRAZIL OSTEOSYNTHESIS DEVICES MARKET, BY END USER, 2021-2031 ($MILLION)
    TABLE 83. SAUDI ARABIA OSTEOSYNTHESIS DEVICES MARKET, BY DEVICE TYPE, 2021-2031 ($MILLION)
    TABLE 84. SAUDI ARABIA OSTEOSYNTHESIS DEVICES MARKET, BY FRACTURE TYPE, 2021-2031 ($MILLION)
    TABLE 85. SAUDI ARABIA OSTEOSYNTHESIS DEVICES MARKET, BY END USER, 2021-2031 ($MILLION)
    TABLE 86. SOUTH AFRICA OSTEOSYNTHESIS DEVICES MARKET, BY DEVICE TYPE, 2021-2031 ($MILLION)
    TABLE 87. SOUTH AFRICA OSTEOSYNTHESIS DEVICES MARKET, BY FRACTURE TYPE, 2021-2031 ($MILLION)
    TABLE 88. SOUTH AFRICA OSTEOSYNTHESIS DEVICES MARKET, BY END USER, 2021-2031 ($MILLION)
    TABLE 89. REST OF LAMEA OSTEOSYNTHESIS DEVICES MARKET, BY DEVICE TYPE, 2021-2031 ($MILLION)
    TABLE 90. REST OF LAMEA OSTEOSYNTHESIS DEVICES MARKET, BY FRACTURE TYPE, 2021-2031 ($MILLION)
    TABLE 91. REST OF LAMEA OSTEOSYNTHESIS DEVICES MARKET, BY END USER, 2021-2031 ($MILLION)
    TABLE 92. ARTHREX, INC.: KEY EXECUTIVES
    TABLE 93. ARTHREX, INC.: COMPANY SNAPSHOT
    TABLE 94. ARTHREX, INC.: PRODUCT SEGMENTS
    TABLE 95. ARTHREX, INC.: PRODUCT PORTFOLIO
    TABLE 96. GLOBUS MEDICAL, INC.: KEY EXECUTIVES
    TABLE 97. GLOBUS MEDICAL, INC.: COMPANY SNAPSHOT
    TABLE 98. GLOBUS MEDICAL, INC.: PRODUCT SEGMENTS
    TABLE 99. GLOBUS MEDICAL, INC.: PRODUCT PORTFOLIO
    TABLE 100. GLOBUS MEDICAL, INC.: KEY STRATERGIES
    TABLE 101. GS SOLUTIONS, INC.: KEY EXECUTIVES
    TABLE 102. GS SOLUTIONS, INC.: COMPANY SNAPSHOT
    TABLE 103. GS SOLUTIONS, INC.: PRODUCT SEGMENTS
    TABLE 104. GS SOLUTIONS, INC.: PRODUCT PORTFOLIO
    TABLE 105. JOHNSON & JOHNSON: KEY EXECUTIVES
    TABLE 106. JOHNSON & JOHNSON: COMPANY SNAPSHOT
    TABLE 107. JOHNSON & JOHNSON: PRODUCT SEGMENTS
    TABLE 108. JOHNSON & JOHNSON: PRODUCT PORTFOLIO
    TABLE 109. JOHNSON & JOHNSON: KEY STRATERGIES
    TABLE 110. LIFE SPINE, INC.: KEY EXECUTIVES
    TABLE 111. LIFE SPINE, INC.: COMPANY SNAPSHOT
    TABLE 112. LIFE SPINE, INC.: PRODUCT SEGMENTS
    TABLE 113. LIFE SPINE, INC.: PRODUCT PORTFOLIO
    TABLE 114. LIFE SPINE, INC.: KEY STRATERGIES
    TABLE 115. PRECISION SPINE, INC.: KEY EXECUTIVES
    TABLE 116. PRECISION SPINE, INC.: COMPANY SNAPSHOT
    TABLE 117. PRECISION SPINE, INC.: PRODUCT SEGMENTS
    TABLE 118. PRECISION SPINE, INC.: PRODUCT PORTFOLIO
    TABLE 119. PRECISION SPINE, INC.: KEY STRATERGIES
    TABLE 120. STRYKER CORPORATION: KEY EXECUTIVES
    TABLE 121. STRYKER CORPORATION: COMPANY SNAPSHOT
    TABLE 122. STRYKER CORPORATION: PRODUCT SEGMENTS
    TABLE 123. STRYKER CORPORATION: PRODUCT PORTFOLIO
    TABLE 124. ZIMMER BIOMET HOLDING INC.: KEY EXECUTIVES
    TABLE 125. ZIMMER BIOMET HOLDING INC.: COMPANY SNAPSHOT
    TABLE 126. ZIMMER BIOMET HOLDING INC.: PRODUCT SEGMENTS
    TABLE 127. ZIMMER BIOMET HOLDING INC.: PRODUCT PORTFOLIO
    TABLE 128. MEDTRONIC PLC: KEY EXECUTIVES
    TABLE 129. MEDTRONIC PLC: COMPANY SNAPSHOT
    TABLE 130. MEDTRONIC PLC: PRODUCT SEGMENTS
    TABLE 131. MEDTRONIC PLC: PRODUCT PORTFOLIO
    TABLE 132. MEDTRONIC PLC: KEY STRATERGIES
    TABLE 133. SMITH & NEPHEW PLC: KEY EXECUTIVES
    TABLE 134. SMITH & NEPHEW PLC: COMPANY SNAPSHOT
    TABLE 135. SMITH & NEPHEW PLC: PRODUCT SEGMENTS
    TABLE 136. SMITH & NEPHEW PLC: PRODUCT PORTFOLIO
  • LIST OF FIGURES

  • FIGURE 01. OSTEOSYNTHESIS DEVICES MARKET, 2021-2031
    FIGURE 02. SEGMENTATION OF OSTEOSYNTHESIS DEVICES MARKET, 2021-2031
    FIGURE 03. TOP INVESTMENT POCKETS IN OSTEOSYNTHESIS DEVICES MARKET (2022-2031)
    FIGURE 04. LOW BARGAINING POWER OF SUPPLIERS
    FIGURE 05. LOW BARGAINING POWER OF BUYERS
    FIGURE 06. LOW THREAT OF SUBSTITUTES
    FIGURE 07. LOW THREAT OF NEW ENTRANTS
    FIGURE 08. LOW INTENSITY OF RIVALRY
    FIGURE 09. DRIVERS, RESTRAINTS AND OPPORTUNITIES: GLOBALOSTEOSYNTHESIS DEVICES MARKET
    FIGURE 10. OSTEOSYNTHESIS DEVICES MARKET, BY DEVICE TYPE, 2021(%)
    FIGURE 11. COMPARATIVE SHARE ANALYSIS OF OSTEOSYNTHESIS DEVICES MARKET FOR INTERNAL FIXATION DEVICES, BY COUNTRY 2021-2031(%)
    FIGURE 12. COMPARATIVE SHARE ANALYSIS OF OSTEOSYNTHESIS DEVICES MARKET FOR EXTERNAL FIXATION DEVICES, BY COUNTRY 2021-2031(%)
    FIGURE 13. OSTEOSYNTHESIS DEVICES MARKET, BY FRACTURE TYPE, 2021(%)
    FIGURE 14. COMPARATIVE SHARE ANALYSIS OF OSTEOSYNTHESIS DEVICES MARKET FOR HIP FRACTURE, BY COUNTRY 2021-2031(%)
    FIGURE 15. COMPARATIVE SHARE ANALYSIS OF OSTEOSYNTHESIS DEVICES MARKET FOR KNEE FRACTURE, BY COUNTRY 2021-2031(%)
    FIGURE 16. COMPARATIVE SHARE ANALYSIS OF OSTEOSYNTHESIS DEVICES MARKET FOR SPINE FRACTURE, BY COUNTRY 2021-2031(%)
    FIGURE 17. COMPARATIVE SHARE ANALYSIS OF OSTEOSYNTHESIS DEVICES MARKET FOR SHOULDER FRACTURE, BY COUNTRY 2021-2031(%)
    FIGURE 18. COMPARATIVE SHARE ANALYSIS OF OSTEOSYNTHESIS DEVICES MARKET FOR FOOT AND ANKLE FRACTURE, BY COUNTRY 2021-2031(%)
    FIGURE 19. COMPARATIVE SHARE ANALYSIS OF OSTEOSYNTHESIS DEVICES MARKET FOR FACIAL BONES FRACTURE, BY COUNTRY 2021-2031(%)
    FIGURE 20. COMPARATIVE SHARE ANALYSIS OF OSTEOSYNTHESIS DEVICES MARKET FOR OTHERS, BY COUNTRY 2021-2031(%)
    FIGURE 21. OSTEOSYNTHESIS DEVICES MARKET, BY END USER, 2021(%)
    FIGURE 22. COMPARATIVE SHARE ANALYSIS OF OSTEOSYNTHESIS DEVICES MARKET FOR HOSPITALS, BY COUNTRY 2021-2031(%)
    FIGURE 23. COMPARATIVE SHARE ANALYSIS OF OSTEOSYNTHESIS DEVICES MARKET FOR ORTHOPAEDIC CLINICS, BY COUNTRY 2021-2031(%)
    FIGURE 24. COMPARATIVE SHARE ANALYSIS OF OSTEOSYNTHESIS DEVICES MARKET FOR AMBULATORY SURGICAL CENTERS, BY COUNTRY 2021-2031(%)
    FIGURE 25. OSTEOSYNTHESIS DEVICES MARKET BY REGION, 2021
    FIGURE 26. U.S. OSTEOSYNTHESIS DEVICES MARKET, 2021-2031 ($MILLION)
    FIGURE 27. CANADA OSTEOSYNTHESIS DEVICES MARKET, 2021-2031 ($MILLION)
    FIGURE 28. MEXICO OSTEOSYNTHESIS DEVICES MARKET, 2021-2031 ($MILLION)
    FIGURE 29. GERMANY OSTEOSYNTHESIS DEVICES MARKET, 2021-2031 ($MILLION)
    FIGURE 30. FRANCE OSTEOSYNTHESIS DEVICES MARKET, 2021-2031 ($MILLION)
    FIGURE 31. UK OSTEOSYNTHESIS DEVICES MARKET, 2021-2031 ($MILLION)
    FIGURE 32. ITALY OSTEOSYNTHESIS DEVICES MARKET, 2021-2031 ($MILLION)
    FIGURE 33. SPAIN OSTEOSYNTHESIS DEVICES MARKET, 2021-2031 ($MILLION)
    FIGURE 34. REST OF EUROPE OSTEOSYNTHESIS DEVICES MARKET, 2021-2031 ($MILLION)
    FIGURE 35. JAPAN OSTEOSYNTHESIS DEVICES MARKET, 2021-2031 ($MILLION)
    FIGURE 36. CHINA OSTEOSYNTHESIS DEVICES MARKET, 2021-2031 ($MILLION)
    FIGURE 37. AUSTRALIA OSTEOSYNTHESIS DEVICES MARKET, 2021-2031 ($MILLION)
    FIGURE 38. INDIA OSTEOSYNTHESIS DEVICES MARKET, 2021-2031 ($MILLION)
    FIGURE 39. SOUTH KOREA OSTEOSYNTHESIS DEVICES MARKET, 2021-2031 ($MILLION)
    FIGURE 40. REST OF ASIA-PACIFIC OSTEOSYNTHESIS DEVICES MARKET, 2021-2031 ($MILLION)
    FIGURE 41. BRAZIL OSTEOSYNTHESIS DEVICES MARKET, 2021-2031 ($MILLION)
    FIGURE 42. SAUDI ARABIA OSTEOSYNTHESIS DEVICES MARKET, 2021-2031 ($MILLION)
    FIGURE 43. SOUTH AFRICA OSTEOSYNTHESIS DEVICES MARKET, 2021-2031 ($MILLION)
    FIGURE 44. REST OF LAMEA OSTEOSYNTHESIS DEVICES MARKET, 2021-2031 ($MILLION)
    FIGURE 45. TOP WINNING STRATEGIES, BY YEAR
    FIGURE 46. TOP WINNING STRATEGIES, BY DEVELOPMENT
    FIGURE 47. TOP WINNING STRATEGIES, BY COMPANY
    FIGURE 48. PRODUCT MAPPING OF TOP 10 PLAYERS
    FIGURE 49. COMPETITIVE DASHBOARD
    FIGURE 50. COMPETITIVE HEATMAP: OSTEOSYNTHESIS DEVICES MARKET
    FIGURE 51. TOP PLAYER POSITIONING, 2021
    FIGURE 52. GLOBUS MEDICAL, INC.: NET SALES, 2019-2021 ($MILLION)
    FIGURE 53. GLOBUS MEDICAL, INC.: REVENUE SHARE BY SEGMENT, 2021 (%)
    FIGURE 54. GLOBUS MEDICAL, INC.: REVENUE SHARE BY REGION, 2021 (%)
    FIGURE 55. JOHNSON & JOHNSON: NET REVENUE, 2019-2021 ($MILLION)
    FIGURE 56. JOHNSON & JOHNSON: REVENUE SHARE BY SEGMENT, 2021 (%)
    FIGURE 57. JOHNSON & JOHNSON: REVENUE SHARE BY REGION, 2021 (%)
    FIGURE 58. STRYKER CORPORATION: NET REVENUE, 2019-2021 ($MILLION)
    FIGURE 59. STRYKER CORPORATION: REVENUE SHARE BY SEGMENT, 2021 (%)
    FIGURE 60. STRYKER CORPORATION: REVENUE SHARE BY REGION, 2021 (%)
    FIGURE 61. ZIMMER BIOMET HOLDING INC.: NET SALES, 2019-2021 ($MILLION)
    FIGURE 62. ZIMMER BIOMET HOLDING INC.: REVENUE SHARE BY REGION, 2021 (%)
    FIGURE 63. ZIMMER BIOMET HOLDING INC.: REVENUE SHARE BY SEGMENT, 2021 (%)
    FIGURE 64. MEDTRONIC PLC: NET SALES, 2020-2022 ($MILLION)
    FIGURE 65. MEDTRONIC PLC: REVENUE SHARE BY SEGMENT, 2022 (%)
    FIGURE 66. MEDTRONIC PLC: REVENUE SHARE BY REGION, 2022 (%)
    FIGURE 67. SMITH & NEPHEW PLC: NET REVENUE, 2019-2021 ($MILLION)
    FIGURE 68. SMITH & NEPHEW PLC: REVENUE SHARE BY SEGMENT, 2021 (%)
    FIGURE 69. SMITH & NEPHEW PLC: REVENUE SHARE BY REGION, 2021 (%)


This section provides opinions of top-level CXOs in the osteosynthesis devices market. The osteosynthesis devices market has witnessed growth, owing to an increase in the prevalence of osteoporosis and osteoarthritis, an increase in orthopedic injuries, and the launch of osteosynthesis devices. 

According to the perspectives of CXOs, the global osteosynthesis devices market is expected to witness steady growth in the future. The rise in the prevalence of orthopedic disorders, a rise in cases of accidents & sports injuries, rise in awareness regarding the potential benefits of orthopedic implants have led to an increase in demand for osteosynthesis devices and boosted the growth of the market. Furthermore, the surge in the geriatric population who are susceptible to falls that cause fractures drives the growth of the osteosynthesis devices market. In addition, the increase in the preference of healthcare professionals for osteosynthesis devices, and the rise in acceptance of orthopedic implants, drive the growth of the osteosynthesis devices market.  

North America is expected to witness the highest growth, in terms of revenue, owing to an increase in cases of orthopedic injuries, robust healthcare infrastructure, presence of key players, and rise in healthcare expenditure. However, Asia-Pacific is anticipated to witness notable growth, owing to an increase in the use of osteosynthesis devices to treat bone fracture, unmet medical demands, a high population base and an increase in public-private investments in the healthcare sector

PURCHASE OPTIONS

Call or Email us

U.S.-Canada Toll-free: +1-800-792-5285
Int'l : +1-503-894-6022
Europe : +44-845-528-1300
Email : help@alliedmarketresearch.com
 
FREQUENTLY ASKED QUESTIONS?

A. The Upcoming trends are the rise in technological advancement in osteosynthesis devices, rise in the prevalence of orthopedic disorders such as osteoarthritis and osteoporosis that are more prone to fracture, as well a rise in the awareness of potential benefits of orthopedic implants drives the growth of the osteosynthesis devices market.

A. The total market value of the Osteosynthesis Devices is $14,214.92 Million in 2031

A. North America is the largest regional market for Osteosynthesis Devices

A. There are 10 Osteosynthesis Devices Market companies are profiled in the report

A. Arthrex, Inc., Johnson & Johnson (DePuy Synthes, Inc.), Globus Medical, Inc., GS Solutions, Inc., Life Spine, Inc., Medtronic plc are the top companies to hold the market share in Osteosynthesis Devices Market.

A. The forecast period in the report is from 2022 to 2031

A. The base year for the Osteosynthesis Devices Market report is 2021

A. Yes, the Osteosynthesis Devices Market report includes competitive landscape

Looking for Customization?

 Customization Request

Have a Question?

 Speak with Analyst

Any Confusion?

 Inquire Before Buying

Have a glance of the Report

  Request Sample
RELATED TAGS

Purchase Full Report of
Osteosynthesis Devices Market

Start reading instantly.
This Report and over 66,905+ more Reports, Available with Avenue Library. T&C*.

  • Online Only
  • $3,570
  • Online cloud access only
  • Restricted print, copy, paste & download
  • Read only
  • Free industry update
    (Within 180 days)
  • Free report update in next update cycle
    (Feb 2024 - Feb 2025)
  • Data Pack
  • $3,840
  • Restricted to one authorized user
  • One print only
  • Available in
    Excel
  • Free industry update
    (Within 180 days)
  •   Free report update in next update cycle
    (Feb 2024 - Feb 2025)
  • Single User
  • $5,730
  • Restricted to one authorized user
  • One print only
  • Available in
    PDF
  • Free industry update
    (Within 180 days)
  •   Free report update in next update cycle
    (Feb 2024 - Feb 2025)
  • Five Users
  • $6,450
  • Limited to five authorized users
  • Print upto five copies
  • Available in
    PDF
  • Free industry update
    (Within 180 days)
  •   Free report update in next update cycle
    (Feb 2024 - Feb 2025)
  • Enterprise
    License/PDF

  • $9,600
  • Unlimited
    within
    company/enterprise
  • Available in Excel & PDF
  • Free industry update
    (Within 180 days)
  •   Free report update in next update cycle
    (Feb 2024 - Feb 2025)
  • Library
    Membership

  • $999 $ 1,175
    Per User/ Per month/ Billed annually
  • Published Content
    E-access
  • Company Profiles
    E-access
  • Newly Added Content Access
  • 10 PDF
    Downloads
  • 5 Excel Data
    Pack Downloads
  • 250 Company Profiles PDF Downloads
  • Buy Now

*Taxes/Fees, if applicable will be added during checkout. All prices in USD

RELATED REPORTS
 

Why Allied Market Research?


Infallible Methodology

To ensure high-level data integrity, accurate analysis, and impeccable forecasts

Analyst Support

For complete satisfaction

Customization

On-demand customization of scope of the report to exactly meet your needs

TARGETED MARKET VIEW

Targeted market view to provide pertinent information and save time of readers

Get fresh content delivered

Get insights on topics that are crucial for your business. Stay abreast of your interest areas.

Get Industry Data Alerts

Why Allied Market Research?

Infallible Methodology

To ensure high-level data integrity, accurate analysis, and impeccable forecasts

Analyst Support

For complete satisfaction

Customization

On-demand customization of scope of the report to exactly meet your needs

TARGETED MARKET VIEW

Targeted market view to provide pertinent information and save time of readers