0
New
New
2023
Packaging Resins Market

Packaging Resins Market

by Type (Low Density Polyethylene (LDPE), Polypropylene (PP), High Density Polyethylene (HDPE), Polystyrene (PS), Others), by Application (Food and Beverage, Consumer Goods, Healthcare, Others): Global Opportunity Analysis and Industry Forecast, 2023-2032

Report Code: A07010
Aug 2023 | Pages: 312
Tables: 169
Charts: 76
  • Formats*:

  • pdf

    Single User License, Five User
    License & Enterprise User License

  • xls

    Data Pack Excel License

  • ppt

    It comes with the additional cost
    of $2500.00 contact sales.


Packaging Resins Market Research, 2032

The global packaging resins market size was valued at $288.9 billion in 2022, and is projected to reach $587.3 billion by 2032, growing at a CAGR of 7.4% from 2023 to 2032.

Report Key Highlighters:

  • The packaging resins market study covers 20 countries. The research includes a segment analysis of each country in terms of both value ($million) and volume (kilotons) for the projected period 2023-2032.
  • The study integrated high-quality data, professional opinions and analysis, and critical independent perspectives. The research approach is intended to provide a balanced view of global markets and to assist stakeholders in making educated decisions in order to achieve their most ambitious growth objectives.
  • Over 3,700 product literature, annual reports, industry statements, and other comparable materials from major industry participants were reviewed to gain a better understanding of the market.
  • The packaging resins market share is highly fragmented, with several players including BASF SE, Borealis AG, Braskem, China Petrochemical Corporation, Mitsubishi Chemical Corporation, Exxon Mobil Corporation, INEOS, LyondellBasell Industries Holdings B.V., Reliance Industries Limited, and SABIC. Also tracked key strategies such as acquisitions, product launches, mergers, expansion etc. of the players operating in the packaging resins market.
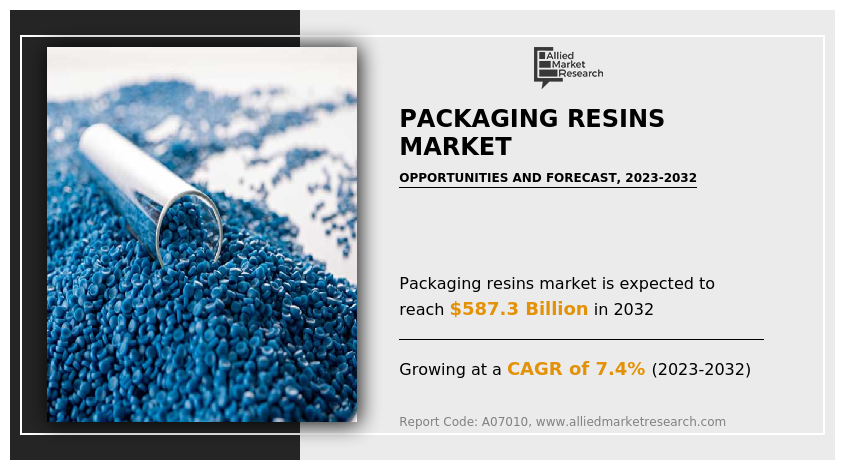
The packaging resin industry is experiencing significant trends driven by a growing emphasis on environmental sustainability and the imperative to decrease plastic waste. This is leading to a notable shift towards the adoption of eco-friendly and biodegradable packaging alternatives.

Packaging Resins Market

Packaging resin performs a pivotal position in various industries, serving as a fundamental factor in the introduction of numerous packaging materials. Packaging resin encompasses a wide array of polymers that contribute to the manufacturing of packaging options used globally. These resins are chosen for their versatility, durability, and potential to meet the various desires of distinct industries.

Packaging resin refers to a polymer fabric that can be molded, extruded, or solid into a number of shapes and varieties to create packaging products such as bottles, containers, films, and more. These resins are characterized by using their chemical composition, molecular structure, and bodily properties, which are cautiously engineered to go well with the necessities of specific applications.

Packaging resin finds extensive use throughout numerous industries due to its versatile applications. In food and beverage, packaging resins play an imperative function in producing meal containers, beverage bottles, and bendy packaging films. Packaging resins have varying ranges of barrier residences towards moisture, gases, and other exterior factors. This is in particular necessary when packaging products that are sensitive to these factors.
The pharmaceutical industry heavily depends on packaging resins to shield medicines and medical devices. Resins with high chemical resistance and low reactivity are preferred in this sector, as they stop interactions between the packaging material and the contents, keeping the efficacy of the pharmaceutical products. Moreover, packaging resins are instrumental in the cosmetics and non-public care industry, enabling the introduction of attractive and purposeful packaging for quite a number beauty products.

Packaging resins find utility in the manufacturing of defensive casings for electronic devices. These resins often possess heat-resistant and insulating properties, safeguarding subtle electronic factors from exterior elements that ought to compromise their functionality. The car enterprise also advantages from packaging resins, the usage of them to craft durable and lightweight substances for vehicle interiors, exteriors, and components.
Packaging resin has evolved to tackle the want by using offering biodegradable and compostable selections that decrease the environmental influence of packaging materials. These sustainable resins are used in functions ranging from meals packaging to single-use items, decreasing the accumulation of plastic waste in landfills and oceans.

The purposes of biodegradable and compostable packaging resins are diverse, spanning various industries. For instance, these resins are used for packaging perishable goods such as fruits, vegetables, and prepared foods in the food industry. Since food packaging regularly ends up as waste, the use of biodegradable and compostable materials reduces the environmental effect and contributes to a greater sustainable food supply chain.

A surge in demand for packaged goods across various industries drives the packaging resins market growth.

The packaging resin industry is swiftly expanding due to its usage throughout various sectors like food, beverages, and purchaser goods. Packaging resin furnishes quite a number of benefits, leading to massive use. The food and beverage area is a key driver, requiring efficient packaging for perishable items and liquids. Packaging resins extend shelf life, preserve quality, and prevent contamination. In April 2022, Mondi unveiled new food packaging at Anuga FoodTec, Cologne. The use of advanced polypropylene improves food protection, reduces waste, and maintains fantastic in the grant chain, highlighting the imperative function of packaging in retaining food and decreasing waste.

Emerging trends in sustainable packaging materials propel the growth of packaging resins market.

The rise of eco-friendly packaging materials, in particular packaging resins, is a significant trend for sustainable packaging. Packaging resins are used in making objects like plastic bottles and containers. Traditional resins from fossil fuels damage the environment, whilst eco-friendly ones are biodegradable, compostable, or made from renewable sources like corn starch. Bioplastics, derived from sources such as sugarcane, can substitute common plastics with a decreased environmental impact. Regulations against single-use plastics and client demand for sustainable products force this shift. Companies are actively in search of alternatives. Innovations like plant-based materials are helping manufacturers limit their impact. Ardagh Metal Packaging's new facility in France expands eco-friendly packaging production, supported by way of Sud Attractivité and Bpifrance.

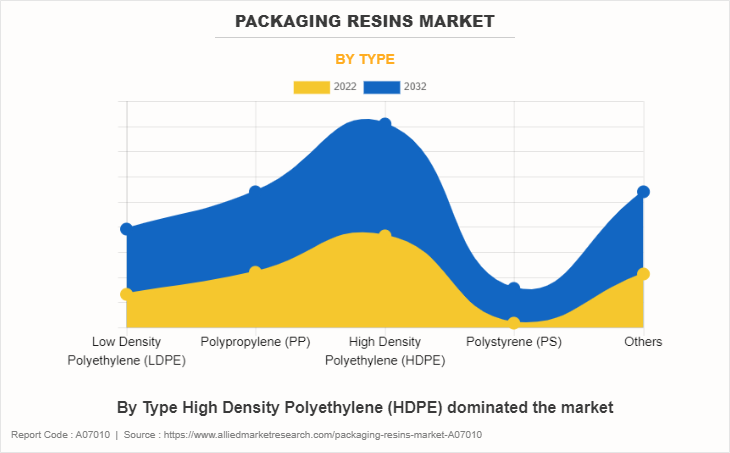
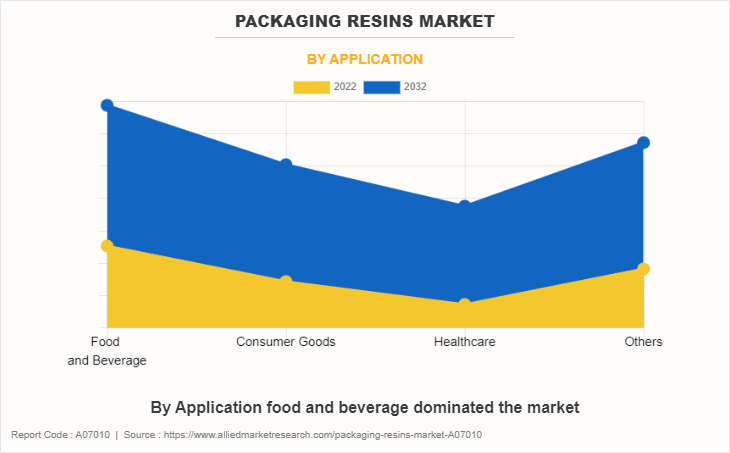
The packaging resins market is segmented into type, application, and region. On the basis of type, the market is classified into low-density polyethylene (LDPE), polypropylene (PP), high-density polyethylene (HDPE), polystyrene (PS), and others. On the basis of application, the market is divided into food and beverage, consumer goods, healthcare, and others. On the basis of region, the market is studied across North America, Europe, Asia-Pacific, and LAMEA.
Packaging Resins Market

HDPE is frequently used to produce bottles, containers, and caps for an extensive vary of products such as beverages, cleansing products, personal care items, and more. Its durability and chemical resistance make it appropriate for storing a range of types of beverages and substances. HDPE is used to create pallets, crates, and different varieties of inflexible packaging. Its sturdy nature and resistance to impact make it ideal for transporting and storing items securely. HDPE has super resistance to a vast variety of chemicals, acids, and bases. This makes it a perfect choice for packaging products that may also come into contact with quite a number of substances.
Packaging Resins Market

Packaging resins help defend food and beverages from exterior elements such as moisture, oxygen, and light, which can lead to spoilage and degradation. This upkeep extends the shelf existence of products, lowering food waste and ensuring that customers acquire fresh and high-quality products. Since polypropylene can stand up to high temperatures, it can be used to package warm ingredients such as soups and ready-to-eat foods as well as food containers that can be microwaved. The packaging can withstand the strain of both microwave heating and transit due to the fact to its resilience.
Packaging Resins Market

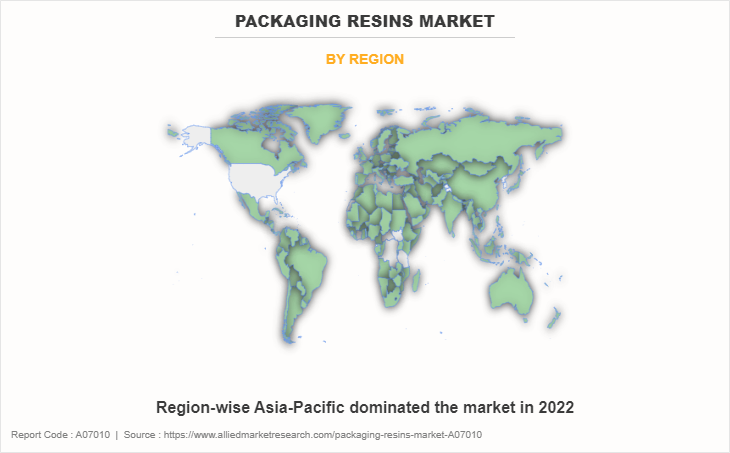
The Asia-Pacific region has seen a super surge in the use of packaging resin, an essential ingredient in growing a number of products like bottles, containers, and films. This growth can be attributed to urbanization, greater incomes, evolving customer choices, and increased industrial activity. In response to the demand for eco-friendly packaging, many countries in the place are focusing on looking for biodegradable materials, recycling techniques, and circular financial system concepts. Regulatory actions and industry-led efforts are being applied to reduce single-use plastics and encourage accountable application of packaging resin.

Historical Trends

  • In 1800s, natural materials such as glass, wood, and steel were frequently used for packaging. Glass containers have been used for storing a range of products, wood was used for crates and boxes, and metal was employed for cans and containers.
  • 1950s, the development of quite a number plastics, together with polyethylene (PE), polypropylene (PP), and polyethylene terephthalate (PET), paved the way for artificial polymer-based packaging resins. HDPE grew to be extensively used for packaging containers, bottles, and other merchandise due to its sturdiness and chemical resistance.
  • The 1990s noticed the expansion of recycling packages in many regions. Governments, municipalities, and groups started imposing curbside recycling applications to encourage the separation and series of recyclable materials, inclusive of packaging.
  • In the 2010s, the improvement of smart packaging with aspects such as monitoring freshness and temperature monitoring revolutionized the way merchandise is saved and transported, ensuring better great and safety for consumers. Smart packaging options have been designed to reveal the freshness of perishable gadgets such as food and pharmaceuticals. Sensors may want to become aware of adjustments in fuel concentrations, temperature, and humidity, offering real-time statistics to buyers and suppliers.
  • In 2021, the packaging industry was influenced by a number of factors, along with sustainability concerns, developments in material science, and altering consumer preferences. Many companies have been focusing on developing extra environmentally friendly packaging solutions, along with biodegradable and recyclable resins. Increasing customer awareness about the environmental influence of packaging resin led to higher demand for sustainable alternatives, encouraging further research and innovation in this field.

Key Benefits For Stakeholders

  • This report provides a quantitative analysis of the market segments, current trends, estimations, and dynamics of the packaging resins market analysis from 2022 to 2032 to identify the prevailing packaging resins market opportunities.
  • The market research is offered along with information related to key drivers, restraints, and opportunities.
  • Porter's five forces analysis highlights the potency of buyers and suppliers to enable stakeholders to make profit-oriented business decisions and strengthen their supplier-buyer network.
  • In-depth analysis of the packaging resins market forecast to determine the prevailing market opportunities.
  • Major countries in each region are mapped according to their revenue contribution to the global market.
  • Market player positioning facilitates benchmarking and provides a clear understanding of the present position of the market players.
  • The report includes the analysis of the regional as well as global packaging resins market trend, key players, market segments, application areas, and market growth strategies.

Packaging Resins Market Report Highlights

Aspects Details
Market Size By 2032 USD 587.3 billion
Growth Rate CAGR of 7.4%
Forecast period 2022 - 2032
Report Pages 312
By Application
  • Food and Beverage
  • Consumer Goods
  • Healthcare
  • Others
By Type
  • Low Density Polyethylene (LDPE)
  • Polypropylene (PP)
  • High Density Polyethylene (HDPE)
  • Polystyrene (PS)
  • Others
By Region
  • North America  (U.S., Canada, Mexico)
  • Europe  (Germany, France, UK, Spain, Italy, Rest of Europe)
  • Asia-Pacific  (China, Japan, India, South Korea, Australia, Rest of Asia-Pacific)
  • LAMEA  (Brazil, South Africa, Saudi Arabia, Rest of LAMEA)
Key Market Players Borealis AG., BASF SE, China Petrochemical Corporation, INEOS, Reliance Industries Limited, SABIC, Mitsubishi Chemical Corporation, Exxon Mobil Corporation, Braskem, LyondellBasell Industries Holdings B.V.

Analyst Review

According to the opinions of various CXOs of leading companies, the packaging resin market is driven by rise in demand for high-density polyethylene (HDPE). HDPE has excellent resistance to chemicals, making it suitable for use in environments where exposure to harsh chemicals is a concern. has good impact strength and can withstand exposure to ultraviolet (UV) rays, making it suitable for outdoor applications such as playground equipment, outdoor furniture, and pipes.

Technological advancements in resin manufacturing drive the growth of the packaging resin market. Packaging solutions extensively utilize resins as the foundational material for producing various packaging items such as containers, bottles, films, and more. Advanced polymerization processes have transformed resin production, boosting quality, efficiency, and versatility. Resin Design specializes in technology for manufacturing LEDs, optical displays, image sensors, and more. Resin 3D printing is gaining traction in fields such as medicine, dentistry, and jewelry due to resin technology advancements. Epoxy chemistry advancements, particularly responding to regulations and user expectations, have greatly improved industrial maintenance coatings.

Fluctuating raw material prices of packaging resin is expected to hinder the growth of the packaging resin market. Fluctuating raw material prices have a notable influence on the entire value chain, especially for packaging resin producers. Striking a balance between cost management and competitive pricing is crucial for them. When prices rise, sustaining profit margins becomes difficult, impacting overall competitiveness. For instance, the cost of polypropylene resin surged from 13.5 to 96.5 cents per pound in January 2021 due to shortages and import slowdowns, leading to 30% increase in the producer price index (PPI) for resin and raw materials in Q1 2021. However, prices of polyethylene and polypropylene declined in July 2022.

The Asia-Pacific region is projected to register robust growth during the forecast period. China's packaging industry has also been influenced by sustainability concerns. As environmental awareness grows, there is increasing interest in developing and using more eco-friendly packaging solutions. This has led to efforts to reduce plastic waste and promote the use of recyclable materials in packaging.

 
  • CHAPTER 1: INTRODUCTION

    • 1.1. Report description

    • 1.2. Key market segments

    • 1.3. Key benefits to the stakeholders

    • 1.4. Research Methodology

      • 1.4.1. Primary research

      • 1.4.2. Secondary research

      • 1.4.3. Analyst tools and models

  • CHAPTER 2: EXECUTIVE SUMMARY

    • 2.1. CXO Perspective

  • CHAPTER 3: MARKET OVERVIEW

    • 3.1. Market definition and scope

    • 3.2. Key findings

      • 3.2.1. Top impacting factors

      • 3.2.2. Top investment pockets

    • 3.3. Porter’s five forces analysis

      • 3.3.1. Moderate bargaining power of suppliers

      • 3.3.2. Moderate threat of new entrants

      • 3.3.3. High threat of substitutes

      • 3.3.4. Moderate intensity of rivalry

      • 3.3.5. Moderate bargaining power of buyers

    • 3.4. Market dynamics

      • 3.4.1. Drivers

        • 3.4.1.1. Increase in demand for packaged goods across various sectors
        • 3.4.1.2. Technological advancements in resin manufacturing

      • 3.4.2. Restraints

        • 3.4.2.1. Fluctuating raw material prices of packaging resin

      • 3.4.3. Opportunities

        • 3.4.3.1. Growth in eco-friendly packaging materials

    • 3.5. COVID-19 Impact Analysis on the market

    • 3.6. Value Chain Analysis

    • 3.7. Key Regulation Analysis

    • 3.8. Patent Landscape

    • 3.9. Pricing Analysis

  • CHAPTER 4: PACKAGING RESINS MARKET, BY TYPE

    • 4.1. Overview

      • 4.1.1. Market size and forecast

    • 4.2. Low Density Polyethylene (LDPE)

      • 4.2.1. Key market trends, growth factors and opportunities

      • 4.2.2. Market size and forecast, by region

      • 4.2.3. Market share analysis by country

    • 4.3. Polypropylene (PP)

      • 4.3.1. Key market trends, growth factors and opportunities

      • 4.3.2. Market size and forecast, by region

      • 4.3.3. Market share analysis by country

    • 4.4. High Density Polyethylene (HDPE)

      • 4.4.1. Key market trends, growth factors and opportunities

      • 4.4.2. Market size and forecast, by region

      • 4.4.3. Market share analysis by country

    • 4.5. Polystyrene (PS)

      • 4.5.1. Key market trends, growth factors and opportunities

      • 4.5.2. Market size and forecast, by region

      • 4.5.3. Market share analysis by country

    • 4.6. Others

      • 4.6.1. Key market trends, growth factors and opportunities

      • 4.6.2. Market size and forecast, by region

      • 4.6.3. Market share analysis by country

  • CHAPTER 5: PACKAGING RESINS MARKET, BY APPLICATION

    • 5.1. Overview

      • 5.1.1. Market size and forecast

    • 5.2. Food and Beverage

      • 5.2.1. Key market trends, growth factors and opportunities

      • 5.2.2. Market size and forecast, by region

      • 5.2.3. Market share analysis by country

    • 5.3. Consumer Goods

      • 5.3.1. Key market trends, growth factors and opportunities

      • 5.3.2. Market size and forecast, by region

      • 5.3.3. Market share analysis by country

    • 5.4. Healthcare

      • 5.4.1. Key market trends, growth factors and opportunities

      • 5.4.2. Market size and forecast, by region

      • 5.4.3. Market share analysis by country

    • 5.5. Others

      • 5.5.1. Key market trends, growth factors and opportunities

      • 5.5.2. Market size and forecast, by region

      • 5.5.3. Market share analysis by country

  • CHAPTER 6: PACKAGING RESINS MARKET, BY REGION

    • 6.1. Overview

      • 6.1.1. Market size and forecast By Region

    • 6.2. North America

      • 6.2.1. Key market trends, growth factors and opportunities

      • 6.2.2. Market size and forecast, by Type

      • 6.2.3. Market size and forecast, by Application

      • 6.2.4. Market size and forecast, by country

        • 6.2.4.1. U.S.
          • 6.2.4.1.1. Market size and forecast, by Type
          • 6.2.4.1.2. Market size and forecast, by Application
        • 6.2.4.2. Canada
          • 6.2.4.2.1. Market size and forecast, by Type
          • 6.2.4.2.2. Market size and forecast, by Application
        • 6.2.4.3. Mexico
          • 6.2.4.3.1. Market size and forecast, by Type
          • 6.2.4.3.2. Market size and forecast, by Application
    • 6.3. Europe

      • 6.3.1. Key market trends, growth factors and opportunities

      • 6.3.2. Market size and forecast, by Type

      • 6.3.3. Market size and forecast, by Application

      • 6.3.4. Market size and forecast, by country

        • 6.3.4.1. Germany
          • 6.3.4.1.1. Market size and forecast, by Type
          • 6.3.4.1.2. Market size and forecast, by Application
        • 6.3.4.2. France
          • 6.3.4.2.1. Market size and forecast, by Type
          • 6.3.4.2.2. Market size and forecast, by Application
        • 6.3.4.3. UK
          • 6.3.4.3.1. Market size and forecast, by Type
          • 6.3.4.3.2. Market size and forecast, by Application
        • 6.3.4.4. Spain
          • 6.3.4.4.1. Market size and forecast, by Type
          • 6.3.4.4.2. Market size and forecast, by Application
        • 6.3.4.5. Italy
          • 6.3.4.5.1. Market size and forecast, by Type
          • 6.3.4.5.2. Market size and forecast, by Application
        • 6.3.4.6. Rest of Europe
          • 6.3.4.6.1. Market size and forecast, by Type
          • 6.3.4.6.2. Market size and forecast, by Application
    • 6.4. Asia-Pacific

      • 6.4.1. Key market trends, growth factors and opportunities

      • 6.4.2. Market size and forecast, by Type

      • 6.4.3. Market size and forecast, by Application

      • 6.4.4. Market size and forecast, by country

        • 6.4.4.1. China
          • 6.4.4.1.1. Market size and forecast, by Type
          • 6.4.4.1.2. Market size and forecast, by Application
        • 6.4.4.2. Japan
          • 6.4.4.2.1. Market size and forecast, by Type
          • 6.4.4.2.2. Market size and forecast, by Application
        • 6.4.4.3. India
          • 6.4.4.3.1. Market size and forecast, by Type
          • 6.4.4.3.2. Market size and forecast, by Application
        • 6.4.4.4. South Korea
          • 6.4.4.4.1. Market size and forecast, by Type
          • 6.4.4.4.2. Market size and forecast, by Application
        • 6.4.4.5. Australia
          • 6.4.4.5.1. Market size and forecast, by Type
          • 6.4.4.5.2. Market size and forecast, by Application
        • 6.4.4.6. Rest of Asia-Pacific
          • 6.4.4.6.1. Market size and forecast, by Type
          • 6.4.4.6.2. Market size and forecast, by Application
    • 6.5. LAMEA

      • 6.5.1. Key market trends, growth factors and opportunities

      • 6.5.2. Market size and forecast, by Type

      • 6.5.3. Market size and forecast, by Application

      • 6.5.4. Market size and forecast, by country

        • 6.5.4.1. Brazil
          • 6.5.4.1.1. Market size and forecast, by Type
          • 6.5.4.1.2. Market size and forecast, by Application
        • 6.5.4.2. South Africa
          • 6.5.4.2.1. Market size and forecast, by Type
          • 6.5.4.2.2. Market size and forecast, by Application
        • 6.5.4.3. Saudi Arabia
          • 6.5.4.3.1. Market size and forecast, by Type
          • 6.5.4.3.2. Market size and forecast, by Application
        • 6.5.4.4. Rest of LAMEA
          • 6.5.4.4.1. Market size and forecast, by Type
          • 6.5.4.4.2. Market size and forecast, by Application
  • CHAPTER 7: COMPETITIVE LANDSCAPE

    • 7.1. Introduction

    • 7.2. Top winning strategies

    • 7.3. Product Mapping of Top 10 Player

    • 7.4. Competitive Dashboard

    • 7.5. Competitive Heatmap

    • 7.6. Top player positioning, 2022

  • CHAPTER 8: COMPANY PROFILES

    • 8.1. SABIC

      • 8.1.1. Company overview

      • 8.1.2. Key Executives

      • 8.1.3. Company snapshot

      • 8.1.4. Operating business segments

      • 8.1.5. Product portfolio

      • 8.1.6. Business performance

      • 8.1.7. Key strategic moves and developments

    • 8.2. BASF SE

      • 8.2.1. Company overview

      • 8.2.2. Key Executives

      • 8.2.3. Company snapshot

      • 8.2.4. Operating business segments

      • 8.2.5. Product portfolio

      • 8.2.6. Business performance

    • 8.3. Borealis AG.

      • 8.3.1. Company overview

      • 8.3.2. Key Executives

      • 8.3.3. Company snapshot

      • 8.3.4. Operating business segments

      • 8.3.5. Product portfolio

    • 8.4. Braskem

      • 8.4.1. Company overview

      • 8.4.2. Key Executives

      • 8.4.3. Company snapshot

      • 8.4.4. Operating business segments

      • 8.4.5. Product portfolio

      • 8.4.6. Business performance

      • 8.4.7. Key strategic moves and developments

    • 8.5. China Petrochemical Corporation

      • 8.5.1. Company overview

      • 8.5.2. Key Executives

      • 8.5.3. Company snapshot

      • 8.5.4. Operating business segments

      • 8.5.5. Product portfolio

    • 8.6. Exxon Mobil Corporation

      • 8.6.1. Company overview

      • 8.6.2. Key Executives

      • 8.6.3. Company snapshot

      • 8.6.4. Operating business segments

      • 8.6.5. Product portfolio

      • 8.6.6. Business performance

      • 8.6.7. Key strategic moves and developments

    • 8.7. INEOS

      • 8.7.1. Company overview

      • 8.7.2. Key Executives

      • 8.7.3. Company snapshot

      • 8.7.4. Operating business segments

      • 8.7.5. Product portfolio

      • 8.7.6. Business performance

    • 8.8. LyondellBasell Industries Holdings B.V.

      • 8.8.1. Company overview

      • 8.8.2. Key Executives

      • 8.8.3. Company snapshot

      • 8.8.4. Operating business segments

      • 8.8.5. Product portfolio

      • 8.8.6. Business performance

      • 8.8.7. Key strategic moves and developments

    • 8.9. Reliance Industries Limited

      • 8.9.1. Company overview

      • 8.9.2. Key Executives

      • 8.9.3. Company snapshot

      • 8.9.4. Operating business segments

      • 8.9.5. Product portfolio

      • 8.9.6. Business performance

    • 8.10. Mitsubishi Chemical Corporation

      • 8.10.1. Company overview

      • 8.10.2. Key Executives

      • 8.10.3. Company snapshot

      • 8.10.4. Operating business segments

      • 8.10.5. Product portfolio

      • 8.10.6. Business performance

      • 8.10.7. Key strategic moves and developments

  • LIST OF TABLES

  • TABLE 01. GLOBAL PACKAGING RESINS MARKET, BY TYPE, 2022-2032 ($MILLION)
    TABLE 02. GLOBAL PACKAGING RESINS MARKET, BY TYPE, 2022-2032 (KILOTON)
    TABLE 03. PACKAGING RESINS MARKET FOR LOW DENSITY POLYETHYLENE (LDPE), BY REGION, 2022-2032 ($MILLION)
    TABLE 04. PACKAGING RESINS MARKET FOR LOW DENSITY POLYETHYLENE (LDPE), BY REGION, 2022-2032 (KILOTON)
    TABLE 05. PACKAGING RESINS MARKET FOR POLYPROPYLENE (PP), BY REGION, 2022-2032 ($MILLION)
    TABLE 06. PACKAGING RESINS MARKET FOR POLYPROPYLENE (PP), BY REGION, 2022-2032 (KILOTON)
    TABLE 07. PACKAGING RESINS MARKET FOR HIGH DENSITY POLYETHYLENE (HDPE), BY REGION, 2022-2032 ($MILLION)
    TABLE 08. PACKAGING RESINS MARKET FOR HIGH DENSITY POLYETHYLENE (HDPE), BY REGION, 2022-2032 (KILOTON)
    TABLE 09. PACKAGING RESINS MARKET FOR POLYSTYRENE (PS), BY REGION, 2022-2032 ($MILLION)
    TABLE 10. PACKAGING RESINS MARKET FOR POLYSTYRENE (PS), BY REGION, 2022-2032 (KILOTON)
    TABLE 11. PACKAGING RESINS MARKET FOR OTHERS, BY REGION, 2022-2032 ($MILLION)
    TABLE 12. PACKAGING RESINS MARKET FOR OTHERS, BY REGION, 2022-2032 (KILOTON)
    TABLE 13. GLOBAL PACKAGING RESINS MARKET, BY APPLICATION, 2022-2032 ($MILLION)
    TABLE 14. GLOBAL PACKAGING RESINS MARKET, BY APPLICATION, 2022-2032 (KILOTON)
    TABLE 15. PACKAGING RESINS MARKET FOR FOOD AND BEVERAGE, BY REGION, 2022-2032 ($MILLION)
    TABLE 16. PACKAGING RESINS MARKET FOR FOOD AND BEVERAGE, BY REGION, 2022-2032 (KILOTON)
    TABLE 17. PACKAGING RESINS MARKET FOR CONSUMER GOODS, BY REGION, 2022-2032 ($MILLION)
    TABLE 18. PACKAGING RESINS MARKET FOR CONSUMER GOODS, BY REGION, 2022-2032 (KILOTON)
    TABLE 19. PACKAGING RESINS MARKET FOR HEALTHCARE, BY REGION, 2022-2032 ($MILLION)
    TABLE 20. PACKAGING RESINS MARKET FOR HEALTHCARE, BY REGION, 2022-2032 (KILOTON)
    TABLE 21. PACKAGING RESINS MARKET FOR OTHERS, BY REGION, 2022-2032 ($MILLION)
    TABLE 22. PACKAGING RESINS MARKET FOR OTHERS, BY REGION, 2022-2032 (KILOTON)
    TABLE 23. PACKAGING RESINS MARKET, BY REGION, 2022-2032 ($MILLION)
    TABLE 24. PACKAGING RESINS MARKET, BY REGION, 2022-2032 (KILOTON)
    TABLE 25. NORTH AMERICA PACKAGING RESINS MARKET, BY TYPE, 2022-2032 ($MILLION)
    TABLE 26. NORTH AMERICA PACKAGING RESINS MARKET, BY TYPE, 2022-2032 (KILOTON)
    TABLE 27. NORTH AMERICA PACKAGING RESINS MARKET, BY APPLICATION, 2022-2032 ($MILLION)
    TABLE 28. NORTH AMERICA PACKAGING RESINS MARKET, BY APPLICATION, 2022-2032 (KILOTON)
    TABLE 29. NORTH AMERICA PACKAGING RESINS MARKET, BY COUNTRY, 2022-2032 ($MILLION)
    TABLE 30. NORTH AMERICA PACKAGING RESINS MARKET, BY COUNTRY, 2022-2032 (KILOTON)
    TABLE 31. U.S. PACKAGING RESINS MARKET, BY TYPE, 2022-2032 ($MILLION)
    TABLE 32. U.S. PACKAGING RESINS MARKET, BY TYPE, 2022-2032 (KILOTON)
    TABLE 33. U.S. PACKAGING RESINS MARKET, BY APPLICATION, 2022-2032 ($MILLION)
    TABLE 34. U.S. PACKAGING RESINS MARKET, BY APPLICATION, 2022-2032 (KILOTON)
    TABLE 35. CANADA PACKAGING RESINS MARKET, BY TYPE, 2022-2032 ($MILLION)
    TABLE 36. CANADA PACKAGING RESINS MARKET, BY TYPE, 2022-2032 (KILOTON)
    TABLE 37. CANADA PACKAGING RESINS MARKET, BY APPLICATION, 2022-2032 ($MILLION)
    TABLE 38. CANADA PACKAGING RESINS MARKET, BY APPLICATION, 2022-2032 (KILOTON)
    TABLE 39. MEXICO PACKAGING RESINS MARKET, BY TYPE, 2022-2032 ($MILLION)
    TABLE 40. MEXICO PACKAGING RESINS MARKET, BY TYPE, 2022-2032 (KILOTON)
    TABLE 41. MEXICO PACKAGING RESINS MARKET, BY APPLICATION, 2022-2032 ($MILLION)
    TABLE 42. MEXICO PACKAGING RESINS MARKET, BY APPLICATION, 2022-2032 (KILOTON)
    TABLE 43. EUROPE PACKAGING RESINS MARKET, BY TYPE, 2022-2032 ($MILLION)
    TABLE 44. EUROPE PACKAGING RESINS MARKET, BY TYPE, 2022-2032 (KILOTON)
    TABLE 45. EUROPE PACKAGING RESINS MARKET, BY APPLICATION, 2022-2032 ($MILLION)
    TABLE 46. EUROPE PACKAGING RESINS MARKET, BY APPLICATION, 2022-2032 (KILOTON)
    TABLE 47. EUROPE PACKAGING RESINS MARKET, BY COUNTRY, 2022-2032 ($MILLION)
    TABLE 48. EUROPE PACKAGING RESINS MARKET, BY COUNTRY, 2022-2032 (KILOTON)
    TABLE 49. GERMANY PACKAGING RESINS MARKET, BY TYPE, 2022-2032 ($MILLION)
    TABLE 50. GERMANY PACKAGING RESINS MARKET, BY TYPE, 2022-2032 (KILOTON)
    TABLE 51. GERMANY PACKAGING RESINS MARKET, BY APPLICATION, 2022-2032 ($MILLION)
    TABLE 52. GERMANY PACKAGING RESINS MARKET, BY APPLICATION, 2022-2032 (KILOTON)
    TABLE 53. FRANCE PACKAGING RESINS MARKET, BY TYPE, 2022-2032 ($MILLION)
    TABLE 54. FRANCE PACKAGING RESINS MARKET, BY TYPE, 2022-2032 (KILOTON)
    TABLE 55. FRANCE PACKAGING RESINS MARKET, BY APPLICATION, 2022-2032 ($MILLION)
    TABLE 56. FRANCE PACKAGING RESINS MARKET, BY APPLICATION, 2022-2032 (KILOTON)
    TABLE 57. UK PACKAGING RESINS MARKET, BY TYPE, 2022-2032 ($MILLION)
    TABLE 58. UK PACKAGING RESINS MARKET, BY TYPE, 2022-2032 (KILOTON)
    TABLE 59. UK PACKAGING RESINS MARKET, BY APPLICATION, 2022-2032 ($MILLION)
    TABLE 60. UK PACKAGING RESINS MARKET, BY APPLICATION, 2022-2032 (KILOTON)
    TABLE 61. SPAIN PACKAGING RESINS MARKET, BY TYPE, 2022-2032 ($MILLION)
    TABLE 62. SPAIN PACKAGING RESINS MARKET, BY TYPE, 2022-2032 (KILOTON)
    TABLE 63. SPAIN PACKAGING RESINS MARKET, BY APPLICATION, 2022-2032 ($MILLION)
    TABLE 64. SPAIN PACKAGING RESINS MARKET, BY APPLICATION, 2022-2032 (KILOTON)
    TABLE 65. ITALY PACKAGING RESINS MARKET, BY TYPE, 2022-2032 ($MILLION)
    TABLE 66. ITALY PACKAGING RESINS MARKET, BY TYPE, 2022-2032 (KILOTON)
    TABLE 67. ITALY PACKAGING RESINS MARKET, BY APPLICATION, 2022-2032 ($MILLION)
    TABLE 68. ITALY PACKAGING RESINS MARKET, BY APPLICATION, 2022-2032 (KILOTON)
    TABLE 69. REST OF EUROPE PACKAGING RESINS MARKET, BY TYPE, 2022-2032 ($MILLION)
    TABLE 70. REST OF EUROPE PACKAGING RESINS MARKET, BY TYPE, 2022-2032 (KILOTON)
    TABLE 71. REST OF EUROPE PACKAGING RESINS MARKET, BY APPLICATION, 2022-2032 ($MILLION)
    TABLE 72. REST OF EUROPE PACKAGING RESINS MARKET, BY APPLICATION, 2022-2032 (KILOTON)
    TABLE 73. ASIA-PACIFIC PACKAGING RESINS MARKET, BY TYPE, 2022-2032 ($MILLION)
    TABLE 74. ASIA-PACIFIC PACKAGING RESINS MARKET, BY TYPE, 2022-2032 (KILOTON)
    TABLE 75. ASIA-PACIFIC PACKAGING RESINS MARKET, BY APPLICATION, 2022-2032 ($MILLION)
    TABLE 76. ASIA-PACIFIC PACKAGING RESINS MARKET, BY APPLICATION, 2022-2032 (KILOTON)
    TABLE 77. ASIA-PACIFIC PACKAGING RESINS MARKET, BY COUNTRY, 2022-2032 ($MILLION)
    TABLE 78. ASIA-PACIFIC PACKAGING RESINS MARKET, BY COUNTRY, 2022-2032 (KILOTON)
    TABLE 79. CHINA PACKAGING RESINS MARKET, BY TYPE, 2022-2032 ($MILLION)
    TABLE 80. CHINA PACKAGING RESINS MARKET, BY TYPE, 2022-2032 (KILOTON)
    TABLE 81. CHINA PACKAGING RESINS MARKET, BY APPLICATION, 2022-2032 ($MILLION)
    TABLE 82. CHINA PACKAGING RESINS MARKET, BY APPLICATION, 2022-2032 (KILOTON)
    TABLE 83. JAPAN PACKAGING RESINS MARKET, BY TYPE, 2022-2032 ($MILLION)
    TABLE 84. JAPAN PACKAGING RESINS MARKET, BY TYPE, 2022-2032 (KILOTON)
    TABLE 85. JAPAN PACKAGING RESINS MARKET, BY APPLICATION, 2022-2032 ($MILLION)
    TABLE 86. JAPAN PACKAGING RESINS MARKET, BY APPLICATION, 2022-2032 (KILOTON)
    TABLE 87. INDIA PACKAGING RESINS MARKET, BY TYPE, 2022-2032 ($MILLION)
    TABLE 88. INDIA PACKAGING RESINS MARKET, BY TYPE, 2022-2032 (KILOTON)
    TABLE 89. INDIA PACKAGING RESINS MARKET, BY APPLICATION, 2022-2032 ($MILLION)
    TABLE 90. INDIA PACKAGING RESINS MARKET, BY APPLICATION, 2022-2032 (KILOTON)
    TABLE 91. SOUTH KOREA PACKAGING RESINS MARKET, BY TYPE, 2022-2032 ($MILLION)
    TABLE 92. SOUTH KOREA PACKAGING RESINS MARKET, BY TYPE, 2022-2032 (KILOTON)
    TABLE 93. SOUTH KOREA PACKAGING RESINS MARKET, BY APPLICATION, 2022-2032 ($MILLION)
    TABLE 94. SOUTH KOREA PACKAGING RESINS MARKET, BY APPLICATION, 2022-2032 (KILOTON)
    TABLE 95. AUSTRALIA PACKAGING RESINS MARKET, BY TYPE, 2022-2032 ($MILLION)
    TABLE 96. AUSTRALIA PACKAGING RESINS MARKET, BY TYPE, 2022-2032 (KILOTON)
    TABLE 97. AUSTRALIA PACKAGING RESINS MARKET, BY APPLICATION, 2022-2032 ($MILLION)
    TABLE 98. AUSTRALIA PACKAGING RESINS MARKET, BY APPLICATION, 2022-2032 (KILOTON)
    TABLE 99. REST OF ASIA-PACIFIC PACKAGING RESINS MARKET, BY TYPE, 2022-2032 ($MILLION)
    TABLE 100. REST OF ASIA-PACIFIC PACKAGING RESINS MARKET, BY TYPE, 2022-2032 (KILOTON)
    TABLE 101. REST OF ASIA-PACIFIC PACKAGING RESINS MARKET, BY APPLICATION, 2022-2032 ($MILLION)
    TABLE 102. REST OF ASIA-PACIFIC PACKAGING RESINS MARKET, BY APPLICATION, 2022-2032 (KILOTON)
    TABLE 103. LAMEA PACKAGING RESINS MARKET, BY TYPE, 2022-2032 ($MILLION)
    TABLE 104. LAMEA PACKAGING RESINS MARKET, BY TYPE, 2022-2032 (KILOTON)
    TABLE 105. LAMEA PACKAGING RESINS MARKET, BY APPLICATION, 2022-2032 ($MILLION)
    TABLE 106. LAMEA PACKAGING RESINS MARKET, BY APPLICATION, 2022-2032 (KILOTON)
    TABLE 107. LAMEA PACKAGING RESINS MARKET, BY COUNTRY, 2022-2032 ($MILLION)
    TABLE 108. LAMEA PACKAGING RESINS MARKET, BY COUNTRY, 2022-2032 (KILOTON)
    TABLE 109. BRAZIL PACKAGING RESINS MARKET, BY TYPE, 2022-2032 ($MILLION)
    TABLE 110. BRAZIL PACKAGING RESINS MARKET, BY TYPE, 2022-2032 (KILOTON)
    TABLE 111. BRAZIL PACKAGING RESINS MARKET, BY APPLICATION, 2022-2032 ($MILLION)
    TABLE 112. BRAZIL PACKAGING RESINS MARKET, BY APPLICATION, 2022-2032 (KILOTON)
    TABLE 113. SOUTH AFRICA PACKAGING RESINS MARKET, BY TYPE, 2022-2032 ($MILLION)
    TABLE 114. SOUTH AFRICA PACKAGING RESINS MARKET, BY TYPE, 2022-2032 (KILOTON)
    TABLE 115. SOUTH AFRICA PACKAGING RESINS MARKET, BY APPLICATION, 2022-2032 ($MILLION)
    TABLE 116. SOUTH AFRICA PACKAGING RESINS MARKET, BY APPLICATION, 2022-2032 (KILOTON)
    TABLE 117. SAUDI ARABIA PACKAGING RESINS MARKET, BY TYPE, 2022-2032 ($MILLION)
    TABLE 118. SAUDI ARABIA PACKAGING RESINS MARKET, BY TYPE, 2022-2032 (KILOTON)
    TABLE 119. SAUDI ARABIA PACKAGING RESINS MARKET, BY APPLICATION, 2022-2032 ($MILLION)
    TABLE 120. SAUDI ARABIA PACKAGING RESINS MARKET, BY APPLICATION, 2022-2032 (KILOTON)
    TABLE 121. REST OF LAMEA PACKAGING RESINS MARKET, BY TYPE, 2022-2032 ($MILLION)
    TABLE 122. REST OF LAMEA PACKAGING RESINS MARKET, BY TYPE, 2022-2032 (KILOTON)
    TABLE 123. REST OF LAMEA PACKAGING RESINS MARKET, BY APPLICATION, 2022-2032 ($MILLION)
    TABLE 124. REST OF LAMEA PACKAGING RESINS MARKET, BY APPLICATION, 2022-2032 (KILOTON)
    TABLE 125. SABIC: KEY EXECUTIVES
    TABLE 126. SABIC: COMPANY SNAPSHOT
    TABLE 127. SABIC: PRODUCT SEGMENTS
    TABLE 128. SABIC: PRODUCT PORTFOLIO
    TABLE 129. SABIC: KEY STRATERGIES
    TABLE 130. BASF SE: KEY EXECUTIVES
    TABLE 131. BASF SE: COMPANY SNAPSHOT
    TABLE 132. BASF SE: PRODUCT SEGMENTS
    TABLE 133. BASF SE: PRODUCT PORTFOLIO
    TABLE 134. BOREALIS AG.: KEY EXECUTIVES
    TABLE 135. BOREALIS AG.: COMPANY SNAPSHOT
    TABLE 136. BOREALIS AG.: PRODUCT SEGMENTS
    TABLE 137. BOREALIS AG.: PRODUCT PORTFOLIO
    TABLE 138. BRASKEM: KEY EXECUTIVES
    TABLE 139. BRASKEM: COMPANY SNAPSHOT
    TABLE 140. BRASKEM: PRODUCT SEGMENTS
    TABLE 141. BRASKEM: PRODUCT PORTFOLIO
    TABLE 142. BRASKEM: KEY STRATERGIES
    TABLE 143. CHINA PETROCHEMICAL CORPORATION: KEY EXECUTIVES
    TABLE 144. CHINA PETROCHEMICAL CORPORATION: COMPANY SNAPSHOT
    TABLE 145. CHINA PETROCHEMICAL CORPORATION: PRODUCT SEGMENTS
    TABLE 146. CHINA PETROCHEMICAL CORPORATION: PRODUCT PORTFOLIO
    TABLE 147. EXXON MOBIL CORPORATION: KEY EXECUTIVES
    TABLE 148. EXXON MOBIL CORPORATION: COMPANY SNAPSHOT
    TABLE 149. EXXON MOBIL CORPORATION: PRODUCT SEGMENTS
    TABLE 150. EXXON MOBIL CORPORATION: PRODUCT PORTFOLIO
    TABLE 151. EXXON MOBIL CORPORATION: KEY STRATERGIES
    TABLE 152. INEOS: KEY EXECUTIVES
    TABLE 153. INEOS: COMPANY SNAPSHOT
    TABLE 154. INEOS: PRODUCT SEGMENTS
    TABLE 155. INEOS: PRODUCT PORTFOLIO
    TABLE 156. LYONDELLBASELL INDUSTRIES HOLDINGS B.V.: KEY EXECUTIVES
    TABLE 157. LYONDELLBASELL INDUSTRIES HOLDINGS B.V.: COMPANY SNAPSHOT
    TABLE 158. LYONDELLBASELL INDUSTRIES HOLDINGS B.V.: PRODUCT SEGMENTS
    TABLE 159. LYONDELLBASELL INDUSTRIES HOLDINGS B.V.: PRODUCT PORTFOLIO
    TABLE 160. LYONDELLBASELL INDUSTRIES HOLDINGS B.V.: KEY STRATERGIES
    TABLE 161. RELIANCE INDUSTRIES LIMITED: KEY EXECUTIVES
    TABLE 162. RELIANCE INDUSTRIES LIMITED: COMPANY SNAPSHOT
    TABLE 163. RELIANCE INDUSTRIES LIMITED: PRODUCT SEGMENTS
    TABLE 164. RELIANCE INDUSTRIES LIMITED: PRODUCT PORTFOLIO
    TABLE 165. MITSUBISHI CHEMICAL CORPORATION: KEY EXECUTIVES
    TABLE 166. MITSUBISHI CHEMICAL CORPORATION: COMPANY SNAPSHOT
    TABLE 167. MITSUBISHI CHEMICAL CORPORATION: PRODUCT SEGMENTS
    TABLE 168. MITSUBISHI CHEMICAL CORPORATION: PRODUCT PORTFOLIO
    TABLE 169. MITSUBISHI CHEMICAL CORPORATION: KEY STRATERGIES
  • LIST OF FIGURES

  • FIGURE 01. PACKAGING RESINS MARKET, 2022-2032
    FIGURE 02. SEGMENTATION OF PACKAGING RESINS MARKET,2022-2032
    FIGURE 03. TOP INVESTMENT POCKETS IN PACKAGING RESINS MARKET (2023-2032)
    FIGURE 04. MODERATE BARGAINING POWER OF SUPPLIERS
    FIGURE 05. MODERATE THREAT OF NEW ENTRANTS
    FIGURE 06. HIGH THREAT OF SUBSTITUTES
    FIGURE 07. MODERATE INTENSITY OF RIVALRY
    FIGURE 08. MODERATE BARGAINING POWER OF BUYERS
    FIGURE 09. GLOBAL PACKAGING RESINS MARKET:DRIVERS, RESTRAINTS AND OPPORTUNITIES
    FIGURE 10. IMPACT OF KEY REGULATION: PACKAGING RESINS MARKET
    FIGURE 11. PATENT ANALYSIS BY COMPANY
    FIGURE 12. PATENT ANALYSIS BY COUNTRY
    FIGURE 13. PRICING ANALYSIS: PACKAGING RESINS MARKET 2022 AND 2032
    FIGURE 14. PACKAGING RESINS MARKET, BY TYPE, 2022(%)
    FIGURE 15. COMPARATIVE SHARE ANALYSIS OF PACKAGING RESINS MARKET FOR LOW DENSITY POLYETHYLENE (LDPE), BY COUNTRY 2022 AND 2032(%)
    FIGURE 16. COMPARATIVE SHARE ANALYSIS OF PACKAGING RESINS MARKET FOR POLYPROPYLENE (PP), BY COUNTRY 2022 AND 2032(%)
    FIGURE 17. COMPARATIVE SHARE ANALYSIS OF PACKAGING RESINS MARKET FOR HIGH DENSITY POLYETHYLENE (HDPE), BY COUNTRY 2022 AND 2032(%)
    FIGURE 18. COMPARATIVE SHARE ANALYSIS OF PACKAGING RESINS MARKET FOR POLYSTYRENE (PS), BY COUNTRY 2022 AND 2032(%)
    FIGURE 19. COMPARATIVE SHARE ANALYSIS OF PACKAGING RESINS MARKET FOR OTHERS, BY COUNTRY 2022 AND 2032(%)
    FIGURE 20. PACKAGING RESINS MARKET, BY APPLICATION, 2022(%)
    FIGURE 21. COMPARATIVE SHARE ANALYSIS OF PACKAGING RESINS MARKET FOR FOOD AND BEVERAGE, BY COUNTRY 2022 AND 2032(%)
    FIGURE 22. COMPARATIVE SHARE ANALYSIS OF PACKAGING RESINS MARKET FOR CONSUMER GOODS, BY COUNTRY 2022 AND 2032(%)
    FIGURE 23. COMPARATIVE SHARE ANALYSIS OF PACKAGING RESINS MARKET FOR HEALTHCARE, BY COUNTRY 2022 AND 2032(%)
    FIGURE 24. COMPARATIVE SHARE ANALYSIS OF PACKAGING RESINS MARKET FOR OTHERS, BY COUNTRY 2022 AND 2032(%)
    FIGURE 25. PACKAGING RESINS MARKET BY REGION, 2022(%)
    FIGURE 26. U.S. PACKAGING RESINS MARKET, 2022-2032 ($MILLION)
    FIGURE 27. CANADA PACKAGING RESINS MARKET, 2022-2032 ($MILLION)
    FIGURE 28. MEXICO PACKAGING RESINS MARKET, 2022-2032 ($MILLION)
    FIGURE 29. GERMANY PACKAGING RESINS MARKET, 2022-2032 ($MILLION)
    FIGURE 30. FRANCE PACKAGING RESINS MARKET, 2022-2032 ($MILLION)
    FIGURE 31. UK PACKAGING RESINS MARKET, 2022-2032 ($MILLION)
    FIGURE 32. SPAIN PACKAGING RESINS MARKET, 2022-2032 ($MILLION)
    FIGURE 33. ITALY PACKAGING RESINS MARKET, 2022-2032 ($MILLION)
    FIGURE 34. REST OF EUROPE PACKAGING RESINS MARKET, 2022-2032 ($MILLION)
    FIGURE 35. CHINA PACKAGING RESINS MARKET, 2022-2032 ($MILLION)
    FIGURE 36. JAPAN PACKAGING RESINS MARKET, 2022-2032 ($MILLION)
    FIGURE 37. INDIA PACKAGING RESINS MARKET, 2022-2032 ($MILLION)
    FIGURE 38. SOUTH KOREA PACKAGING RESINS MARKET, 2022-2032 ($MILLION)
    FIGURE 39. AUSTRALIA PACKAGING RESINS MARKET, 2022-2032 ($MILLION)
    FIGURE 40. REST OF ASIA-PACIFIC PACKAGING RESINS MARKET, 2022-2032 ($MILLION)
    FIGURE 41. BRAZIL PACKAGING RESINS MARKET, 2022-2032 ($MILLION)
    FIGURE 42. SOUTH AFRICA PACKAGING RESINS MARKET, 2022-2032 ($MILLION)
    FIGURE 43. SAUDI ARABIA PACKAGING RESINS MARKET, 2022-2032 ($MILLION)
    FIGURE 44. REST OF LAMEA PACKAGING RESINS MARKET, 2022-2032 ($MILLION)
    FIGURE 45. TOP WINNING STRATEGIES, BY YEAR (2020-2022)
    FIGURE 46. TOP WINNING STRATEGIES, BY DEVELOPMENT (2020-2022)
    FIGURE 47. TOP WINNING STRATEGIES, BY COMPANY (2020-2022)
    FIGURE 48. PRODUCT MAPPING OF TOP 10 PLAYERS
    FIGURE 49. COMPETITIVE DASHBOARD
    FIGURE 50. COMPETITIVE HEATMAP: PACKAGING RESINS MARKET
    FIGURE 51. TOP PLAYER POSITIONING, 2022
    FIGURE 52. SABIC: NET SALES, 2020-2022 ($MILLION)
    FIGURE 53. SABIC: REVENUE SHARE BY SEGMENT, 2022 (%)
    FIGURE 54. SABIC: REVENUE SHARE BY REGION, 2022 (%)
    FIGURE 55. BASF SE: NET SALES, 2020-2022 ($MILLION)
    FIGURE 56. BASF SE: RESEARCH & DEVELOPMENT EXPENDITURE, 2020-2022 ($MILLION)
    FIGURE 57. BASF SE: REVENUE SHARE BY SEGMENT, 2022 (%)
    FIGURE 58. BASF SE: REVENUE SHARE BY REGION, 2022 (%)
    FIGURE 59. BRASKEM: NET REVENUE, 2020-2022 ($MILLION)
    FIGURE 60. BRASKEM: REVENUE SHARE BY SEGMENT, 2022 (%)
    FIGURE 61. EXXON MOBIL CORPORATION: NET SALES, 2020-2022 ($MILLION)
    FIGURE 62. EXXON MOBIL CORPORATION: RESEARCH & DEVELOPMENT EXPENDITURE, 2020-2022 ($MILLION)
    FIGURE 63. EXXON MOBIL CORPORATION: REVENUE SHARE BY SEGMENT, 2022 (%)
    FIGURE 64. EXXON MOBIL CORPORATION: REVENUE SHARE BY REGION, 2020 (%)
    FIGURE 65. INEOS: GROSS PROFIT, 2020-2022 ($MILLION)
    FIGURE 66. INEOS: REVENUE SHARE BY REGION, 2022 (%)
    FIGURE 67. INEOS: REVENUE SHARE BY SEGMENT, 2022 (%)
    FIGURE 68. LYONDELLBASELL INDUSTRIES HOLDINGS B.V.: NET REVENUE, 2020-2022 ($MILLION)
    FIGURE 69. LYONDELLBASELL INDUSTRIES HOLDINGS B.V.: RESEARCH & DEVELOPMENT EXPENDITURE, 2020-2022 ($MILLION)
    FIGURE 70. LYONDELLBASELL INDUSTRIES HOLDINGS B.V.: REVENUE SHARE BY SEGMENT, 2022 (%)
    FIGURE 71. RELIANCE INDUSTRIES LIMITED: NET REVENUE, 2020-2022 ($MILLION)
    FIGURE 72. RELIANCE INDUSTRIES LIMITED: RESEARCH & DEVELOPMENT EXPENDITURE, 2020-2022 ($MILLION)
    FIGURE 73. RELIANCE INDUSTRIES LIMITED: REVENUE SHARE BY SEGMENT, 2021 (%)
    FIGURE 74. RELIANCE INDUSTRIES LIMITED: REVENUE SHARE BY REGION, 2021 (%)
    FIGURE 75. MITSUBISHI CHEMICAL CORPORATION: NET REVENUE, 2020-2022 ($MILLION)
    FIGURE 76. MITSUBISHI CHEMICAL CORPORATION: REVENUE SHARE BY SEGMENT, 2022 (%)


PURCHASE OPTIONS

Call or Email us

U.S.-Canada Toll-free: +1-800-792-5285
Int'l : +1-503-894-6022
Europe : +44-845-528-1300
Email : help@alliedmarketresearch.com
 
FREQUENTLY ASKED QUESTIONS?

A. The packaging resin market is segmented into type, application, and region. On the basis of type, the market is classified into low-density polyethylene (LDPE), polypropylene (PP), high-density polyethylene (HDPE), polystyrene (PS), and others. On the basis of application, the market is divided into food and beverage, consumer goods, healthcare, and others.

A. the leading application of packaging resins market includes food and beverage, consumer goods, healthcare, and others.

A. Asia-Pacific is the largest regional market for packaging resins.

A. Increase in demand for packaged goods across various sectors and technological advancements in resin manufacturing are the driving factors of packaging resins market.

A. Growth in eco-friendly packaging materials is the upcoming trend of the packaging resins market in the world.

A. The top companies to hold the market share in packaging resins includes BASF SE, Borealis AG, Braskem, China Petrochemical Corporation, Dow, Exxon Mobil Corporation, INEOS, LyondellBasell Industries Holdings B.V., Reliance Industries Limited, and SABIC.

A. The Packaging Resins Market was valued for $288.9 billion in 2022 and is estimated to reach $587.3 billion by 2032, exhibiting a CAGR of 7.4% from 2023 to 2032.

Looking for Customization?

 Customization Request

Have a Question?

 Speak with Analyst

Any Confusion?

 Inquire Before Buying

Have a glance of the Report

  Request Sample
RELATED TAGS

Purchase Full Report of
Packaging Resins Market

Start reading instantly.
This Report and over 66,944+ more Reports, Available with Avenue Library. T&C*.

  • Online Only
  • $3,570
  • Online cloud access only
  • Restricted print, copy, paste & download
  • Read only
  • Free industry update
    (Within 180 days)
  • Free report update in next update cycle
    (Aug 2024 - Aug 2025)
  • Data Pack
  • $3,840
  • Restricted to one authorized user
  • One print only
  • Available in
    Excel
  • Free industry update
    (Within 180 days)
  •   Free report update in next update cycle
    (Aug 2024 - Aug 2025)
  • Single User
  • $5,730
  • Restricted to one authorized user
  • One print only
  • Available in
    PDF
  • Free industry update
    (Within 180 days)
  •   Free report update in next update cycle
    (Aug 2024 - Aug 2025)
  • Five Users
  • $6,450
  • Limited to five authorized users
  • Print upto five copies
  • Available in
    PDF
  • Free industry update
    (Within 180 days)
  •   Free report update in next update cycle
    (Aug 2024 - Aug 2025)
  • Enterprise
    License/PDF

  • $9,600
  • Unlimited
    within
    company/enterprise
  • Available in Excel & PDF
  • Free industry update
    (Within 180 days)
  •   Free report update in next update cycle
    (Aug 2024 - Aug 2025)
  • Library
    Membership

  • $999 $ 1,175
    Per User/ Per month/ Billed annually
  • Published Content
    E-access
  • Company Profiles
    E-access
  • Newly Added Content Access
  • 10 PDF
    Downloads
  • 5 Excel Data
    Pack Downloads
  • 250 Company Profiles PDF Downloads
  • Buy Now

*Taxes/Fees, if applicable will be added during checkout. All prices in USD

RELATED REPORTS
 

Why Allied Market Research?


Infallible Methodology

To ensure high-level data integrity, accurate analysis, and impeccable forecasts

Analyst Support

For complete satisfaction

Customization

On-demand customization of scope of the report to exactly meet your needs

TARGETED MARKET VIEW

Targeted market view to provide pertinent information and save time of readers

Get fresh content delivered

Get insights on topics that are crucial for your business. Stay abreast of your interest areas.

Get Industry Data Alerts

Why Allied Market Research?

Infallible Methodology

To ensure high-level data integrity, accurate analysis, and impeccable forecasts

Analyst Support

For complete satisfaction

Customization

On-demand customization of scope of the report to exactly meet your needs

TARGETED MARKET VIEW

Targeted market view to provide pertinent information and save time of readers