0
New
New
2023
Pain Patch Market

Pain Patch Market

by Product Type (Non-Opioid Patches, Opioid Patches), by Type (Prescription Medicines, OTC Medicines), by Distribution Channel (Hospital Pharmacies, Drug Stores and Retail Pharmacies, Online Providers): Global Opportunity Analysis and Industry Forecast, 2021-2031

Report Code: A12676
Mar 2023 | Pages: 374
Tables: 131
Charts: 61
  • Formats*:

  • pdf

    Single User License, Five User
    License & Enterprise User License

  • xls

    Data Pack Excel License

  • ppt

    It comes with the additional cost
    of $2500.00 contact sales.


Pain Patch Market Research, 2031

The global pain patch market size was valued at $4.8 billion in 2021, and is projected to reach $7.3 billion by 2031, growing at a CAGR of 4.3% from 2022 to 2031. Pain patches are transdermal patches that contain medication to relieve pain. They are a popular alternative to traditional pain medication, such as pills or injections, as they offer a convenient and non-invasive way to deliver medication directly to the site of pain. 

Pain patches work by using a matrix or reservoir system to deliver medication through the skin and into the bloodstream. These are available in a variety of formulations, including those that contain opioids, nonsteroidal anti-inflammatory drugs (NSAIDs), and other pain-relieving medications. They can be used to treat a range of acute and chronic pain conditions, including postoperative pain, arthritis, cancer, and neuropathic pain. One of the advantages of a pain patch is that it can provide long-lasting pain relief without the need for frequent dosing. This is because the medication is delivered slowly and continuously over a period of time, rather than in a single dose. In addition, pain patches can help minimize systemic side effects associated with oral pain medication, such as gastrointestinal upset or drowsiness as these are applied directly to the skin. 
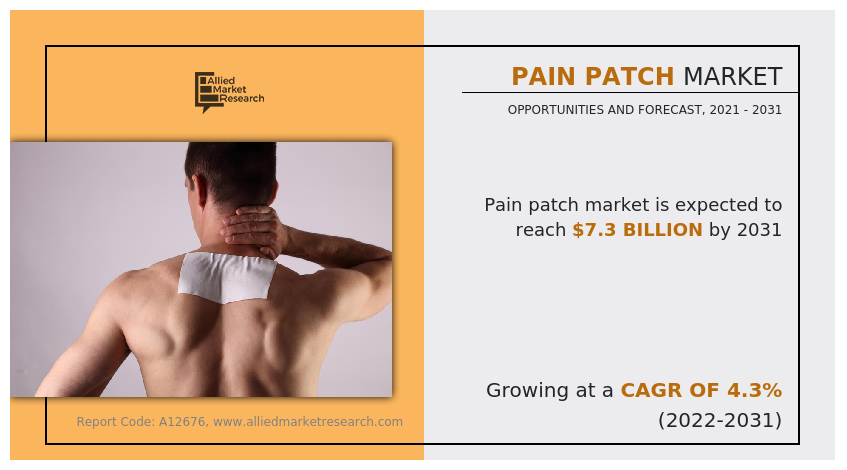
The pain patch market was negatively impacted during the lockdown period owing to a disruption of screening services for pain-related disorders. Moreover, the rise in the prevalence of chronic pain-related disorders after post-COVID-19 had shown a positive impact on the growth of the market.

Pain Patch Market

Market Dynamics:

The major factor driving the growth of the pain patch market size includes rise in pain disorders, availability of improved healthcare infrastructure, increase in unmet healthcare needs, rise in prevalence of chronic diseases cases, and surge in demand for effective pain medicines with less side effects. In addition, the rise in popularity of personalization in pain management is driving the demand for effective pain patch thus driving the growth of the market.  

Furthermore, geriatric populations are more prone to chronic pain-causing diseases such as joint disorders, neuropathic pain, cancer and others. Thus, rise in cases of chronic pain potentially drives the market growth. For instance, according to an article published in National Library of Medicine 2021, increase in diabetic neuropathic cases was observed from 30 million in 2019 to 85 million in the U.S. which drives the growth during pain patch market growth. 

Further, an increase in incidence of sports and work related trauma injuries such as sprains and strains, fractures, tendinitis and back injuries is expected to fuel the growth of the market. In addition, there is a rise in prevalence of low back pain cases in adults which further contributes to market growth. For instance, according to article published in Springer 2022, it stated that 54% adults suffer from back pain with 24 – 80% reoccurrence pain disorder in one year. 

E-commerce (electronic commerce) has become a vital tool for small and large businesses globally, due to rise in preference of consumers for online shopping over traditional purchasing methods. Various animations through health apps to educate people regarding pain management and usage of novel drug delivery system have contributed toward the growth of the pain patch market. The demand for effective pain management solutions is not only limited to developed countries but is also being witnessed in the developing countries, such as China, Brazil, and India, which fuel the growth of the market. Moreover, an increase in promotional activities by manufacturers and growth in awareness for proper treatment medications for pain disorders among the general population are expected to fuel their adoption during the forecast period. 

However, availability of various alternative therapies like pain management devices chiropractic manipulation and acupuncture is anticipated to hamper the growth of market. In addition, various side effects such as skin irritation, allergic reaction, misuse and habit-forming drugs used in pain patch restrain the market growth. Furthermore, various new advancements like innovative technologies and regulations to formulate pain patch containing opioid drugs while minimizing the risks of addiction, dependence, and overdose provide lucrative opportunities to key players of the pain patch market. 

The outbreak of COVID-19 has disrupted growth in many economies across various domains. The pandemic is anticipated to impact the growth of the pain patch industry. As most chronic pain facilities were deemed non-urgent, both outpatient and elective interventional procedures were limited or stopped during the COVID-19 pandemic to minimize risk of the viral spread. Further, according to American Society of Regional Anesthesia and Pain Medicine report in May 2020, patients with COVID-19 who are receiving opioids treatment can be more susceptible to respiratory depression and the absorption of fentanyl drug during transdermal administration such as fentanyl patch may increase with fever and could increase opioid side-effects. Thus, such side effects limited the use of pain patches and therefore had negative impact on the growth of the market. 

However, post-COVID-19 pandemic, there was an observed rise in number of patients suffering from chronic pain disorders such as neuropathic pain, muscoskeletal pain and joint pain was observed resulting in demand of appropriate pain management solutions. For instance, article published by National Library of Medicine (NIH) 2023, stated that, post-COVID chronic pain exhibited both musculoskeletal and neuropathic pain features, where prevalence of neuropathic pain was estimated to be 24.4%. Thus, rise in prevalence of chronic pain cases is expected to increase the market growth in near future. 

Furthermore, the pain patch market is anticipated to show growth in during pain patch market forecast attributing to the increase in adoption of novel drug delivery systems for pain management with less side effects, rise in diagnosis of chronic pain disorder, and increase cases of arthritis, cancer and neuropathic pain. Further, proper counselling for post operative pain conditions and approvals for novel pain patch drive the market growth. Thus, pandemic positively impacted the growth of the market. 

Segmental Overview 

The pain patch market is segmented into product type, type, distribution channel, and region. On the basis of product type, the market is categorized into non-opioids and opioids. The non-opioid segment is further categorized into nonsteroidal anti-inflammatory drugs (NSAIDS), methyl salicylate, lidocaine and others. The opioid segment is further categorized into buprenorphine and fentanyl. On the basis of type, the market is categorized into prescription medicines and OTC medicines. On the basis of distribution channel, the market is segregated into hospital pharmacies, drug stores and retail pharmacies and online providers. Region wise, the market is analyzed across North America (the U.S., Canada, and Mexico), Europe (Germany, France, the UK, Italy, Spain, and rest of Europe), Asia-Pacific (Japan, China, Australia, India, South Korea, and rest of Asia-Pacific), and LAMEA (Brazil, South Africa, Saudi Arabia, and rest of LAMEA). 

By Product Type  

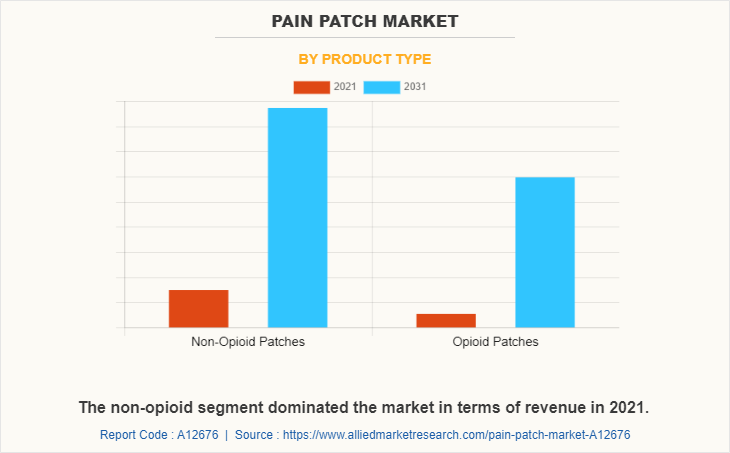
The pain patch market is categorized into active non-opioids and opioids. The non-opioids segment accounted for the largest share in 2021 and is expected to witness highest CAGR during the forecast period, owing to an increase in demand for alternative pain management options that can provide effective relief without the risks associated with opioids. 
Pain Patch Market

By Type 

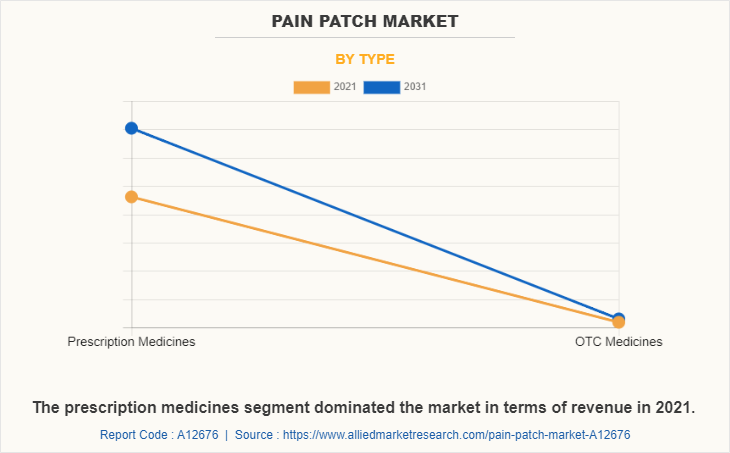
The pain patch industry is categorized into prescription medicines and OTC medicines. The prescription medicines segment accounted for largest share in 2021 and is expected to witness highest CAGR during the forecast period owing to advantages as they provide correct number of drugs in the treatment of pain without causing much side effects, and commonly the opioids patches and NSAIDS are prescribed which are proven to be more effective in chronic pain management.   
Pain Patch Market

By Distribution Channel  

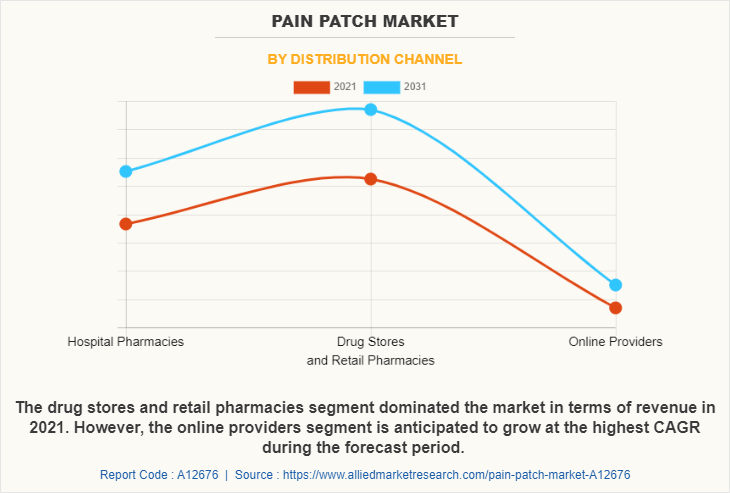
The pain patch market is categorized into hospital pharmacies, drug stores and retail pharmacies and online providers. The drug stores and retail pharmacies segment occupied largest pain patch market share in 2021 and is expected to remain dominant during the forecast period owing to increase in preference of the people toward retail pharmacies, as retail pharmacies guide regarding medications and usage during treatment period. The online providers segment is projected to register the highest CAGR during the forecast period owing to the rise in popularity of online pharmacies and the number of users preferring online pharmacies. 
Pain Patch Market

By Region

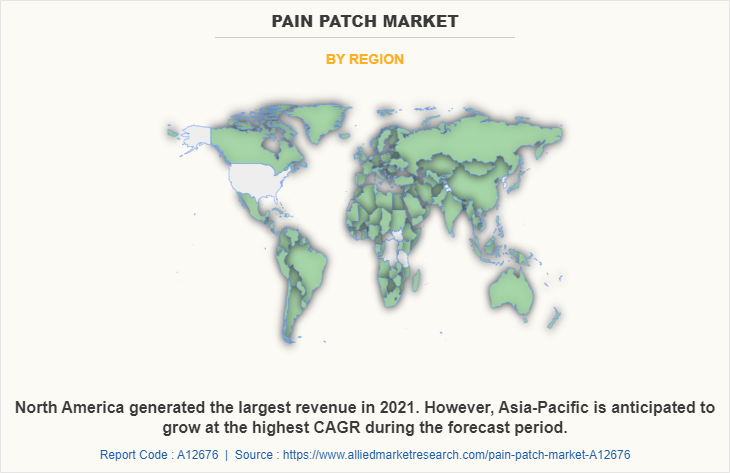
The pain patch market is analyzed across North America, Europe, Asia-Pacific, and LAMEA. North America accounted for largest pain patch market share in 2021 and is expected to remain dominant during the forecast period owing to rise in prevalence of chronic pain cases, presence of key players offering Pain patch and rise in healthcare infrastructure drive the growth of Pain patch market. However, Asia-Pacific is anticipated to witness notable growth, owing to increase in investments for development of novel drug delivery system, increases in geriatric population and surge in personalization of pain management, thereby driving the growth of market during the forecast period. 
Pain Patch Market

Competition Analysis 

Competitive analysis and profiles of the major players in the Pain patch market, such as NEXGEL Advanced Hydrogel Solutions, Viatris Inc., Johnson and Johnson, Teva Pharmaceutical Industries Ltd., Sorrento Therapeutics Inc., Hisamitsu Pharmaceutical Co.,Inc., Endo International plc., Purdue Pharma L.P., Amneal Pharmaceuticals LLC, and Grunenthal are provided in this report. Major players have adopted product approval, launch, business expansion and product upgradation as key developmental strategies to improve the product portfolio of the Pain patch market.  

Recent Approvals and Advancements in Pain Patch Market 

  • In August 2020, Amneal Pharmaceuticals, Inc., a pharmaceutical manufacturing company, announced that it has received Abbreviated New Drug Application (ANDA) approval from the U.S. Food and Drug Administration (FDA) for a generic version of Lidocaine Patch, 5%. Lidocaine Patch, 5% is the generic version of Lidoderm Patch, 5% for treatment of post-herpetic neuralgia. 
  • In January 2021, Hisamitsu Pharmaceutical Co., Inc. announce that it has obtained approval of partial change of the approved matters for a new formulation of transdermal analgesic anti-inflammatory patches “Mohrus Paps XR 120 mg and 240 mg". This was done to reduce the irritation caused by existing additives. 

Product Launch in Pain Patch Market 

  • In March 2019, Teva Pharmaceutical Industries Ltd., one of the global leader in generic and specialty medicines, announced the launch of an authorized generic of Flector1 Patch, 1.3 %, in the U.S. This Flector patch is an important addition to Teva’s portfolio of over 40 generic pain management medicines. 

Business Expansion in Pain Patch Market 

  • In August 2022, Sorrento Therapeutics Inc., announced that, ZTlido (lidocaine topical system) 1.8% will be added to one of the largest National Pharmacy Benefit Managers (PBMs) and a national health plan – thereby expanding coverage to 30 million lives and Scilex will continue to work with them to access an additional 20 million lives. 

Key Benefits For Stakeholders

  • This report provides a quantitative analysis of the market segments, current trends, estimations, and dynamics of the pain patch market analysis from 2021 to 2031 to identify the prevailing pain patch market opportunities.
  • The market research is offered along with information related to key drivers, restraints, and opportunities.
  • Porter's five forces analysis highlights the potency of buyers and suppliers to enable stakeholders make profit-oriented business decisions and strengthen their supplier-buyer network.
  • In-depth analysis of the pain patch market segmentation assists to determine the prevailing pain patch market opportunity.
  • Major countries in each region are mapped according to their revenue contribution to the global market.
  • Market player positioning facilitates benchmarking and provides a clear understanding of the present position of the market players.
  • The report includes the analysis of the regional as well as global pain patch market trends, key players, market segments, application areas, and market growth strategies.

Pain Patch Market Report Highlights

Aspects Details
Market Size By 2031 USD 7.3 billion
Growth Rate CAGR of 4.3%
Forecast period 2021 - 2031
Report Pages 374
By Product Type
  • Non-Opioid Patches
    • Drugs
      • Nonsteroidal Anti-Inflammatory Drugs
      • Methyl Salicylate
      • Lidocaine
      • Others
  • Opioid Patches
    • Drugs
      • Buprenorphine
      • Fentanyl 
By Type
  • Prescription Medicines
  • OTC Medicines
By Distribution Channel
  • Hospital Pharmacies
  • Drug Stores and Retail Pharmacies
  • Online Providers
By Region
  • North America  (U.S., Canada, Mexico)
  • Europe  (Germany, France, UK, Italy, Spain, Rest of Europe)
  • Asia-Pacific  (Japan, China, India, Australia, South Korea, Rest of Asia-Pacific)
  • LAMEA  (Brazil, Saudi Arabia, South Africa, Rest of LAMEA)
Key Market Players NEXGEL Advanced Hydrogel Solutions, Sorrento Therapeutics Inc., Teva Pharmaceutical Industries Ltd., Grunenthal, Viatris Inc., Endo International plc., Purdue Pharma L.P., Amneal Pharmaceuticals LLC, Johnson and Johnson, Hisamitsu Pharmaceutical Co.,Inc.

Analyst Review

The increase in demand for novel pain management solutions and rise in investments for pain patches globally are expected to offer profitable opportunities for the expansion of the market. In addition, favorable government initiatives regarding awareness of effective pain management solutions and higher spending for development of novel drug delivery system, has piqued the interest of several companies to develop pain patches.?? 

The increase in adoption of pain patches owing to its advantages over traditional medications is expected to boost the growth of the market. In addition, increase in cases of chronic pain across the globe has resulted in rise in demand for novel drug delivery system, thus driving the growth of the market. Further, rise in number of patients suffering from bone pain conditions such as osteoarthritis and diabetic neuropathy, especially the geriatric population, is the major factor that drives the growth of the pain patch market.? 

Furthermore, North America accounted for largest share in 2021 and is expected to remain dominant during the forecast period owing to rise in prevalence of chronic pain cases, surge in disposable income of general population, higher awareness regarding pain patch, presence of key players offering pain patches and? developed healthcare infrastructure drive the growth of the pain patch market. However, Asia-Pacific is anticipated to witness notable growth, owing to increase in investments for development of pain patches, rise in geriatric population and number of pipeline medications for treating chronic pain conditions, thereby driving the growth of the market during the forecast period.? 


  • CHAPTER 1: INTRODUCTION

    • 1.1. Report description

    • 1.2. Key market segments

    • 1.3. Key benefits to the stakeholders

    • 1.4. Research Methodology

      • 1.4.1. Primary research

      • 1.4.2. Secondary research

      • 1.4.3. Analyst tools and models

  • CHAPTER 2: EXECUTIVE SUMMARY

    • 2.1. CXO Perspective

  • CHAPTER 3: MARKET OVERVIEW

    • 3.1. Market definition and scope

    • 3.2. Key findings

      • 3.2.1. Top impacting factors

      • 3.2.2. Top investment pockets

    • 3.3. Porter’s five forces analysis

      • 3.3.1. Bargaining power of suppliers

      • 3.3.2. Bargaining power of buyers

      • 3.3.3. Threat of substitutes

      • 3.3.4. Threat of new entrants

      • 3.3.5. Intensity of rivalry

    • 3.4. Market dynamics

      • 3.4.1. Drivers

        • 3.4.1.1. Technological advancement in pain patches
        • 3.4.1.2. Rise in prevalence of Chronic Pain
        • 3.4.1.3. Rising adoption of pain patch for pain management

      • 3.4.2. Restraints

        • 3.4.2.1. Availability of alternate treatments
        • 3.4.2.2. Stringent government regulations

      • 3.4.3. Opportunities

        • 3.4.3.1. Growth opportunities in emerging markets

    • 3.5. COVID-19 Impact Analysis on the market

  • CHAPTER 4: PAIN PATCH MARKET, BY PRODUCT TYPE

    • 4.1. Overview

      • 4.1.1. Market size and forecast

    • 4.2. Non-Opioid Patches

      • 4.2.1. Key market trends, growth factors and opportunities

      • 4.2.2. Market size and forecast, by region

      • 4.2.3. Market share analysis by country

      • 4.2.4. Non-Opioid Patches Pain Patch Market by Drugs

    • 4.3. Opioid Patches

      • 4.3.1. Key market trends, growth factors and opportunities

      • 4.3.2. Market size and forecast, by region

      • 4.3.3. Market share analysis by country

      • 4.3.4. Opioid Patches Pain Patch Market by Drugs

  • CHAPTER 5: PAIN PATCH MARKET, BY TYPE

    • 5.1. Overview

      • 5.1.1. Market size and forecast

    • 5.2. Prescription Medicines

      • 5.2.1. Key market trends, growth factors and opportunities

      • 5.2.2. Market size and forecast, by region

      • 5.2.3. Market share analysis by country

    • 5.3. OTC Medicines

      • 5.3.1. Key market trends, growth factors and opportunities

      • 5.3.2. Market size and forecast, by region

      • 5.3.3. Market share analysis by country

  • CHAPTER 6: PAIN PATCH MARKET, BY DISTRIBUTION CHANNEL

    • 6.1. Overview

      • 6.1.1. Market size and forecast

    • 6.2. Hospital Pharmacies

      • 6.2.1. Key market trends, growth factors and opportunities

      • 6.2.2. Market size and forecast, by region

      • 6.2.3. Market share analysis by country

    • 6.3. Drug Stores and Retail Pharmacies

      • 6.3.1. Key market trends, growth factors and opportunities

      • 6.3.2. Market size and forecast, by region

      • 6.3.3. Market share analysis by country

    • 6.4. Online Providers

      • 6.4.1. Key market trends, growth factors and opportunities

      • 6.4.2. Market size and forecast, by region

      • 6.4.3. Market share analysis by country

  • CHAPTER 7: PAIN PATCH MARKET, BY REGION

    • 7.1. Overview

      • 7.1.1. Market size and forecast By Region

    • 7.2. North America

      • 7.2.1. Key trends and opportunities

      • 7.2.2. Market size and forecast, by Product Type

      • 7.2.3. Market size and forecast, by Type

      • 7.2.4. Market size and forecast, by Distribution Channel

      • 7.2.5. Market size and forecast, by country

        • 7.2.5.1. U.S.
          • 7.2.5.1.1. Key market trends, growth factors and opportunities
          • 7.2.5.1.2. Market size and forecast, by Product Type
          • 7.2.5.1.3. Market size and forecast, by Type
          • 7.2.5.1.4. Market size and forecast, by Distribution Channel
        • 7.2.5.2. Canada
          • 7.2.5.2.1. Key market trends, growth factors and opportunities
          • 7.2.5.2.2. Market size and forecast, by Product Type
          • 7.2.5.2.3. Market size and forecast, by Type
          • 7.2.5.2.4. Market size and forecast, by Distribution Channel
        • 7.2.5.3. Mexico
          • 7.2.5.3.1. Key market trends, growth factors and opportunities
          • 7.2.5.3.2. Market size and forecast, by Product Type
          • 7.2.5.3.3. Market size and forecast, by Type
          • 7.2.5.3.4. Market size and forecast, by Distribution Channel
    • 7.3. Europe

      • 7.3.1. Key trends and opportunities

      • 7.3.2. Market size and forecast, by Product Type

      • 7.3.3. Market size and forecast, by Type

      • 7.3.4. Market size and forecast, by Distribution Channel

      • 7.3.5. Market size and forecast, by country

        • 7.3.5.1. Germany
          • 7.3.5.1.1. Key market trends, growth factors and opportunities
          • 7.3.5.1.2. Market size and forecast, by Product Type
          • 7.3.5.1.3. Market size and forecast, by Type
          • 7.3.5.1.4. Market size and forecast, by Distribution Channel
        • 7.3.5.2. France
          • 7.3.5.2.1. Key market trends, growth factors and opportunities
          • 7.3.5.2.2. Market size and forecast, by Product Type
          • 7.3.5.2.3. Market size and forecast, by Type
          • 7.3.5.2.4. Market size and forecast, by Distribution Channel
        • 7.3.5.3. UK
          • 7.3.5.3.1. Key market trends, growth factors and opportunities
          • 7.3.5.3.2. Market size and forecast, by Product Type
          • 7.3.5.3.3. Market size and forecast, by Type
          • 7.3.5.3.4. Market size and forecast, by Distribution Channel
        • 7.3.5.4. Italy
          • 7.3.5.4.1. Key market trends, growth factors and opportunities
          • 7.3.5.4.2. Market size and forecast, by Product Type
          • 7.3.5.4.3. Market size and forecast, by Type
          • 7.3.5.4.4. Market size and forecast, by Distribution Channel
        • 7.3.5.5. Spain
          • 7.3.5.5.1. Key market trends, growth factors and opportunities
          • 7.3.5.5.2. Market size and forecast, by Product Type
          • 7.3.5.5.3. Market size and forecast, by Type
          • 7.3.5.5.4. Market size and forecast, by Distribution Channel
        • 7.3.5.6. Rest of Europe
          • 7.3.5.6.1. Key market trends, growth factors and opportunities
          • 7.3.5.6.2. Market size and forecast, by Product Type
          • 7.3.5.6.3. Market size and forecast, by Type
          • 7.3.5.6.4. Market size and forecast, by Distribution Channel
    • 7.4. Asia-Pacific

      • 7.4.1. Key trends and opportunities

      • 7.4.2. Market size and forecast, by Product Type

      • 7.4.3. Market size and forecast, by Type

      • 7.4.4. Market size and forecast, by Distribution Channel

      • 7.4.5. Market size and forecast, by country

        • 7.4.5.1. Japan
          • 7.4.5.1.1. Key market trends, growth factors and opportunities
          • 7.4.5.1.2. Market size and forecast, by Product Type
          • 7.4.5.1.3. Market size and forecast, by Type
          • 7.4.5.1.4. Market size and forecast, by Distribution Channel
        • 7.4.5.2. China
          • 7.4.5.2.1. Key market trends, growth factors and opportunities
          • 7.4.5.2.2. Market size and forecast, by Product Type
          • 7.4.5.2.3. Market size and forecast, by Type
          • 7.4.5.2.4. Market size and forecast, by Distribution Channel
        • 7.4.5.3. India
          • 7.4.5.3.1. Key market trends, growth factors and opportunities
          • 7.4.5.3.2. Market size and forecast, by Product Type
          • 7.4.5.3.3. Market size and forecast, by Type
          • 7.4.5.3.4. Market size and forecast, by Distribution Channel
        • 7.4.5.4. Australia
          • 7.4.5.4.1. Key market trends, growth factors and opportunities
          • 7.4.5.4.2. Market size and forecast, by Product Type
          • 7.4.5.4.3. Market size and forecast, by Type
          • 7.4.5.4.4. Market size and forecast, by Distribution Channel
        • 7.4.5.5. South Korea
          • 7.4.5.5.1. Key market trends, growth factors and opportunities
          • 7.4.5.5.2. Market size and forecast, by Product Type
          • 7.4.5.5.3. Market size and forecast, by Type
          • 7.4.5.5.4. Market size and forecast, by Distribution Channel
        • 7.4.5.6. Rest of Asia-Pacific
          • 7.4.5.6.1. Key market trends, growth factors and opportunities
          • 7.4.5.6.2. Market size and forecast, by Product Type
          • 7.4.5.6.3. Market size and forecast, by Type
          • 7.4.5.6.4. Market size and forecast, by Distribution Channel
    • 7.5. LAMEA

      • 7.5.1. Key trends and opportunities

      • 7.5.2. Market size and forecast, by Product Type

      • 7.5.3. Market size and forecast, by Type

      • 7.5.4. Market size and forecast, by Distribution Channel

      • 7.5.5. Market size and forecast, by country

        • 7.5.5.1. Brazil
          • 7.5.5.1.1. Key market trends, growth factors and opportunities
          • 7.5.5.1.2. Market size and forecast, by Product Type
          • 7.5.5.1.3. Market size and forecast, by Type
          • 7.5.5.1.4. Market size and forecast, by Distribution Channel
        • 7.5.5.2. Saudi Arabia
          • 7.5.5.2.1. Key market trends, growth factors and opportunities
          • 7.5.5.2.2. Market size and forecast, by Product Type
          • 7.5.5.2.3. Market size and forecast, by Type
          • 7.5.5.2.4. Market size and forecast, by Distribution Channel
        • 7.5.5.3. South Africa
          • 7.5.5.3.1. Key market trends, growth factors and opportunities
          • 7.5.5.3.2. Market size and forecast, by Product Type
          • 7.5.5.3.3. Market size and forecast, by Type
          • 7.5.5.3.4. Market size and forecast, by Distribution Channel
        • 7.5.5.4. Rest of LAMEA
          • 7.5.5.4.1. Key market trends, growth factors and opportunities
          • 7.5.5.4.2. Market size and forecast, by Product Type
          • 7.5.5.4.3. Market size and forecast, by Type
          • 7.5.5.4.4. Market size and forecast, by Distribution Channel
  • CHAPTER 8: COMPETITIVE LANDSCAPE

    • 8.1. Introduction

    • 8.2. Top winning strategies

    • 8.3. Product Mapping of Top 10 Player

    • 8.4. Competitive Dashboard

    • 8.5. Competitive Heatmap

    • 8.6. Top player positioning, 2021

  • CHAPTER 9: COMPANY PROFILES

    • 9.1. Viatris Inc.

      • 9.1.1. Company overview

      • 9.1.2. Key Executives

      • 9.1.3. Company snapshot

      • 9.1.4. Operating business segments

      • 9.1.5. Product portfolio

      • 9.1.6. Business performance

    • 9.2. Johnson and Johnson

      • 9.2.1. Company overview

      • 9.2.2. Key Executives

      • 9.2.3. Company snapshot

      • 9.2.4. Operating business segments

      • 9.2.5. Product portfolio

      • 9.2.6. Business performance

    • 9.3. Teva Pharmaceutical Industries Ltd.

      • 9.3.1. Company overview

      • 9.3.2. Key Executives

      • 9.3.3. Company snapshot

      • 9.3.4. Operating business segments

      • 9.3.5. Product portfolio

      • 9.3.6. Business performance

      • 9.3.7. Key strategic moves and developments

    • 9.4. Hisamitsu Pharmaceutical Co.,Inc.

      • 9.4.1. Company overview

      • 9.4.2. Key Executives

      • 9.4.3. Company snapshot

      • 9.4.4. Operating business segments

      • 9.4.5. Product portfolio

      • 9.4.6. Business performance

      • 9.4.7. Key strategic moves and developments

    • 9.5. Endo International plc.

      • 9.5.1. Company overview

      • 9.5.2. Key Executives

      • 9.5.3. Company snapshot

      • 9.5.4. Operating business segments

      • 9.5.5. Product portfolio

      • 9.5.6. Business performance

    • 9.6. NEXGEL Advanced Hydrogel Solutions

      • 9.6.1. Company overview

      • 9.6.2. Key Executives

      • 9.6.3. Company snapshot

      • 9.6.4. Operating business segments

      • 9.6.5. Product portfolio

    • 9.7. Purdue Pharma L.P.

      • 9.7.1. Company overview

      • 9.7.2. Key Executives

      • 9.7.3. Company snapshot

      • 9.7.4. Operating business segments

      • 9.7.5. Product portfolio

    • 9.8. Sorrento Therapeutics Inc.

      • 9.8.1. Company overview

      • 9.8.2. Key Executives

      • 9.8.3. Company snapshot

      • 9.8.4. Operating business segments

      • 9.8.5. Product portfolio

      • 9.8.6. Key strategic moves and developments

    • 9.9. Amneal Pharmaceuticals LLC

      • 9.9.1. Company overview

      • 9.9.2. Key Executives

      • 9.9.3. Company snapshot

      • 9.9.4. Operating business segments

      • 9.9.5. Product portfolio

      • 9.9.6. Business performance

      • 9.9.7. Key strategic moves and developments

    • 9.10. Grunenthal

      • 9.10.1. Company overview

      • 9.10.2. Key Executives

      • 9.10.3. Company snapshot

      • 9.10.4. Operating business segments

      • 9.10.5. Product portfolio

      • 9.10.6. Business performance

      • 9.10.7. Key strategic moves and developments

  • LIST OF TABLES

  • TABLE 01. GLOBAL PAIN PATCH MARKET, BY PRODUCT TYPE, 2021-2031 ($MILLION)
    TABLE 02. PAIN PATCH MARKET FOR NON-OPIOID PATCHES, BY REGION, 2021-2031 ($MILLION)
    TABLE 03. GLOBAL NON-OPIOID PATCHES PAIN PATCH MARKET, BY DRUGS, 2021-2031 ($MILLION)
    TABLE 04. PAIN PATCH MARKET FOR OPIOID PATCHES, BY REGION, 2021-2031 ($MILLION)
    TABLE 05. GLOBAL OPIOID PATCHES PAIN PATCH MARKET, BY DRUGS, 2021-2031 ($MILLION)
    TABLE 06. GLOBAL PAIN PATCH MARKET, BY TYPE, 2021-2031 ($MILLION)
    TABLE 07. PAIN PATCH MARKET FOR PRESCRIPTION MEDICINES, BY REGION, 2021-2031 ($MILLION)
    TABLE 08. PAIN PATCH MARKET FOR OTC MEDICINES, BY REGION, 2021-2031 ($MILLION)
    TABLE 09. GLOBAL PAIN PATCH MARKET, BY DISTRIBUTION CHANNEL, 2021-2031 ($MILLION)
    TABLE 10. PAIN PATCH MARKET FOR HOSPITAL PHARMACIES, BY REGION, 2021-2031 ($MILLION)
    TABLE 11. PAIN PATCH MARKET FOR DRUG STORES AND RETAIL PHARMACIES, BY REGION, 2021-2031 ($MILLION)
    TABLE 12. PAIN PATCH MARKET FOR ONLINE PROVIDERS, BY REGION, 2021-2031 ($MILLION)
    TABLE 13. PAIN PATCH MARKET, BY REGION, 2021-2031 ($MILLION)
    TABLE 14. NORTH AMERICA PAIN PATCH MARKET, BY PRODUCT TYPE, 2021-2031 ($MILLION)
    TABLE 15. NORTH AMERICA PAIN PATCH MARKET, BY TYPE, 2021-2031 ($MILLION)
    TABLE 16. NORTH AMERICA PAIN PATCH MARKET, BY DISTRIBUTION CHANNEL, 2021-2031 ($MILLION)
    TABLE 17. NORTH AMERICA PAIN PATCH MARKET, BY COUNTRY, 2021-2031 ($MILLION)
    TABLE 18. U.S. PAIN PATCH MARKET, BY PRODUCT TYPE, 2021-2031 ($MILLION)
    TABLE 19. U.S. PAIN PATCH MARKET, BY TYPE, 2021-2031 ($MILLION)
    TABLE 20. U.S. PAIN PATCH MARKET, BY DISTRIBUTION CHANNEL, 2021-2031 ($MILLION)
    TABLE 21. CANADA PAIN PATCH MARKET, BY PRODUCT TYPE, 2021-2031 ($MILLION)
    TABLE 22. CANADA PAIN PATCH MARKET, BY TYPE, 2021-2031 ($MILLION)
    TABLE 23. CANADA PAIN PATCH MARKET, BY DISTRIBUTION CHANNEL, 2021-2031 ($MILLION)
    TABLE 24. MEXICO PAIN PATCH MARKET, BY PRODUCT TYPE, 2021-2031 ($MILLION)
    TABLE 25. MEXICO PAIN PATCH MARKET, BY TYPE, 2021-2031 ($MILLION)
    TABLE 26. MEXICO PAIN PATCH MARKET, BY DISTRIBUTION CHANNEL, 2021-2031 ($MILLION)
    TABLE 27. EUROPE PAIN PATCH MARKET, BY PRODUCT TYPE, 2021-2031 ($MILLION)
    TABLE 28. EUROPE PAIN PATCH MARKET, BY TYPE, 2021-2031 ($MILLION)
    TABLE 29. EUROPE PAIN PATCH MARKET, BY DISTRIBUTION CHANNEL, 2021-2031 ($MILLION)
    TABLE 30. EUROPE PAIN PATCH MARKET, BY COUNTRY, 2021-2031 ($MILLION)
    TABLE 31. GERMANY PAIN PATCH MARKET, BY PRODUCT TYPE, 2021-2031 ($MILLION)
    TABLE 32. GERMANY PAIN PATCH MARKET, BY TYPE, 2021-2031 ($MILLION)
    TABLE 33. GERMANY PAIN PATCH MARKET, BY DISTRIBUTION CHANNEL, 2021-2031 ($MILLION)
    TABLE 34. FRANCE PAIN PATCH MARKET, BY PRODUCT TYPE, 2021-2031 ($MILLION)
    TABLE 35. FRANCE PAIN PATCH MARKET, BY TYPE, 2021-2031 ($MILLION)
    TABLE 36. FRANCE PAIN PATCH MARKET, BY DISTRIBUTION CHANNEL, 2021-2031 ($MILLION)
    TABLE 37. UK PAIN PATCH MARKET, BY PRODUCT TYPE, 2021-2031 ($MILLION)
    TABLE 38. UK PAIN PATCH MARKET, BY TYPE, 2021-2031 ($MILLION)
    TABLE 39. UK PAIN PATCH MARKET, BY DISTRIBUTION CHANNEL, 2021-2031 ($MILLION)
    TABLE 40. ITALY PAIN PATCH MARKET, BY PRODUCT TYPE, 2021-2031 ($MILLION)
    TABLE 41. ITALY PAIN PATCH MARKET, BY TYPE, 2021-2031 ($MILLION)
    TABLE 42. ITALY PAIN PATCH MARKET, BY DISTRIBUTION CHANNEL, 2021-2031 ($MILLION)
    TABLE 43. SPAIN PAIN PATCH MARKET, BY PRODUCT TYPE, 2021-2031 ($MILLION)
    TABLE 44. SPAIN PAIN PATCH MARKET, BY TYPE, 2021-2031 ($MILLION)
    TABLE 45. SPAIN PAIN PATCH MARKET, BY DISTRIBUTION CHANNEL, 2021-2031 ($MILLION)
    TABLE 46. REST OF EUROPE PAIN PATCH MARKET, BY PRODUCT TYPE, 2021-2031 ($MILLION)
    TABLE 47. REST OF EUROPE PAIN PATCH MARKET, BY TYPE, 2021-2031 ($MILLION)
    TABLE 48. REST OF EUROPE PAIN PATCH MARKET, BY DISTRIBUTION CHANNEL, 2021-2031 ($MILLION)
    TABLE 49. ASIA-PACIFIC PAIN PATCH MARKET, BY PRODUCT TYPE, 2021-2031 ($MILLION)
    TABLE 50. ASIA-PACIFIC PAIN PATCH MARKET, BY TYPE, 2021-2031 ($MILLION)
    TABLE 51. ASIA-PACIFIC PAIN PATCH MARKET, BY DISTRIBUTION CHANNEL, 2021-2031 ($MILLION)
    TABLE 52. ASIA-PACIFIC PAIN PATCH MARKET, BY COUNTRY, 2021-2031 ($MILLION)
    TABLE 53. JAPAN PAIN PATCH MARKET, BY PRODUCT TYPE, 2021-2031 ($MILLION)
    TABLE 54. JAPAN PAIN PATCH MARKET, BY TYPE, 2021-2031 ($MILLION)
    TABLE 55. JAPAN PAIN PATCH MARKET, BY DISTRIBUTION CHANNEL, 2021-2031 ($MILLION)
    TABLE 56. CHINA PAIN PATCH MARKET, BY PRODUCT TYPE, 2021-2031 ($MILLION)
    TABLE 57. CHINA PAIN PATCH MARKET, BY TYPE, 2021-2031 ($MILLION)
    TABLE 58. CHINA PAIN PATCH MARKET, BY DISTRIBUTION CHANNEL, 2021-2031 ($MILLION)
    TABLE 59. INDIA PAIN PATCH MARKET, BY PRODUCT TYPE, 2021-2031 ($MILLION)
    TABLE 60. INDIA PAIN PATCH MARKET, BY TYPE, 2021-2031 ($MILLION)
    TABLE 61. INDIA PAIN PATCH MARKET, BY DISTRIBUTION CHANNEL, 2021-2031 ($MILLION)
    TABLE 62. AUSTRALIA PAIN PATCH MARKET, BY PRODUCT TYPE, 2021-2031 ($MILLION)
    TABLE 63. AUSTRALIA PAIN PATCH MARKET, BY TYPE, 2021-2031 ($MILLION)
    TABLE 64. AUSTRALIA PAIN PATCH MARKET, BY DISTRIBUTION CHANNEL, 2021-2031 ($MILLION)
    TABLE 65. SOUTH KOREA PAIN PATCH MARKET, BY PRODUCT TYPE, 2021-2031 ($MILLION)
    TABLE 66. SOUTH KOREA PAIN PATCH MARKET, BY TYPE, 2021-2031 ($MILLION)
    TABLE 67. SOUTH KOREA PAIN PATCH MARKET, BY DISTRIBUTION CHANNEL, 2021-2031 ($MILLION)
    TABLE 68. REST OF ASIA-PACIFIC PAIN PATCH MARKET, BY PRODUCT TYPE, 2021-2031 ($MILLION)
    TABLE 69. REST OF ASIA-PACIFIC PAIN PATCH MARKET, BY TYPE, 2021-2031 ($MILLION)
    TABLE 70. REST OF ASIA-PACIFIC PAIN PATCH MARKET, BY DISTRIBUTION CHANNEL, 2021-2031 ($MILLION)
    TABLE 71. LAMEA PAIN PATCH MARKET, BY PRODUCT TYPE, 2021-2031 ($MILLION)
    TABLE 72. LAMEA PAIN PATCH MARKET, BY TYPE, 2021-2031 ($MILLION)
    TABLE 73. LAMEA PAIN PATCH MARKET, BY DISTRIBUTION CHANNEL, 2021-2031 ($MILLION)
    TABLE 74. LAMEA PAIN PATCH MARKET, BY COUNTRY, 2021-2031 ($MILLION)
    TABLE 75. BRAZIL PAIN PATCH MARKET, BY PRODUCT TYPE, 2021-2031 ($MILLION)
    TABLE 76. BRAZIL PAIN PATCH MARKET, BY TYPE, 2021-2031 ($MILLION)
    TABLE 77. BRAZIL PAIN PATCH MARKET, BY DISTRIBUTION CHANNEL, 2021-2031 ($MILLION)
    TABLE 78. SAUDI ARABIA PAIN PATCH MARKET, BY PRODUCT TYPE, 2021-2031 ($MILLION)
    TABLE 79. SAUDI ARABIA PAIN PATCH MARKET, BY TYPE, 2021-2031 ($MILLION)
    TABLE 80. SAUDI ARABIA PAIN PATCH MARKET, BY DISTRIBUTION CHANNEL, 2021-2031 ($MILLION)
    TABLE 81. SOUTH AFRICA PAIN PATCH MARKET, BY PRODUCT TYPE, 2021-2031 ($MILLION)
    TABLE 82. SOUTH AFRICA PAIN PATCH MARKET, BY TYPE, 2021-2031 ($MILLION)
    TABLE 83. SOUTH AFRICA PAIN PATCH MARKET, BY DISTRIBUTION CHANNEL, 2021-2031 ($MILLION)
    TABLE 84. REST OF LAMEA PAIN PATCH MARKET, BY PRODUCT TYPE, 2021-2031 ($MILLION)
    TABLE 85. REST OF LAMEA PAIN PATCH MARKET, BY TYPE, 2021-2031 ($MILLION)
    TABLE 86. REST OF LAMEA PAIN PATCH MARKET, BY DISTRIBUTION CHANNEL, 2021-2031 ($MILLION)
    TABLE 87. VIATRIS INC.: KEY EXECUTIVES
    TABLE 88. VIATRIS INC.: COMPANY SNAPSHOT
    TABLE 89. VIATRIS INC.: PRODUCT SEGMENTS
    TABLE 90. VIATRIS INC.: PRODUCT PORTFOLIO
    TABLE 91. JOHNSON AND JOHNSON: KEY EXECUTIVES
    TABLE 92. JOHNSON AND JOHNSON: COMPANY SNAPSHOT
    TABLE 93. JOHNSON AND JOHNSON: PRODUCT SEGMENTS
    TABLE 94. JOHNSON AND JOHNSON: PRODUCT PORTFOLIO
    TABLE 95. TEVA PHARMACEUTICAL INDUSTRIES LTD.: KEY EXECUTIVES
    TABLE 96. TEVA PHARMACEUTICAL INDUSTRIES LTD.: COMPANY SNAPSHOT
    TABLE 97. TEVA PHARMACEUTICAL INDUSTRIES LTD.: PRODUCT SEGMENTS
    TABLE 98. TEVA PHARMACEUTICAL INDUSTRIES LTD.: PRODUCT PORTFOLIO
    TABLE 99. TEVA PHARMACEUTICAL INDUSTRIES LTD.: KEY STRATERGIES
    TABLE 100. HISAMITSU PHARMACEUTICAL CO.,INC.: KEY EXECUTIVES
    TABLE 101. HISAMITSU PHARMACEUTICAL CO.,INC.: COMPANY SNAPSHOT
    TABLE 102. HISAMITSU PHARMACEUTICAL CO.,INC.: PRODUCT SEGMENTS
    TABLE 103. HISAMITSU PHARMACEUTICAL CO.,INC.: PRODUCT PORTFOLIO
    TABLE 104. HISAMITSU PHARMACEUTICAL CO.,INC.: KEY STRATERGIES
    TABLE 105. ENDO INTERNATIONAL PLC.: KEY EXECUTIVES
    TABLE 106. ENDO INTERNATIONAL PLC.: COMPANY SNAPSHOT
    TABLE 107. ENDO INTERNATIONAL PLC.: PRODUCT SEGMENTS
    TABLE 108. ENDO INTERNATIONAL PLC.: PRODUCT PORTFOLIO
    TABLE 109. NEXGEL ADVANCED HYDROGEL SOLUTIONS: KEY EXECUTIVES
    TABLE 110. NEXGEL ADVANCED HYDROGEL SOLUTIONS: COMPANY SNAPSHOT
    TABLE 111. NEXGEL ADVANCED HYDROGEL SOLUTIONS: PRODUCT SEGMENTS
    TABLE 112. NEXGEL ADVANCED HYDROGEL SOLUTIONS: PRODUCT PORTFOLIO
    TABLE 113. PURDUE PHARMA L.P.: KEY EXECUTIVES
    TABLE 114. PURDUE PHARMA L.P.: COMPANY SNAPSHOT
    TABLE 115. PURDUE PHARMA L.P.: PRODUCT SEGMENTS
    TABLE 116. PURDUE PHARMA L.P.: PRODUCT PORTFOLIO
    TABLE 117. SORRENTO THERAPEUTICS INC.: KEY EXECUTIVES
    TABLE 118. SORRENTO THERAPEUTICS INC.: COMPANY SNAPSHOT
    TABLE 119. SORRENTO THERAPEUTICS INC.: PRODUCT SEGMENTS
    TABLE 120. SORRENTO THERAPEUTICS INC.: PRODUCT PORTFOLIO
    TABLE 121. SORRENTO THERAPEUTICS INC.: KEY STRATERGIES
    TABLE 122. AMNEAL PHARMACEUTICALS LLC: KEY EXECUTIVES
    TABLE 123. AMNEAL PHARMACEUTICALS LLC: COMPANY SNAPSHOT
    TABLE 124. AMNEAL PHARMACEUTICALS LLC: PRODUCT SEGMENTS
    TABLE 125. AMNEAL PHARMACEUTICALS LLC: PRODUCT PORTFOLIO
    TABLE 126. AMNEAL PHARMACEUTICALS LLC: KEY STRATERGIES
    TABLE 127. GRUNENTHAL: KEY EXECUTIVES
    TABLE 128. GRUNENTHAL: COMPANY SNAPSHOT
    TABLE 129. GRUNENTHAL: PRODUCT SEGMENTS
    TABLE 130. GRUNENTHAL: PRODUCT PORTFOLIO
    TABLE 131. GRUNENTHAL: KEY STRATERGIES
  • LIST OF FIGURES

  • FIGURE 01. PAIN PATCH MARKET, 2021-2031
    FIGURE 02. SEGMENTATION OF PAIN PATCH MARKET, 2021-2031
    FIGURE 03. TOP INVESTMENT POCKETS IN PAIN PATCH MARKET (2022-2031)
    FIGURE 04. LOW BARGAINING POWER OF SUPPLIERS
    FIGURE 05. LOW BARGAINING POWER OF BUYERS
    FIGURE 06. LOW THREAT OF SUBSTITUTES
    FIGURE 07. LOW THREAT OF NEW ENTRANTS
    FIGURE 08. LOW INTENSITY OF RIVALRY
    FIGURE 09. DRIVERS, RESTRAINTS AND OPPORTUNITIES: GLOBALPAIN PATCH MARKET
    FIGURE 10. PAIN PATCH MARKET, BY PRODUCT TYPE, 2021(%)
    FIGURE 11. COMPARATIVE SHARE ANALYSIS OF PAIN PATCH MARKET FOR NON-OPIOID PATCHES, BY COUNTRY 2021-2031(%)
    FIGURE 12. COMPARATIVE SHARE ANALYSIS OF PAIN PATCH MARKET FOR OPIOID PATCHES, BY COUNTRY 2021-2031(%)
    FIGURE 13. PAIN PATCH MARKET, BY TYPE, 2021(%)
    FIGURE 14. COMPARATIVE SHARE ANALYSIS OF PAIN PATCH MARKET FOR PRESCRIPTION MEDICINES, BY COUNTRY 2021-2031(%)
    FIGURE 15. COMPARATIVE SHARE ANALYSIS OF PAIN PATCH MARKET FOR OTC MEDICINES, BY COUNTRY 2021-2031(%)
    FIGURE 16. PAIN PATCH MARKET, BY DISTRIBUTION CHANNEL, 2021(%)
    FIGURE 17. COMPARATIVE SHARE ANALYSIS OF PAIN PATCH MARKET FOR HOSPITAL PHARMACIES, BY COUNTRY 2021-2031(%)
    FIGURE 18. COMPARATIVE SHARE ANALYSIS OF PAIN PATCH MARKET FOR DRUG STORES AND RETAIL PHARMACIES, BY COUNTRY 2021-2031(%)
    FIGURE 19. COMPARATIVE SHARE ANALYSIS OF PAIN PATCH MARKET FOR ONLINE PROVIDERS, BY COUNTRY 2021-2031(%)
    FIGURE 20. PAIN PATCH MARKET BY REGION, 2021
    FIGURE 21. U.S. PAIN PATCH MARKET, 2021-2031 ($MILLION)
    FIGURE 22. CANADA PAIN PATCH MARKET, 2021-2031 ($MILLION)
    FIGURE 23. MEXICO PAIN PATCH MARKET, 2021-2031 ($MILLION)
    FIGURE 24. GERMANY PAIN PATCH MARKET, 2021-2031 ($MILLION)
    FIGURE 25. FRANCE PAIN PATCH MARKET, 2021-2031 ($MILLION)
    FIGURE 26. UK PAIN PATCH MARKET, 2021-2031 ($MILLION)
    FIGURE 27. ITALY PAIN PATCH MARKET, 2021-2031 ($MILLION)
    FIGURE 28. SPAIN PAIN PATCH MARKET, 2021-2031 ($MILLION)
    FIGURE 29. REST OF EUROPE PAIN PATCH MARKET, 2021-2031 ($MILLION)
    FIGURE 30. JAPAN PAIN PATCH MARKET, 2021-2031 ($MILLION)
    FIGURE 31. CHINA PAIN PATCH MARKET, 2021-2031 ($MILLION)
    FIGURE 32. INDIA PAIN PATCH MARKET, 2021-2031 ($MILLION)
    FIGURE 33. AUSTRALIA PAIN PATCH MARKET, 2021-2031 ($MILLION)
    FIGURE 34. SOUTH KOREA PAIN PATCH MARKET, 2021-2031 ($MILLION)
    FIGURE 35. REST OF ASIA-PACIFIC PAIN PATCH MARKET, 2021-2031 ($MILLION)
    FIGURE 36. BRAZIL PAIN PATCH MARKET, 2021-2031 ($MILLION)
    FIGURE 37. SAUDI ARABIA PAIN PATCH MARKET, 2021-2031 ($MILLION)
    FIGURE 38. SOUTH AFRICA PAIN PATCH MARKET, 2021-2031 ($MILLION)
    FIGURE 39. REST OF LAMEA PAIN PATCH MARKET, 2021-2031 ($MILLION)
    FIGURE 40. TOP WINNING STRATEGIES, BY YEAR
    FIGURE 41. TOP WINNING STRATEGIES, BY DEVELOPMENT
    FIGURE 42. TOP WINNING STRATEGIES, BY COMPANY
    FIGURE 43. PRODUCT MAPPING OF TOP 10 PLAYERS
    FIGURE 44. COMPETITIVE DASHBOARD
    FIGURE 45. COMPETITIVE HEATMAP: PAIN PATCH MARKET
    FIGURE 46. TOP PLAYER POSITIONING, 2021
    FIGURE 47. VIATRIS INC.: NET SALES, 2020-2022 ($MILLION)
    FIGURE 48. VIATRIS INC.: REVENUE SHARE BY SEGMENT, 2022 (%)
    FIGURE 49. JOHNSON AND JOHNSON: SALES REVENUE, 2019-2021 ($MILLION)
    FIGURE 50. JOHNSON AND JOHNSON: REVENUE SHARE BY SEGMENT, 2021 (%)
    FIGURE 51. JOHNSON AND JOHNSON: REVENUE SHARE BY REGION, 2021 (%)
    FIGURE 52. TEVA PHARMACEUTICAL INDUSTRIES LTD.: NET REVENUE, 2019-2021 ($MILLION)
    FIGURE 53. TEVA PHARMACEUTICAL INDUSTRIES LTD.: REVENUE SHARE BY SEGMENT, 2021 (%)
    FIGURE 54. HISAMITSU PHARMACEUTICAL CO.,INC.: NET SALES, 2020-2022 ($MILLION)
    FIGURE 55. ENDO INTERNATIONAL PLC.: NET REVENUE, 2019-2021 ($MILLION)
    FIGURE 56. ENDO INTERNATIONAL PLC.: REVENUE SHARE BY SEGMENT, 2021 (%)
    FIGURE 57. AMNEAL PHARMACEUTICALS LLC: NET REVENUE, 2019-2021 ($MILLION)
    FIGURE 58. AMNEAL PHARMACEUTICALS LLC: REVENUE SHARE BY SEGMENT, 2021 (%)
    FIGURE 59. GRUNENTHAL: NET REVENUE, 2019-2021 ($MILLION)
    FIGURE 60. GRUNENTHAL: REVENUE SHARE BY SEGMENT, 2021 (%)
    FIGURE 61. GRUNENTHAL: REVENUE SHARE BY REGION, 2021 (%)


PURCHASE OPTIONS

Call or Email us

U.S.-Canada Toll-free: +1-800-792-5285
Int'l : +1-503-894-6022
Europe : +44-845-528-1300
Email : help@alliedmarketresearch.com
 
FREQUENTLY ASKED QUESTIONS?

A. The market value of pain patch market in 2031 is $7,338.07 million

A. The base year is 2021 in pain patch market.

A. Pain patches are transdermal patches that deliver medication through the skin to provide pain relief.

A. Top companies such as, Hisamitsu Pharmaceutical Co.,Inc., Amneal Pharmaceuticals LLC, Johnson & Johnson., and Viatris Inc., held a high market position in 2021. These key players held a high market postion owing to the strong geographical foothold in North America, Europe, Asia-Pacific, and LAMEA.

A. The major factor that fuels the growth of the pain patch market are rise in adoption of pain patches for pain management, increase in cases of chronic pain diseases and rise in research activities related to effective pain management formulations

A. The non-opioid is the most influencing segment in pain patch market, owing to increase in demand for alternative pain management options that can provide effective relief without the risks associated with opioids and rise in number of key players offering novel formulations.

A. The total market value of pain patch market is $4,803.70 million in 2021.

A. The forecast period for pain patch market is 2022 to 2031

Looking for Customization?

 Customization Request

Have a Question?

 Speak with Analyst

Any Confusion?

 Inquire Before Buying

Have a glance of the Report

  Request Sample
RELATED TAGS

Purchase Full Report of
Pain Patch Market

Start reading instantly.
This Report and over 67,068+ more Reports, Available with Avenue Library. T&C*.

  • Online Only
  • $3,570
  • Online cloud access only
  • Restricted print, copy, paste & download
  • Read only
  • Free industry update
    (Within 180 days)
  • Free report update in next update cycle
    (Mar 2024 - Mar 2025)
  • Data Pack
  • $3,840
  • Restricted to one authorized user
  • One print only
  • Available in
    Excel
  • Free industry update
    (Within 180 days)
  •   Free report update in next update cycle
    (Mar 2024 - Mar 2025)
  • Single User
  • $5,730
  • Restricted to one authorized user
  • One print only
  • Available in
    PDF
  • Free industry update
    (Within 180 days)
  •   Free report update in next update cycle
    (Mar 2024 - Mar 2025)
  • Five Users
  • $6,450
  • Limited to five authorized users
  • Print upto five copies
  • Available in
    PDF
  • Free industry update
    (Within 180 days)
  •   Free report update in next update cycle
    (Mar 2024 - Mar 2025)
  • Enterprise
    License/PDF

  • $9,600
  • Unlimited
    within
    company/enterprise
  • Available in Excel & PDF
  • Free industry update
    (Within 180 days)
  •   Free report update in next update cycle
    (Mar 2024 - Mar 2025)
  • Library
    Membership

  • $999 $ 1,175
    Per User/ Per month/ Billed annually
  • Published Content
    E-access
  • Company Profiles
    E-access
  • Newly Added Content Access
  • 10 PDF
    Downloads
  • 5 Excel Data
    Pack Downloads
  • 250 Company Profiles PDF Downloads
  • Buy Now

*Taxes/Fees, if applicable will be added during checkout. All prices in USD

RELATED REPORTS
 

Why Allied Market Research?


Infallible Methodology

To ensure high-level data integrity, accurate analysis, and impeccable forecasts

Analyst Support

For complete satisfaction

Customization

On-demand customization of scope of the report to exactly meet your needs

TARGETED MARKET VIEW

Targeted market view to provide pertinent information and save time of readers

Get fresh content delivered

Get insights on topics that are crucial for your business. Stay abreast of your interest areas.

Get Industry Data Alerts

Why Allied Market Research?

Infallible Methodology

To ensure high-level data integrity, accurate analysis, and impeccable forecasts

Analyst Support

For complete satisfaction

Customization

On-demand customization of scope of the report to exactly meet your needs

TARGETED MARKET VIEW

Targeted market view to provide pertinent information and save time of readers