0
New
New
2023
Pallets Market

Pallets Market

by Material (Wood, Plastic via Injection Molding, Plastic via Other Methods, Corrugated Paper, Metal), by Type (Rackable, Nestable, Stackable, Display), by Application (Rental, Non-rental), by End-user (Food and Beverage, Chemical, Retail, Pharmaceutical, Others): Global Opportunity Analysis and Industry Forecast, 2023-2032

Report Code: A10557
May 2023 | Pages: 340
Tables: 303
Charts: 71
  • Formats*:

  • pdf

    Single User License, Five User
    License & Enterprise User License

  • xls

    Data Pack Excel License

  • ppt

    It comes with the additional cost
    of $2500.00 contact sales.


Pallets Market Research, 2032

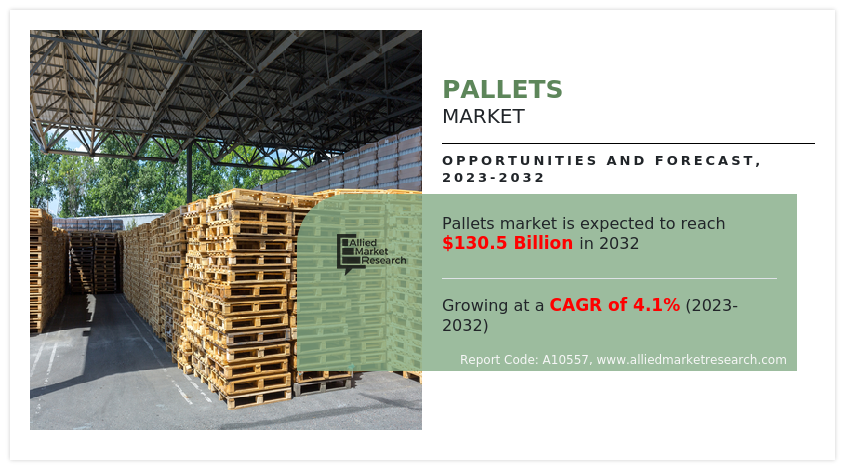
The global pallets market size was valued at $57.4 billion in 2010, and is projected to reach $130.5 billion by 2032, growing at a CAGR of 4.1% from 2023 to 2032. Pallets are a tertiary form of packaging that can be used for stacking, storing, protecting, or transporting of goods in supply chains. It is utilized as a base for unitization of goods for logistics and warehousing. Moreover, pallets can be manufactured using materials such as wood, plastic, metal, and corrugated paper, which can be handled using material handling equipment such as forklifts, pallet jacks, or conveyors. Pallets find applications in nearly all supply chains including industries such as chemicals, food & beverage, retail, and others.
The pallets market was severely hampered during the lockdown period owing to the outbreak of COVID-19. Warehousing and supply chain sectors were most affected. However, the market recovered by the end of 2021.

Pallets Market

Market dynamics

The unprecedented growth in e-commerce industry is expected to drive the demand for pallets on a significant scale. The COVID-19 pandemic has enhanced the inclination of population towards e-commerce platforms, especially in countries such as India and others, where e-commerce had lesser prevalence. The rise in e-commerce has challenged supply chains to develop transportation and logistics to control flow and cost of outgoing and incoming goods. Online orders are generally in smaller quantities and more frequent, thus requiring more assets for goods management. This creates a demand for pallets for e-commerce-based logistics, which in turn drives the pallets market growth.

Moreover, the rise in focus toward sustainable packaging and pallets is also expected to drive the growth of the pallets market . The majority of the pallets in use today are produced with wood and are one of the largest contributors to municipal solid waste (MSW). In addition, the waste wooden pallets are rich in energy, which is generally wasted during MSW disposal. Thus, companies are now adopting recycling techniques to reduce the wastage of wood for pallet manufacturing. For instance, companies such as Brambles, Ltd., based in Australia, and CABKA Group GmbH based in Germany, are striving toward production of fully recyclable or 100% reusable wooden and plastic pallets.

However, the fluctuations in prices of wood, especially in Europe and North America, limit the growth of the pallets market. Europe and North America are the largest consumers of wooden pallets collectively, hence, the price changes in lumber affect the consumer patterns in the pallets industry. In addition, the outbreak of the COVID-19 pandemic has negatively affected the international trade and manufacturing supply chains. This affected the demand for pallets.

The demand for pallets decreased in 2020, owing to low demand from different industries due to lockdowns imposed by the government of many countries. The COVID-19 pandemic had shut down the production of various industries, mainly owing to prolonged lockdowns in major global countries. This hampered the growth of the pallets market significantly during the pandemic. The major demand for pallets was previously noticed from giant manufacturing countries including the U.S., Germany, Italy, the UK, and China, which was severely affected by the spread of coronavirus, thereby halting demand for pallets. Moreover, the market has recovered due to the launch of COVID-19 vaccine and the government has relaxed the lockdown norms.

On the contrary, the adoption of new technologies in supply chains such as use of internet of things (IoT), automation, collaborative robots (cobots), and others, can promote pallet manufacturers to produce pallets with RFID tags, GPS sensors, and others, which can create new opportunities for pallets in the near future.

Segmental Overview

The global pallets market is segmented on the basis of material, type, application, end-user industry, and region. By material, it is classified into wood, plastic via injection molding, plastic via other methods, corrugated paper, and metal. By type, it is categorized into rackable, nestable, stackable, and display pallets. By application, it is categorized into rental and non-rental. By end-user industry, it is categorized into food & beverage, chemical, retail, pharmaceutical, and others.

Region wise, the market is analyzed across North America (the U.S., Canada, and Mexico), Europe (the UK, France, Germany, Italy, and rest of Europe), Asia-Pacific (China, Japan, India, Indonesia, Malaysia, Thailand, Vietnam, Cambodia, Lao, and rest of Asia-Pacific), and LAMEA (Latin America, the Middle East, and Africa).

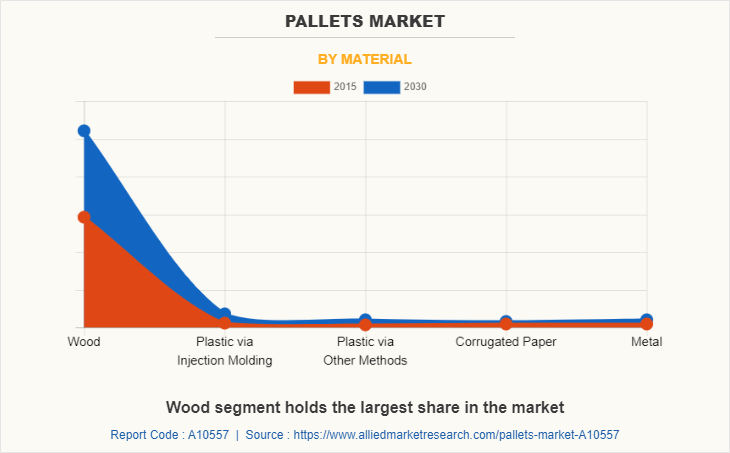
By material: The pallet market is categorized into wood, plastic via injection molding, plastic via other methods, corrugated paper, and metal. Wooden pallets are manufactured using hardwood or softwood timber; however, pallet manufacturing wood differs according to region depending on the availability of trees for wood extraction. Softwood such as Douglas fir, pine, yew, and spruce are commonly used for pallet production, whereas maple, oak, teak, mahogany, teak, and walnut are a few hardwoods used for manufacturing of wooden pallets. Pallets manufactured using high-pressure injection molding are made from high-density polyethylene (HDPE) or copolymer polypropylene resins. The melting temperature of the resin is maintained around 250°C, and the plastic is injected under high pressure into a mold. Plastic pallets manufactured using thermoforming, rotational molding, and compression molding are considered in this segment. Corrugated paper pallets, also called paper pallets or cardboard pallets, are a highly efficient alternative for wooden pallets and exhibit features such as lightweight and environmental sustainability. Metal pallets are manufactured using stainless steel and aluminum. The wood segment is expected to exhibit the largest revenue contributor during the forecast period and plastic via injection molding segment is expected to exhibit the highest CAGR share in the by material segment in the pallet market during the forecast period.

Pallets Market

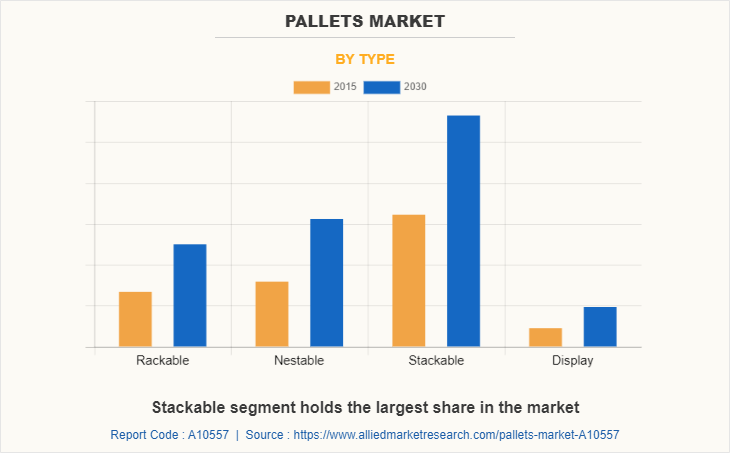
By type: The pallet market is categorized into rackable, nestable, stackable, and display pallets. Rackable pallets are designed for handling heavy loads and mostly have a runner with a picture frame at bottom to offer high stability in racking operations. It is designed to hold a specified amount of weight in an open span racking system. Rackable pallets are available in wood and plastic materials. Nestable pallets have a nine-leg bottom, which allows it to gain grip or nest into other pallets. Nestable pallets are the most space-saving pallets compared to stackable and rackable pallets. Stackable pallets are often used in closed loop shipping and warehouse applications. The structure and design of the pallet allow the user to stack pallets on top of one another. Display pallets can be manufactured using wood, plastic, corrugated paper, or metal and find application in retail stores for application on floor display. The stackable segment is expected to exhibit the largest revenue contributor during the forecast period and the display and nestable segment is expected to exhibit the highest CAGR share in the by type segment in the pallet market during the forecast period.

Pallets Market

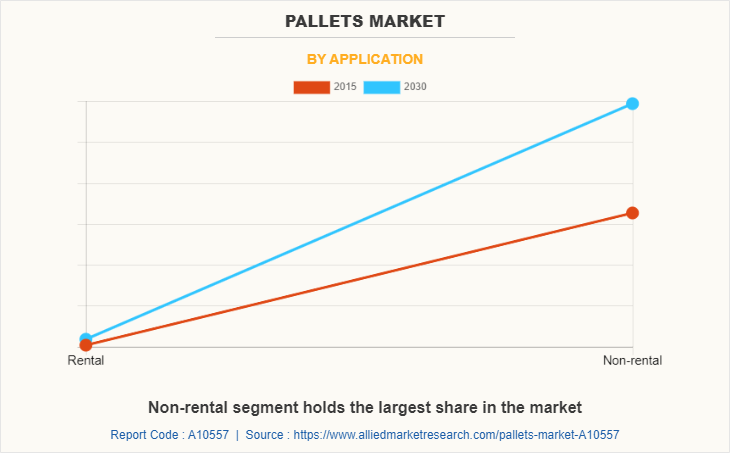
By application: The pallets market overview for application segment is classified into rental and non-rental. Pallets that are sold with a purpose of further renting them to different end users are considered in this segment. Pallets on rental basis are an affordable option for consumers. The consumers need to pay for the pallets only till the time they use them. It helps in saving maintenance, replacement, administration, and transportation cost of the pallets. The non-rental pallets are the type of pallets for which customers get authority or ownership to purchase the pallets. In the case of non-rental pallets, customers do not need to sign an agreement and it does not include any monthly payment. Purchasing pallets cost more as compared to rental pallets due to maintenance, repairing, transportation, and ownership costs. The non-rental segment is expected to exhibit the largest revenue contributor during the forecast period and rental is expected to exhibit the highest CAGR share in the by application segment in the pallet market during the forecast period.

Pallets Market

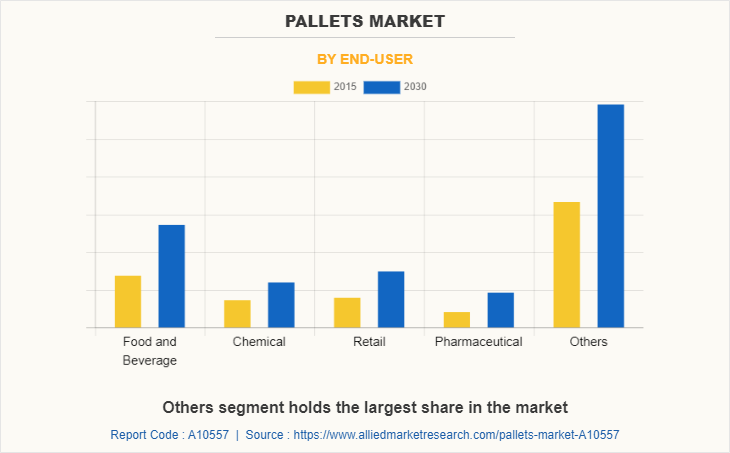
By end-user industry: The pallets market is divided into food & beverage, chemical, retail, pharmaceutical, and others. The chemical industry implements special pallets resistant to high-concentration and corrosive chemicals, which may react with the pallet material to create unforeseen damage to the pallet. Thus, pallets used in the chemical industry have high-quality material and usually undergo practical trials to withstand harsh conditions in the industry. Pharmaceutical applications require pallets with hygienic and cost-effective features. The others segment includes agriculture, metal & machinery, electronics, and construction industries. Agriculture and metal & machinery industries exhibit a high demand for pallets. Furthermore, the others segment is expected to exhibit the largest revenue share in the end-user industry segment in the pallets market during the forecast period. The pharmaceutical segment is expected to exhibit the largest CAGR during the forecast period.
Pallets Market

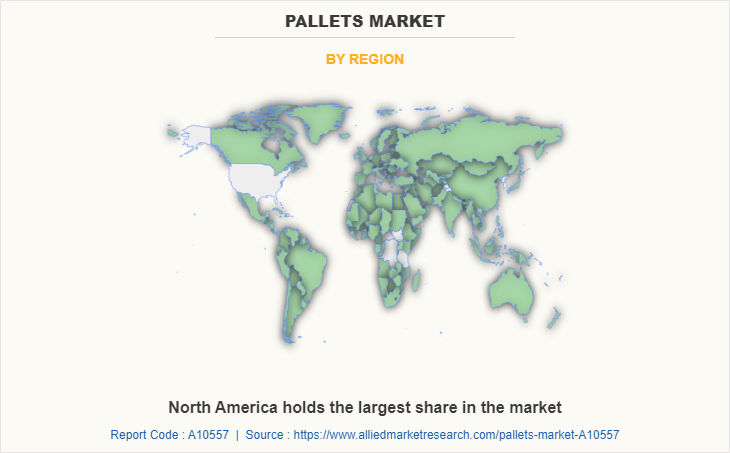
By region: The pallets market forecast is analyzed across North America, Europe, Asia-Pacific, and LAMEA. In 2022, Asia-Pacific had the highest revenue in pallets market share, and is expected to exhibit the highest CAGR during the forecast period.
Pallets Market

COMPETITION ANALYSIS

The major players profiled in the global pallets market include Brambles Limited, CABKA Group GmbH (CABKA), Craemer Holding GmbH (CRAEMER), Falkenhahn AG (Falkenhahn), LOSCAM International Holdings Co., Ltd. (LOSCAM), Menasha Corporation, Millwood, Inc., Rehrig Pacific Holdings, Inc. (Rehrig Pacific), Schoeller Allibert Services B.V. (Schoeller Allibert), and UFP Industries, Inc. (PalletOne).

Major companies in the market have adopted acquisition, product launch, business expansion, and other strategies as their key developmental strategies to offer better products and services to customers in the pallets market.

Some examples of product launch in the market

In September 2020, Menasha, through its subsidiary ORBIS Corporation, launched a new Odyssey pallet. The Odyssey rackable pallet is designed for heavy-duty racking applications and holds more than 2,800 pounds in unsupported racking. The product is available in 40 x 48 inches size and also includes optional molded-in frictional elements and steel reinforcements.

In September 2021- Menasha, through its subsidiary ORBIS Corporation, launched 44 X 56 new Universal Container Pallet (UCP) to its reusable products portfolio.

In July 2020- Menasha, through its subsidiary ORBIS Corporation, opened a new ORBIS RPM service center in Winston-Salem, North Carolina, U.S. The ORBIS Reusable Packaging Management (RPM) is a global supply chain company engaged in cleaning, repair, management, and replenishment of reusable layer pads, plastic pallets, and top frames. The expansion is aimed at offering efficient shipping, operating, and repairing using automated processes.

Some examples of business expansion and acquisition that support the markets growth

In March 2023, Craemer Holding GmbH has expanded its new plastic pallet production business Craemer UK. With this expansion, lead times were cut, customers received their orders more quickly, and transportation costs from Craemer's facility in Germany were eliminated. Additionally, there was a significant drop in CO2 emissions, which will be appealing to Craemer consumers in the UK.

In December 2022, Millwood Inc. acquired Red Express Pallet in order to expand its business facility in Texas. This will enhance the company's customer reach in Texas.

In November 2022, Millwood Inc. acquired Southworth Wood Products in order to expand its business facility in Southern Ohio. This acquisition will strengthen the product portfolio and sales of the company.

In September 2022 - Millwood Inc. acquired Austin Pallet. With this acquisition, Millwood welcomed nearly 30 new team members to its staff of more than 1,800 people nationwide.

In November 2021, UFP Industries, Inc. (PalletOne) acquired Ficus Pax Private Limited which is a leading manufacturer of wooden pallets, nail-less plywood boxes mixed-material, cases and crates and other packaging products.

Key Benefits For Stakeholders

  • This report provides a quantitative analysis of the market segments, current trends, estimations, and dynamics of the pallets market analysis from 2010 to 2032 to identify the prevailing pallets market opportunity.
  • The market research is offered along with information related to key drivers, restraints, and opportunities.
  • Porter's five forces analysis highlights the potency of buyers and suppliers to enable stakeholders make profit-oriented business decisions and strengthen their supplier-buyer network.
  • In-depth analysis of the pallets market segmentation assists to determine the prevailing market opportunities.
  • Major countries in each region are mapped according to their revenue contribution to the global market.
  • Market player positioning facilitates benchmarking and provides a clear understanding of the present position of the market players.
  • The report includes the analysis of the regional as well as global pallets market trends, key players, market segments, application areas, and market growth strategies.

Pallets Market Report Highlights

Aspects Details
Market Size By 2032 USD 130.5 billion
Growth Rate CAGR of 4.1%
Forecast period 2010 - 2032
Report Pages 340
By Application
  • Rental
  • Non-rental
By Material
  • Metal
  • Wood
  • Plastic via Injection Molding
  • Plastic via Other Methods
  • Corrugated Paper
By End-user
  • Food and Beverage
  • Chemical
  • Retail
  • Pharmaceutical
  • Others
By Type
  • Rackable
  • Nestable
  • Stackable
  • Display
By Region
  • North America  (U.S., Canada, Mexico)
  • Europe  (Germany, France, UK, Italy, Rest of Europe)
  • Asia-Pacific  (China, Japan, South Korea, India, Indonesia, Malaysia, Thailand, Viet Nam, Cambodia, Lao People, Rest of Asia-Pacific)
  • LAMEA  (Latin America, Middle East, Africa)
Key Market Players UFP Industries, Inc. (PalletOne), Craemer Holding GmbH (CRAEMER), Brambles Limited, Schoeller Allibert Services B.V. (Schoeller Allibert), Menasha corporation, Rehrig Pacific Holdings, Inc. (Rehrig Pacific), Falkenhahn AG (Falkenhahn), LOSCAM International Holdings Co., Ltd. (LOSCAM), CABKA Group GmbH (CABKA), Millwood, Inc.

Analyst Review

The global pallets market is anticipated to exhibit high growth potential in China. This is attributed to the fact that China has been the largest economy in the global logistics market, and garners a major share in the pallets market, owing to large export of electronics and metal & machinery. The companies such as Loscam and Brambles Ltd. have a monopoly in the Chinese pallet industry. Loscam entered the Taiwan market and has gained a significant share in the country.

The key players in the market have focused on business expansion strategy to strengthen their foothold in the pallets industry. For instance, in May 2021, Craemer, based in the U.S., opened a new corporation office at Aurea Industrial Park, Europe. The corporation office is expected to serve CRAEMER’s existing clients in the Europe as well as increase the engagement of prospective clients for the Craemer plastic pallets and container business.

Similarly, in July 2020, the company Menasha Corporation, headquartered in the U.S., through its subsidiary ORBIS Corporation opened a new ORBIS RPM service center in Winston-Salem, North Carolina, U.S.

The ORBIS Reusable Packaging Management (RPM) is a global supply chain company engaged in cleaning, repair, management, and replenishment of reusable layer pads, plastic pallets, and top frames. The expansion is aimed at offering efficient shipping, operating, and repairing using automated processes.

 
  • CHAPTER 1: INTRODUCTION

    • 1.1. Report description

    • 1.2. Key market segments

    • 1.3. Key benefits to the stakeholders

    • 1.4. Research Methodology

      • 1.4.1. Primary research

      • 1.4.2. Secondary research

      • 1.4.3. Analyst tools and models

  • CHAPTER 2: EXECUTIVE SUMMARY

    • 2.1. CXO Perspective

  • CHAPTER 3: MARKET OVERVIEW

    • 3.1. Market definition and scope

    • 3.2. Key findings

      • 3.2.1. Top impacting factors

      • 3.2.2. Top investment pockets

    • 3.3. Porter’s five forces analysis

      • 3.3.1. Bargaining power of suppliers

      • 3.3.2. Bargaining power of buyers

      • 3.3.3. Threat of substitutes

      • 3.3.4. Threat of new entrants

      • 3.3.5. Intensity of rivalry

    • 3.4. Market dynamics

      • 3.4.1. Drivers

        • 3.4.1.1. Increase in demand for plastic pallets
        • 3.4.1.2. Development of the e-commerce industry
        • 3.4.1.3. Rise in focus on sustainable pallet production

      • 3.4.2. Restraints

        • 3.4.2.1. Increase in price of wooden pallets
        • 3.4.2.2. Disadvantages of pallets

      • 3.4.3. Opportunities

        • 3.4.3.1. Adoption of new technologies in supply chain

    • 3.5. COVID-19 Impact Analysis on the market

  • CHAPTER 4: PALLETS MARKET, BY MATERIAL

    • 4.1. Overview

      • 4.1.1. Market size and forecast

    • 4.2. Wood

      • 4.2.1. Key market trends, growth factors and opportunities

      • 4.2.2. Market size and forecast, by region

      • 4.2.3. Market share analysis by country

    • 4.3. Plastic via Injection Molding

      • 4.3.1. Key market trends, growth factors and opportunities

      • 4.3.2. Market size and forecast, by region

      • 4.3.3. Market share analysis by country

    • 4.4. Plastic via Other Methods

      • 4.4.1. Key market trends, growth factors and opportunities

      • 4.4.2. Market size and forecast, by region

      • 4.4.3. Market share analysis by country

    • 4.5. Corrugated Paper

      • 4.5.1. Key market trends, growth factors and opportunities

      • 4.5.2. Market size and forecast, by region

      • 4.5.3. Market share analysis by country

    • 4.6. Metal

      • 4.6.1. Key market trends, growth factors and opportunities

      • 4.6.2. Market size and forecast, by region

      • 4.6.3. Market share analysis by country

  • CHAPTER 5: PALLETS MARKET, BY TYPE

    • 5.1. Overview

      • 5.1.1. Market size and forecast

    • 5.2. Rackable

      • 5.2.1. Key market trends, growth factors and opportunities

      • 5.2.2. Market size and forecast, by region

      • 5.2.3. Market share analysis by country

    • 5.3. Nestable

      • 5.3.1. Key market trends, growth factors and opportunities

      • 5.3.2. Market size and forecast, by region

      • 5.3.3. Market share analysis by country

    • 5.4. Stackable

      • 5.4.1. Key market trends, growth factors and opportunities

      • 5.4.2. Market size and forecast, by region

      • 5.4.3. Market share analysis by country

    • 5.5. Display

      • 5.5.1. Key market trends, growth factors and opportunities

      • 5.5.2. Market size and forecast, by region

      • 5.5.3. Market share analysis by country

  • CHAPTER 6: PALLETS MARKET, BY APPLICATION

    • 6.1. Overview

      • 6.1.1. Market size and forecast

    • 6.2. Rental

      • 6.2.1. Key market trends, growth factors and opportunities

      • 6.2.2. Market size and forecast, by region

      • 6.2.3. Market share analysis by country

    • 6.3. Non-rental

      • 6.3.1. Key market trends, growth factors and opportunities

      • 6.3.2. Market size and forecast, by region

      • 6.3.3. Market share analysis by country

  • CHAPTER 7: PALLETS MARKET, BY END-USER

    • 7.1. Overview

      • 7.1.1. Market size and forecast

    • 7.2. Food and Beverage

      • 7.2.1. Key market trends, growth factors and opportunities

      • 7.2.2. Market size and forecast, by region

      • 7.2.3. Market share analysis by country

    • 7.3. Chemical

      • 7.3.1. Key market trends, growth factors and opportunities

      • 7.3.2. Market size and forecast, by region

      • 7.3.3. Market share analysis by country

    • 7.4. Retail

      • 7.4.1. Key market trends, growth factors and opportunities

      • 7.4.2. Market size and forecast, by region

      • 7.4.3. Market share analysis by country

    • 7.5. Pharmaceutical

      • 7.5.1. Key market trends, growth factors and opportunities

      • 7.5.2. Market size and forecast, by region

      • 7.5.3. Market share analysis by country

    • 7.6. Others

      • 7.6.1. Key market trends, growth factors and opportunities

      • 7.6.2. Market size and forecast, by region

      • 7.6.3. Market share analysis by country

  • CHAPTER 8: PALLETS MARKET, BY REGION

    • 8.1. Overview

      • 8.1.1. Market size and forecast By Region

    • 8.2. North America

      • 8.2.1. Key trends and opportunities

      • 8.2.2. Market size and forecast, by Material

      • 8.2.3. Market size and forecast, by Type

      • 8.2.4. Market size and forecast, by Application

      • 8.2.5. Market size and forecast, by End-user

      • 8.2.6. Market size and forecast, by country

        • 8.2.6.1. U.S.
          • 8.2.6.1.1. Key market trends, growth factors and opportunities
          • 8.2.6.1.2. Market size and forecast, by Material
          • 8.2.6.1.3. Market size and forecast, by Type
          • 8.2.6.1.4. Market size and forecast, by Application
          • 8.2.6.1.5. Market size and forecast, by End-user
        • 8.2.6.2. Canada
          • 8.2.6.2.1. Key market trends, growth factors and opportunities
          • 8.2.6.2.2. Market size and forecast, by Material
          • 8.2.6.2.3. Market size and forecast, by Type
          • 8.2.6.2.4. Market size and forecast, by Application
          • 8.2.6.2.5. Market size and forecast, by End-user
        • 8.2.6.3. Mexico
          • 8.2.6.3.1. Key market trends, growth factors and opportunities
          • 8.2.6.3.2. Market size and forecast, by Material
          • 8.2.6.3.3. Market size and forecast, by Type
          • 8.2.6.3.4. Market size and forecast, by Application
          • 8.2.6.3.5. Market size and forecast, by End-user
    • 8.3. Europe

      • 8.3.1. Key trends and opportunities

      • 8.3.2. Market size and forecast, by Material

      • 8.3.3. Market size and forecast, by Type

      • 8.3.4. Market size and forecast, by Application

      • 8.3.5. Market size and forecast, by End-user

      • 8.3.6. Market size and forecast, by country

        • 8.3.6.1. Germany
          • 8.3.6.1.1. Key market trends, growth factors and opportunities
          • 8.3.6.1.2. Market size and forecast, by Material
          • 8.3.6.1.3. Market size and forecast, by Type
          • 8.3.6.1.4. Market size and forecast, by Application
          • 8.3.6.1.5. Market size and forecast, by End-user
        • 8.3.6.2. France
          • 8.3.6.2.1. Key market trends, growth factors and opportunities
          • 8.3.6.2.2. Market size and forecast, by Material
          • 8.3.6.2.3. Market size and forecast, by Type
          • 8.3.6.2.4. Market size and forecast, by Application
          • 8.3.6.2.5. Market size and forecast, by End-user
        • 8.3.6.3. UK
          • 8.3.6.3.1. Key market trends, growth factors and opportunities
          • 8.3.6.3.2. Market size and forecast, by Material
          • 8.3.6.3.3. Market size and forecast, by Type
          • 8.3.6.3.4. Market size and forecast, by Application
          • 8.3.6.3.5. Market size and forecast, by End-user
        • 8.3.6.4. Italy
          • 8.3.6.4.1. Key market trends, growth factors and opportunities
          • 8.3.6.4.2. Market size and forecast, by Material
          • 8.3.6.4.3. Market size and forecast, by Type
          • 8.3.6.4.4. Market size and forecast, by Application
          • 8.3.6.4.5. Market size and forecast, by End-user
        • 8.3.6.5. Rest of Europe
          • 8.3.6.5.1. Key market trends, growth factors and opportunities
          • 8.3.6.5.2. Market size and forecast, by Material
          • 8.3.6.5.3. Market size and forecast, by Type
          • 8.3.6.5.4. Market size and forecast, by Application
          • 8.3.6.5.5. Market size and forecast, by End-user
    • 8.4. Asia-Pacific

      • 8.4.1. Key trends and opportunities

      • 8.4.2. Market size and forecast, by Material

      • 8.4.3. Market size and forecast, by Type

      • 8.4.4. Market size and forecast, by Application

      • 8.4.5. Market size and forecast, by End-user

      • 8.4.6. Market size and forecast, by country

        • 8.4.6.1. China
          • 8.4.6.1.1. Key market trends, growth factors and opportunities
          • 8.4.6.1.2. Market size and forecast, by Material
          • 8.4.6.1.3. Market size and forecast, by Type
          • 8.4.6.1.4. Market size and forecast, by Application
          • 8.4.6.1.5. Market size and forecast, by End-user
        • 8.4.6.2. Japan
          • 8.4.6.2.1. Key market trends, growth factors and opportunities
          • 8.4.6.2.2. Market size and forecast, by Material
          • 8.4.6.2.3. Market size and forecast, by Type
          • 8.4.6.2.4. Market size and forecast, by Application
          • 8.4.6.2.5. Market size and forecast, by End-user
        • 8.4.6.3. South Korea
          • 8.4.6.3.1. Key market trends, growth factors and opportunities
          • 8.4.6.3.2. Market size and forecast, by Material
          • 8.4.6.3.3. Market size and forecast, by Type
          • 8.4.6.3.4. Market size and forecast, by Application
          • 8.4.6.3.5. Market size and forecast, by End-user
        • 8.4.6.4. India
          • 8.4.6.4.1. Key market trends, growth factors and opportunities
          • 8.4.6.4.2. Market size and forecast, by Material
          • 8.4.6.4.3. Market size and forecast, by Type
          • 8.4.6.4.4. Market size and forecast, by Application
          • 8.4.6.4.5. Market size and forecast, by End-user
        • 8.4.6.5. Indonesia
          • 8.4.6.5.1. Key market trends, growth factors and opportunities
          • 8.4.6.5.2. Market size and forecast, by Material
          • 8.4.6.5.3. Market size and forecast, by Type
          • 8.4.6.5.4. Market size and forecast, by Application
          • 8.4.6.5.5. Market size and forecast, by End-user
        • 8.4.6.6. Malaysia
          • 8.4.6.6.1. Key market trends, growth factors and opportunities
          • 8.4.6.6.2. Market size and forecast, by Material
          • 8.4.6.6.3. Market size and forecast, by Type
          • 8.4.6.6.4. Market size and forecast, by Application
          • 8.4.6.6.5. Market size and forecast, by End-user
        • 8.4.6.7. Thailand
          • 8.4.6.7.1. Key market trends, growth factors and opportunities
          • 8.4.6.7.2. Market size and forecast, by Material
          • 8.4.6.7.3. Market size and forecast, by Type
          • 8.4.6.7.4. Market size and forecast, by Application
          • 8.4.6.7.5. Market size and forecast, by End-user
        • 8.4.6.8. Viet Nam
          • 8.4.6.8.1. Key market trends, growth factors and opportunities
          • 8.4.6.8.2. Market size and forecast, by Material
          • 8.4.6.8.3. Market size and forecast, by Type
          • 8.4.6.8.4. Market size and forecast, by Application
          • 8.4.6.8.5. Market size and forecast, by End-user
        • 8.4.6.9. Cambodia
          • 8.4.6.9.1. Key market trends, growth factors and opportunities
          • 8.4.6.9.2. Market size and forecast, by Material
          • 8.4.6.9.3. Market size and forecast, by Type
          • 8.4.6.9.4. Market size and forecast, by Application
          • 8.4.6.9.5. Market size and forecast, by End-user
        • 8.4.6.10. Lao People
          • 8.4.6.10.1. Key market trends, growth factors and opportunities
          • 8.4.6.10.2. Market size and forecast, by Material
          • 8.4.6.10.3. Market size and forecast, by Type
          • 8.4.6.10.4. Market size and forecast, by Application
          • 8.4.6.10.5. Market size and forecast, by End-user
        • 8.4.6.11. Rest of Asia-Pacific
          • 8.4.6.11.1. Key market trends, growth factors and opportunities
          • 8.4.6.11.2. Market size and forecast, by Material
          • 8.4.6.11.3. Market size and forecast, by Type
          • 8.4.6.11.4. Market size and forecast, by Application
          • 8.4.6.11.5. Market size and forecast, by End-user
    • 8.5. LAMEA

      • 8.5.1. Key trends and opportunities

      • 8.5.2. Market size and forecast, by Material

      • 8.5.3. Market size and forecast, by Type

      • 8.5.4. Market size and forecast, by Application

      • 8.5.5. Market size and forecast, by End-user

      • 8.5.6. Market size and forecast, by country

        • 8.5.6.1. Latin America
          • 8.5.6.1.1. Key market trends, growth factors and opportunities
          • 8.5.6.1.2. Market size and forecast, by Material
          • 8.5.6.1.3. Market size and forecast, by Type
          • 8.5.6.1.4. Market size and forecast, by Application
          • 8.5.6.1.5. Market size and forecast, by End-user
        • 8.5.6.2. Middle East
          • 8.5.6.2.1. Key market trends, growth factors and opportunities
          • 8.5.6.2.2. Market size and forecast, by Material
          • 8.5.6.2.3. Market size and forecast, by Type
          • 8.5.6.2.4. Market size and forecast, by Application
          • 8.5.6.2.5. Market size and forecast, by End-user
        • 8.5.6.3. Africa
          • 8.5.6.3.1. Key market trends, growth factors and opportunities
          • 8.5.6.3.2. Market size and forecast, by Material
          • 8.5.6.3.3. Market size and forecast, by Type
          • 8.5.6.3.4. Market size and forecast, by Application
          • 8.5.6.3.5. Market size and forecast, by End-user
  • CHAPTER 9: COMPETITIVE LANDSCAPE

    • 9.1. Introduction

    • 9.2. Top winning strategies

    • 9.3. Product Mapping of Top 10 Player

    • 9.4. Competitive Dashboard

    • 9.5. Competitive Heatmap

    • 9.6. Top player positioning, 2010

  • CHAPTER 10: COMPANY PROFILES

    • 10.1. Brambles Limited

      • 10.1.1. Company overview

      • 10.1.2. Key Executives

      • 10.1.3. Company snapshot

      • 10.1.4. Operating business segments

      • 10.1.5. Product portfolio

      • 10.1.6. Business performance

    • 10.2. Schoeller Allibert Services B.V. (Schoeller Allibert)

      • 10.2.1. Company overview

      • 10.2.2. Key Executives

      • 10.2.3. Company snapshot

      • 10.2.4. Operating business segments

      • 10.2.5. Product portfolio

      • 10.2.6. Business performance

      • 10.2.7. Key strategic moves and developments

    • 10.3. UFP Industries, Inc. (PalletOne)

      • 10.3.1. Company overview

      • 10.3.2. Key Executives

      • 10.3.3. Company snapshot

      • 10.3.4. Operating business segments

      • 10.3.5. Product portfolio

      • 10.3.6. Business performance

      • 10.3.7. Key strategic moves and developments

    • 10.4. CABKA Group GmbH (CABKA)

      • 10.4.1. Company overview

      • 10.4.2. Key Executives

      • 10.4.3. Company snapshot

      • 10.4.4. Operating business segments

      • 10.4.5. Product portfolio

      • 10.4.6. Business performance

    • 10.5. Rehrig Pacific Holdings, Inc. (Rehrig Pacific)

      • 10.5.1. Company overview

      • 10.5.2. Key Executives

      • 10.5.3. Company snapshot

      • 10.5.4. Operating business segments

      • 10.5.5. Product portfolio

    • 10.6. Craemer Holding GmbH (CRAEMER)

      • 10.6.1. Company overview

      • 10.6.2. Key Executives

      • 10.6.3. Company snapshot

      • 10.6.4. Operating business segments

      • 10.6.5. Product portfolio

      • 10.6.6. Key strategic moves and developments

    • 10.7. Menasha corporation

      • 10.7.1. Company overview

      • 10.7.2. Key Executives

      • 10.7.3. Company snapshot

      • 10.7.4. Operating business segments

      • 10.7.5. Product portfolio

      • 10.7.6. Key strategic moves and developments

    • 10.8. LOSCAM International Holdings Co., Ltd. (LOSCAM)

      • 10.8.1. Company overview

      • 10.8.2. Key Executives

      • 10.8.3. Company snapshot

      • 10.8.4. Operating business segments

      • 10.8.5. Product portfolio

    • 10.9. Millwood, Inc.

      • 10.9.1. Company overview

      • 10.9.2. Key Executives

      • 10.9.3. Company snapshot

      • 10.9.4. Operating business segments

      • 10.9.5. Product portfolio

      • 10.9.6. Key strategic moves and developments

    • 10.10. Falkenhahn AG (Falkenhahn)

      • 10.10.1. Company overview

      • 10.10.2. Key Executives

      • 10.10.3. Company snapshot

      • 10.10.4. Operating business segments

      • 10.10.5. Product portfolio

  • LIST OF TABLES

  • TABLE 01. GLOBAL PALLETS MARKET, BY MATERIAL, 2010-2032 ($MILLION)
    TABLE 02. GLOBAL PALLETS MARKET, BY MATERIAL, 2010-2032 (MILLION UNITS)
    TABLE 03. PALLETS MARKET FOR WOOD, BY REGION, 2010-2032 ($MILLION)
    TABLE 04. PALLETS MARKET FOR WOOD, BY REGION, 2010-2032 (MILLION UNITS)
    TABLE 05. PALLETS MARKET FOR PLASTIC VIA INJECTION MOLDING, BY REGION, 2010-2032 ($MILLION)
    TABLE 06. PALLETS MARKET FOR PLASTIC VIA INJECTION MOLDING, BY REGION, 2010-2032 (MILLION UNITS)
    TABLE 07. PALLETS MARKET FOR PLASTIC VIA OTHER METHODS, BY REGION, 2010-2032 ($MILLION)
    TABLE 08. PALLETS MARKET FOR PLASTIC VIA OTHER METHODS, BY REGION, 2010-2032 (MILLION UNITS)
    TABLE 09. PALLETS MARKET FOR CORRUGATED PAPER, BY REGION, 2010-2032 ($MILLION)
    TABLE 10. PALLETS MARKET FOR CORRUGATED PAPER, BY REGION, 2010-2032 (MILLION UNITS)
    TABLE 11. PALLETS MARKET FOR METAL, BY REGION, 2010-2032 ($MILLION)
    TABLE 12. PALLETS MARKET FOR METAL, BY REGION, 2010-2032 (MILLION UNITS)
    TABLE 13. GLOBAL PALLETS MARKET, BY TYPE, 2010-2032 ($MILLION)
    TABLE 14. GLOBAL PALLETS MARKET, BY TYPE, 2010-2032 (MILLION UNITS)
    TABLE 15. PALLETS MARKET FOR RACKABLE, BY REGION, 2010-2032 ($MILLION)
    TABLE 16. PALLETS MARKET FOR RACKABLE, BY REGION, 2010-2032 (MILLION UNITS)
    TABLE 17. PALLETS MARKET FOR NESTABLE, BY REGION, 2010-2032 ($MILLION)
    TABLE 18. PALLETS MARKET FOR NESTABLE, BY REGION, 2010-2032 (MILLION UNITS)
    TABLE 19. PALLETS MARKET FOR STACKABLE, BY REGION, 2010-2032 ($MILLION)
    TABLE 20. PALLETS MARKET FOR STACKABLE, BY REGION, 2010-2032 (MILLION UNITS)
    TABLE 21. PALLETS MARKET FOR DISPLAY, BY REGION, 2010-2032 ($MILLION)
    TABLE 22. PALLETS MARKET FOR DISPLAY, BY REGION, 2010-2032 (MILLION UNITS)
    TABLE 23. GLOBAL PALLETS MARKET, BY APPLICATION, 2010-2032 ($MILLION)
    TABLE 24. GLOBAL PALLETS MARKET, BY APPLICATION, 2010-2032 (MILLION UNITS)
    TABLE 25. PALLETS MARKET FOR RENTAL, BY REGION, 2010-2032 ($MILLION)
    TABLE 26. PALLETS MARKET FOR RENTAL, BY REGION, 2010-2032 (MILLION UNITS)
    TABLE 27. PALLETS MARKET FOR NON-RENTAL, BY REGION, 2010-2032 ($MILLION)
    TABLE 28. PALLETS MARKET FOR NON-RENTAL, BY REGION, 2010-2032 (MILLION UNITS)
    TABLE 29. GLOBAL PALLETS MARKET, BY END-USER, 2010-2032 ($MILLION)
    TABLE 30. GLOBAL PALLETS MARKET, BY END-USER, 2010-2032 (MILLION UNITS)
    TABLE 31. PALLETS MARKET FOR FOOD AND BEVERAGE, BY REGION, 2010-2032 ($MILLION)
    TABLE 32. PALLETS MARKET FOR FOOD AND BEVERAGE, BY REGION, 2010-2032 (MILLION UNITS)
    TABLE 33. PALLETS MARKET FOR CHEMICAL, BY REGION, 2010-2032 ($MILLION)
    TABLE 34. PALLETS MARKET FOR CHEMICAL, BY REGION, 2010-2032 (MILLION UNITS)
    TABLE 35. PALLETS MARKET FOR RETAIL, BY REGION, 2010-2032 ($MILLION)
    TABLE 36. PALLETS MARKET FOR RETAIL, BY REGION, 2010-2032 (MILLION UNITS)
    TABLE 37. PALLETS MARKET FOR PHARMACEUTICAL, BY REGION, 2010-2032 ($MILLION)
    TABLE 38. PALLETS MARKET FOR PHARMACEUTICAL, BY REGION, 2010-2032 (MILLION UNITS)
    TABLE 39. PALLETS MARKET FOR OTHERS, BY REGION, 2010-2032 ($MILLION)
    TABLE 40. PALLETS MARKET FOR OTHERS, BY REGION, 2010-2032 (MILLION UNITS)
    TABLE 41. PALLETS MARKET, BY REGION, 2010-2032 ($MILLION)
    TABLE 42. PALLETS MARKET, BY REGION, 2010-2032 (MILLION UNITS)
    TABLE 43. NORTH AMERICA PALLETS MARKET, BY MATERIAL, 2010-2032 ($MILLION)
    TABLE 44. NORTH AMERICA PALLETS MARKET, BY MATERIAL, 2010-2032 (MILLION UNITS)
    TABLE 45. NORTH AMERICA PALLETS MARKET, BY TYPE, 2010-2032 ($MILLION)
    TABLE 46. NORTH AMERICA PALLETS MARKET, BY TYPE, 2010-2032 (MILLION UNITS)
    TABLE 47. NORTH AMERICA PALLETS MARKET, BY APPLICATION, 2010-2032 ($MILLION)
    TABLE 48. NORTH AMERICA PALLETS MARKET, BY APPLICATION, 2010-2032 (MILLION UNITS)
    TABLE 49. NORTH AMERICA PALLETS MARKET, BY END-USER, 2010-2032 ($MILLION)
    TABLE 50. NORTH AMERICA PALLETS MARKET, BY END-USER, 2010-2032 (MILLION UNITS)
    TABLE 51. NORTH AMERICA PALLETS MARKET, BY COUNTRY, 2010-2032 ($MILLION)
    TABLE 52. NORTH AMERICA PALLETS MARKET, BY COUNTRY, 2010-2032 (MILLION UNITS)
    TABLE 53. U.S. PALLETS MARKET, BY MATERIAL, 2010-2032 ($MILLION)
    TABLE 54. U.S. PALLETS MARKET, BY MATERIAL, 2010-2032 (MILLION UNITS)
    TABLE 55. U.S. PALLETS MARKET, BY TYPE, 2010-2032 ($MILLION)
    TABLE 56. U.S. PALLETS MARKET, BY TYPE, 2010-2032 (MILLION UNITS)
    TABLE 57. U.S. PALLETS MARKET, BY APPLICATION, 2010-2032 ($MILLION)
    TABLE 58. U.S. PALLETS MARKET, BY APPLICATION, 2010-2032 (MILLION UNITS)
    TABLE 59. U.S. PALLETS MARKET, BY END-USER, 2010-2032 ($MILLION)
    TABLE 60. U.S. PALLETS MARKET, BY END-USER, 2010-2032 (MILLION UNITS)
    TABLE 61. CANADA PALLETS MARKET, BY MATERIAL, 2010-2032 ($MILLION)
    TABLE 62. CANADA PALLETS MARKET, BY MATERIAL, 2010-2032 (MILLION UNITS)
    TABLE 63. CANADA PALLETS MARKET, BY TYPE, 2010-2032 ($MILLION)
    TABLE 64. CANADA PALLETS MARKET, BY TYPE, 2010-2032 (MILLION UNITS)
    TABLE 65. CANADA PALLETS MARKET, BY APPLICATION, 2010-2032 ($MILLION)
    TABLE 66. CANADA PALLETS MARKET, BY APPLICATION, 2010-2032 (MILLION UNITS)
    TABLE 67. CANADA PALLETS MARKET, BY END-USER, 2010-2032 ($MILLION)
    TABLE 68. CANADA PALLETS MARKET, BY END-USER, 2010-2032 (MILLION UNITS)
    TABLE 69. MEXICO PALLETS MARKET, BY MATERIAL, 2010-2032 ($MILLION)
    TABLE 70. MEXICO PALLETS MARKET, BY MATERIAL, 2010-2032 (MILLION UNITS)
    TABLE 71. MEXICO PALLETS MARKET, BY TYPE, 2010-2032 ($MILLION)
    TABLE 72. MEXICO PALLETS MARKET, BY TYPE, 2010-2032 (MILLION UNITS)
    TABLE 73. MEXICO PALLETS MARKET, BY APPLICATION, 2010-2032 ($MILLION)
    TABLE 74. MEXICO PALLETS MARKET, BY APPLICATION, 2010-2032 (MILLION UNITS)
    TABLE 75. MEXICO PALLETS MARKET, BY END-USER, 2010-2032 ($MILLION)
    TABLE 76. MEXICO PALLETS MARKET, BY END-USER, 2010-2032 (MILLION UNITS)
    TABLE 77. EUROPE PALLETS MARKET, BY MATERIAL, 2010-2032 ($MILLION)
    TABLE 78. EUROPE PALLETS MARKET, BY MATERIAL, 2010-2032 (MILLION UNITS)
    TABLE 79. EUROPE PALLETS MARKET, BY TYPE, 2010-2032 ($MILLION)
    TABLE 80. EUROPE PALLETS MARKET, BY TYPE, 2010-2032 (MILLION UNITS)
    TABLE 81. EUROPE PALLETS MARKET, BY APPLICATION, 2010-2032 ($MILLION)
    TABLE 82. EUROPE PALLETS MARKET, BY APPLICATION, 2010-2032 (MILLION UNITS)
    TABLE 83. EUROPE PALLETS MARKET, BY END-USER, 2010-2032 ($MILLION)
    TABLE 84. EUROPE PALLETS MARKET, BY END-USER, 2010-2032 (MILLION UNITS)
    TABLE 85. EUROPE PALLETS MARKET, BY COUNTRY, 2010-2032 ($MILLION)
    TABLE 86. EUROPE PALLETS MARKET, BY COUNTRY, 2010-2032 (MILLION UNITS)
    TABLE 87. GERMANY PALLETS MARKET, BY MATERIAL, 2010-2032 ($MILLION)
    TABLE 88. GERMANY PALLETS MARKET, BY MATERIAL, 2010-2032 (MILLION UNITS)
    TABLE 89. GERMANY PALLETS MARKET, BY TYPE, 2010-2032 ($MILLION)
    TABLE 90. GERMANY PALLETS MARKET, BY TYPE, 2010-2032 (MILLION UNITS)
    TABLE 91. GERMANY PALLETS MARKET, BY APPLICATION, 2010-2032 ($MILLION)
    TABLE 92. GERMANY PALLETS MARKET, BY APPLICATION, 2010-2032 (MILLION UNITS)
    TABLE 93. GERMANY PALLETS MARKET, BY END-USER, 2010-2032 ($MILLION)
    TABLE 94. GERMANY PALLETS MARKET, BY END-USER, 2010-2032 (MILLION UNITS)
    TABLE 95. FRANCE PALLETS MARKET, BY MATERIAL, 2010-2032 ($MILLION)
    TABLE 96. FRANCE PALLETS MARKET, BY MATERIAL, 2010-2032 (MILLION UNITS)
    TABLE 97. FRANCE PALLETS MARKET, BY TYPE, 2010-2032 ($MILLION)
    TABLE 98. FRANCE PALLETS MARKET, BY TYPE, 2010-2032 (MILLION UNITS)
    TABLE 99. FRANCE PALLETS MARKET, BY APPLICATION, 2010-2032 ($MILLION)
    TABLE 100. FRANCE PALLETS MARKET, BY APPLICATION, 2010-2032 (MILLION UNITS)
    TABLE 101. FRANCE PALLETS MARKET, BY END-USER, 2010-2032 ($MILLION)
    TABLE 102. FRANCE PALLETS MARKET, BY END-USER, 2010-2032 (MILLION UNITS)
    TABLE 103. UK PALLETS MARKET, BY MATERIAL, 2010-2032 ($MILLION)
    TABLE 104. UK PALLETS MARKET, BY MATERIAL, 2010-2032 (MILLION UNITS)
    TABLE 105. UK PALLETS MARKET, BY TYPE, 2010-2032 ($MILLION)
    TABLE 106. UK PALLETS MARKET, BY TYPE, 2010-2032 (MILLION UNITS)
    TABLE 107. UK PALLETS MARKET, BY APPLICATION, 2010-2032 ($MILLION)
    TABLE 108. UK PALLETS MARKET, BY APPLICATION, 2010-2032 (MILLION UNITS)
    TABLE 109. UK PALLETS MARKET, BY END-USER, 2010-2032 ($MILLION)
    TABLE 110. UK PALLETS MARKET, BY END-USER, 2010-2032 (MILLION UNITS)
    TABLE 111. ITALY PALLETS MARKET, BY MATERIAL, 2010-2032 ($MILLION)
    TABLE 112. ITALY PALLETS MARKET, BY MATERIAL, 2010-2032 (MILLION UNITS)
    TABLE 113. ITALY PALLETS MARKET, BY TYPE, 2010-2032 ($MILLION)
    TABLE 114. ITALY PALLETS MARKET, BY TYPE, 2010-2032 (MILLION UNITS)
    TABLE 115. ITALY PALLETS MARKET, BY APPLICATION, 2010-2032 ($MILLION)
    TABLE 116. ITALY PALLETS MARKET, BY APPLICATION, 2010-2032 (MILLION UNITS)
    TABLE 117. ITALY PALLETS MARKET, BY END-USER, 2010-2032 ($MILLION)
    TABLE 118. ITALY PALLETS MARKET, BY END-USER, 2010-2032 (MILLION UNITS)
    TABLE 119. REST OF EUROPE PALLETS MARKET, BY MATERIAL, 2010-2032 ($MILLION)
    TABLE 120. REST OF EUROPE PALLETS MARKET, BY MATERIAL, 2010-2032 (MILLION UNITS)
    TABLE 121. REST OF EUROPE PALLETS MARKET, BY TYPE, 2010-2032 ($MILLION)
    TABLE 122. REST OF EUROPE PALLETS MARKET, BY TYPE, 2010-2032 (MILLION UNITS)
    TABLE 123. REST OF EUROPE PALLETS MARKET, BY APPLICATION, 2010-2032 ($MILLION)
    TABLE 124. REST OF EUROPE PALLETS MARKET, BY APPLICATION, 2010-2032 (MILLION UNITS)
    TABLE 125. REST OF EUROPE PALLETS MARKET, BY END-USER, 2010-2032 ($MILLION)
    TABLE 126. REST OF EUROPE PALLETS MARKET, BY END-USER, 2010-2032 (MILLION UNITS)
    TABLE 127. ASIA-PACIFIC PALLETS MARKET, BY MATERIAL, 2010-2032 ($MILLION)
    TABLE 128. ASIA-PACIFIC PALLETS MARKET, BY MATERIAL, 2010-2032 (MILLION UNITS)
    TABLE 129. ASIA-PACIFIC PALLETS MARKET, BY TYPE, 2010-2032 ($MILLION)
    TABLE 130. ASIA-PACIFIC PALLETS MARKET, BY TYPE, 2010-2032 (MILLION UNITS)
    TABLE 131. ASIA-PACIFIC PALLETS MARKET, BY APPLICATION, 2010-2032 ($MILLION)
    TABLE 132. ASIA-PACIFIC PALLETS MARKET, BY APPLICATION, 2010-2032 (MILLION UNITS)
    TABLE 133. ASIA-PACIFIC PALLETS MARKET, BY END-USER, 2010-2032 ($MILLION)
    TABLE 134. ASIA-PACIFIC PALLETS MARKET, BY END-USER, 2010-2032 (MILLION UNITS)
    TABLE 135. ASIA-PACIFIC PALLETS MARKET, BY COUNTRY, 2010-2032 ($MILLION)
    TABLE 136. ASIA-PACIFIC PALLETS MARKET, BY COUNTRY, 2010-2032 (MILLION UNITS)
    TABLE 137. CHINA PALLETS MARKET, BY MATERIAL, 2010-2032 ($MILLION)
    TABLE 138. CHINA PALLETS MARKET, BY MATERIAL, 2010-2032 (MILLION UNITS)
    TABLE 139. CHINA PALLETS MARKET, BY TYPE, 2010-2032 ($MILLION)
    TABLE 140. CHINA PALLETS MARKET, BY TYPE, 2010-2032 (MILLION UNITS)
    TABLE 141. CHINA PALLETS MARKET, BY APPLICATION, 2010-2032 ($MILLION)
    TABLE 142. CHINA PALLETS MARKET, BY APPLICATION, 2010-2032 (MILLION UNITS)
    TABLE 143. CHINA PALLETS MARKET, BY END-USER, 2010-2032 ($MILLION)
    TABLE 144. CHINA PALLETS MARKET, BY END-USER, 2010-2032 (MILLION UNITS)
    TABLE 145. JAPAN PALLETS MARKET, BY MATERIAL, 2010-2032 ($MILLION)
    TABLE 146. JAPAN PALLETS MARKET, BY MATERIAL, 2010-2032 (MILLION UNITS)
    TABLE 147. JAPAN PALLETS MARKET, BY TYPE, 2010-2032 ($MILLION)
    TABLE 148. JAPAN PALLETS MARKET, BY TYPE, 2010-2032 (MILLION UNITS)
    TABLE 149. JAPAN PALLETS MARKET, BY APPLICATION, 2010-2032 ($MILLION)
    TABLE 150. JAPAN PALLETS MARKET, BY APPLICATION, 2010-2032 (MILLION UNITS)
    TABLE 151. JAPAN PALLETS MARKET, BY END-USER, 2010-2032 ($MILLION)
    TABLE 152. JAPAN PALLETS MARKET, BY END-USER, 2010-2032 (MILLION UNITS)
    TABLE 153. SOUTH KOREA PALLETS MARKET, BY MATERIAL, 2010-2032 ($MILLION)
    TABLE 154. SOUTH KOREA PALLETS MARKET, BY MATERIAL, 2010-2032 (MILLION UNITS)
    TABLE 155. SOUTH KOREA PALLETS MARKET, BY TYPE, 2010-2032 ($MILLION)
    TABLE 156. SOUTH KOREA PALLETS MARKET, BY TYPE, 2010-2032 (MILLION UNITS)
    TABLE 157. SOUTH KOREA PALLETS MARKET, BY APPLICATION, 2010-2032 ($MILLION)
    TABLE 158. SOUTH KOREA PALLETS MARKET, BY APPLICATION, 2010-2032 (MILLION UNITS)
    TABLE 159. SOUTH KOREA PALLETS MARKET, BY END-USER, 2010-2032 ($MILLION)
    TABLE 160. SOUTH KOREA PALLETS MARKET, BY END-USER, 2010-2032 (MILLION UNITS)
    TABLE 161. INDIA PALLETS MARKET, BY MATERIAL, 2010-2032 ($MILLION)
    TABLE 162. INDIA PALLETS MARKET, BY MATERIAL, 2010-2032 (MILLION UNITS)
    TABLE 163. INDIA PALLETS MARKET, BY TYPE, 2010-2032 ($MILLION)
    TABLE 164. INDIA PALLETS MARKET, BY TYPE, 2010-2032 (MILLION UNITS)
    TABLE 165. INDIA PALLETS MARKET, BY APPLICATION, 2010-2032 ($MILLION)
    TABLE 166. INDIA PALLETS MARKET, BY APPLICATION, 2010-2032 (MILLION UNITS)
    TABLE 167. INDIA PALLETS MARKET, BY END-USER, 2010-2032 ($MILLION)
    TABLE 168. INDIA PALLETS MARKET, BY END-USER, 2010-2032 (MILLION UNITS)
    TABLE 169. INDONESIA PALLETS MARKET, BY MATERIAL, 2010-2032 ($MILLION)
    TABLE 170. INDONESIA PALLETS MARKET, BY MATERIAL, 2010-2032 (MILLION UNITS)
    TABLE 171. INDONESIA PALLETS MARKET, BY TYPE, 2010-2032 ($MILLION)
    TABLE 172. INDONESIA PALLETS MARKET, BY TYPE, 2010-2032 (MILLION UNITS)
    TABLE 173. INDONESIA PALLETS MARKET, BY APPLICATION, 2010-2032 ($MILLION)
    TABLE 174. INDONESIA PALLETS MARKET, BY APPLICATION, 2010-2032 (MILLION UNITS)
    TABLE 175. INDONESIA PALLETS MARKET, BY END-USER, 2010-2032 ($MILLION)
    TABLE 176. INDONESIA PALLETS MARKET, BY END-USER, 2010-2032 (MILLION UNITS)
    TABLE 177. MALAYSIA PALLETS MARKET, BY MATERIAL, 2010-2032 ($MILLION)
    TABLE 178. MALAYSIA PALLETS MARKET, BY MATERIAL, 2010-2032 (MILLION UNITS)
    TABLE 179. MALAYSIA PALLETS MARKET, BY TYPE, 2010-2032 ($MILLION)
    TABLE 180. MALAYSIA PALLETS MARKET, BY TYPE, 2010-2032 (MILLION UNITS)
    TABLE 181. MALAYSIA PALLETS MARKET, BY APPLICATION, 2010-2032 ($MILLION)
    TABLE 182. MALAYSIA PALLETS MARKET, BY APPLICATION, 2010-2032 (MILLION UNITS)
    TABLE 183. MALAYSIA PALLETS MARKET, BY END-USER, 2010-2032 ($MILLION)
    TABLE 184. MALAYSIA PALLETS MARKET, BY END-USER, 2010-2032 (MILLION UNITS)
    TABLE 185. THAILAND PALLETS MARKET, BY MATERIAL, 2010-2032 ($MILLION)
    TABLE 186. THAILAND PALLETS MARKET, BY MATERIAL, 2010-2032 (MILLION UNITS)
    TABLE 187. THAILAND PALLETS MARKET, BY TYPE, 2010-2032 ($MILLION)
    TABLE 188. THAILAND PALLETS MARKET, BY TYPE, 2010-2032 (MILLION UNITS)
    TABLE 189. THAILAND PALLETS MARKET, BY APPLICATION, 2010-2032 ($MILLION)
    TABLE 190. THAILAND PALLETS MARKET, BY APPLICATION, 2010-2032 (MILLION UNITS)
    TABLE 191. THAILAND PALLETS MARKET, BY END-USER, 2010-2032 ($MILLION)
    TABLE 192. THAILAND PALLETS MARKET, BY END-USER, 2010-2032 (MILLION UNITS)
    TABLE 193. VIET NAM PALLETS MARKET, BY MATERIAL, 2010-2032 ($MILLION)
    TABLE 194. VIET NAM PALLETS MARKET, BY MATERIAL, 2010-2032 (MILLION UNITS)
    TABLE 195. VIET NAM PALLETS MARKET, BY TYPE, 2010-2032 ($MILLION)
    TABLE 196. VIET NAM PALLETS MARKET, BY TYPE, 2010-2032 (MILLION UNITS)
    TABLE 197. VIET NAM PALLETS MARKET, BY APPLICATION, 2010-2032 ($MILLION)
    TABLE 198. VIET NAM PALLETS MARKET, BY APPLICATION, 2010-2032 (MILLION UNITS)
    TABLE 199. VIET NAM PALLETS MARKET, BY END-USER, 2010-2032 ($MILLION)
    TABLE 200. VIET NAM PALLETS MARKET, BY END-USER, 2010-2032 (MILLION UNITS)
    TABLE 201. CAMBODIA PALLETS MARKET, BY MATERIAL, 2010-2032 ($MILLION)
    TABLE 202. CAMBODIA PALLETS MARKET, BY MATERIAL, 2010-2032 (MILLION UNITS)
    TABLE 203. CAMBODIA PALLETS MARKET, BY TYPE, 2010-2032 ($MILLION)
    TABLE 204. CAMBODIA PALLETS MARKET, BY TYPE, 2010-2032 (MILLION UNITS)
    TABLE 205. CAMBODIA PALLETS MARKET, BY APPLICATION, 2010-2032 ($MILLION)
    TABLE 206. CAMBODIA PALLETS MARKET, BY APPLICATION, 2010-2032 (MILLION UNITS)
    TABLE 207. CAMBODIA PALLETS MARKET, BY END-USER, 2010-2032 ($MILLION)
    TABLE 208. CAMBODIA PALLETS MARKET, BY END-USER, 2010-2032 (MILLION UNITS)
    TABLE 209. LAO PEOPLE PALLETS MARKET, BY MATERIAL, 2010-2032 ($MILLION)
    TABLE 210. LAO PEOPLE PALLETS MARKET, BY MATERIAL, 2010-2032 (MILLION UNITS)
    TABLE 211. LAO PEOPLE PALLETS MARKET, BY TYPE, 2010-2032 ($MILLION)
    TABLE 212. LAO PEOPLE PALLETS MARKET, BY TYPE, 2010-2032 (MILLION UNITS)
    TABLE 213. LAO PEOPLE PALLETS MARKET, BY APPLICATION, 2010-2032 ($MILLION)
    TABLE 214. LAO PEOPLE PALLETS MARKET, BY APPLICATION, 2010-2032 (MILLION UNITS)
    TABLE 215. LAO PEOPLE PALLETS MARKET, BY END-USER, 2010-2032 ($MILLION)
    TABLE 216. LAO PEOPLE PALLETS MARKET, BY END-USER, 2010-2032 (MILLION UNITS)
    TABLE 217. REST OF ASIA-PACIFIC PALLETS MARKET, BY MATERIAL, 2010-2032 ($MILLION)
    TABLE 218. REST OF ASIA-PACIFIC PALLETS MARKET, BY MATERIAL, 2010-2032 (MILLION UNITS)
    TABLE 219. REST OF ASIA-PACIFIC PALLETS MARKET, BY TYPE, 2010-2032 ($MILLION)
    TABLE 220. REST OF ASIA-PACIFIC PALLETS MARKET, BY TYPE, 2010-2032 (MILLION UNITS)
    TABLE 221. REST OF ASIA-PACIFIC PALLETS MARKET, BY APPLICATION, 2010-2032 ($MILLION)
    TABLE 222. REST OF ASIA-PACIFIC PALLETS MARKET, BY APPLICATION, 2010-2032 (MILLION UNITS)
    TABLE 223. REST OF ASIA-PACIFIC PALLETS MARKET, BY END-USER, 2010-2032 ($MILLION)
    TABLE 224. REST OF ASIA-PACIFIC PALLETS MARKET, BY END-USER, 2010-2032 (MILLION UNITS)
    TABLE 225. LAMEA PALLETS MARKET, BY MATERIAL, 2010-2032 ($MILLION)
    TABLE 226. LAMEA PALLETS MARKET, BY MATERIAL, 2010-2032 (MILLION UNITS)
    TABLE 227. LAMEA PALLETS MARKET, BY TYPE, 2010-2032 ($MILLION)
    TABLE 228. LAMEA PALLETS MARKET, BY TYPE, 2010-2032 (MILLION UNITS)
    TABLE 229. LAMEA PALLETS MARKET, BY APPLICATION, 2010-2032 ($MILLION)
    TABLE 230. LAMEA PALLETS MARKET, BY APPLICATION, 2010-2032 (MILLION UNITS)
    TABLE 231. LAMEA PALLETS MARKET, BY END-USER, 2010-2032 ($MILLION)
    TABLE 232. LAMEA PALLETS MARKET, BY END-USER, 2010-2032 (MILLION UNITS)
    TABLE 233. LAMEA PALLETS MARKET, BY COUNTRY, 2010-2032 ($MILLION)
    TABLE 234. LAMEA PALLETS MARKET, BY COUNTRY, 2010-2032 (MILLION UNITS)
    TABLE 235. LATIN AMERICA PALLETS MARKET, BY MATERIAL, 2010-2032 ($MILLION)
    TABLE 236. LATIN AMERICA PALLETS MARKET, BY MATERIAL, 2010-2032 (MILLION UNITS)
    TABLE 237. LATIN AMERICA PALLETS MARKET, BY TYPE, 2010-2032 ($MILLION)
    TABLE 238. LATIN AMERICA PALLETS MARKET, BY TYPE, 2010-2032 (MILLION UNITS)
    TABLE 239. LATIN AMERICA PALLETS MARKET, BY APPLICATION, 2010-2032 ($MILLION)
    TABLE 240. LATIN AMERICA PALLETS MARKET, BY APPLICATION, 2010-2032 (MILLION UNITS)
    TABLE 241. LATIN AMERICA PALLETS MARKET, BY END-USER, 2010-2032 ($MILLION)
    TABLE 242. LATIN AMERICA PALLETS MARKET, BY END-USER, 2010-2032 (MILLION UNITS)
    TABLE 243. MIDDLE EAST PALLETS MARKET, BY MATERIAL, 2010-2032 ($MILLION)
    TABLE 244. MIDDLE EAST PALLETS MARKET, BY MATERIAL, 2010-2032 (MILLION UNITS)
    TABLE 245. MIDDLE EAST PALLETS MARKET, BY TYPE, 2010-2032 ($MILLION)
    TABLE 246. MIDDLE EAST PALLETS MARKET, BY TYPE, 2010-2032 (MILLION UNITS)
    TABLE 247. MIDDLE EAST PALLETS MARKET, BY APPLICATION, 2010-2032 ($MILLION)
    TABLE 248. MIDDLE EAST PALLETS MARKET, BY APPLICATION, 2010-2032 (MILLION UNITS)
    TABLE 249. MIDDLE EAST PALLETS MARKET, BY END-USER, 2010-2032 ($MILLION)
    TABLE 250. MIDDLE EAST PALLETS MARKET, BY END-USER, 2010-2032 (MILLION UNITS)
    TABLE 251. AFRICA PALLETS MARKET, BY MATERIAL, 2010-2032 ($MILLION)
    TABLE 252. AFRICA PALLETS MARKET, BY MATERIAL, 2010-2032 (MILLION UNITS)
    TABLE 253. AFRICA PALLETS MARKET, BY TYPE, 2010-2032 ($MILLION)
    TABLE 254. AFRICA PALLETS MARKET, BY TYPE, 2010-2032 (MILLION UNITS)
    TABLE 255. AFRICA PALLETS MARKET, BY APPLICATION, 2010-2032 ($MILLION)
    TABLE 256. AFRICA PALLETS MARKET, BY APPLICATION, 2010-2032 (MILLION UNITS)
    TABLE 257. AFRICA PALLETS MARKET, BY END-USER, 2010-2032 ($MILLION)
    TABLE 258. AFRICA PALLETS MARKET, BY END-USER, 2010-2032 (MILLION UNITS)
    TABLE 259. BRAMBLES LIMITED: KEY EXECUTIVES
    TABLE 260. BRAMBLES LIMITED: COMPANY SNAPSHOT
    TABLE 261. BRAMBLES LIMITED: PRODUCT SEGMENTS
    TABLE 262. BRAMBLES LIMITED: PRODUCT PORTFOLIO
    TABLE 263. SCHOELLER ALLIBERT SERVICES B.V. (SCHOELLER ALLIBERT): KEY EXECUTIVES
    TABLE 264. SCHOELLER ALLIBERT SERVICES B.V. (SCHOELLER ALLIBERT): COMPANY SNAPSHOT
    TABLE 265. SCHOELLER ALLIBERT SERVICES B.V. (SCHOELLER ALLIBERT): PRODUCT SEGMENTS
    TABLE 266. SCHOELLER ALLIBERT SERVICES B.V. (SCHOELLER ALLIBERT): PRODUCT PORTFOLIO
    TABLE 267. SCHOELLER ALLIBERT SERVICES B.V. (SCHOELLER ALLIBERT): KEY STRATERGIES
    TABLE 268. UFP INDUSTRIES, INC. (PALLETONE): KEY EXECUTIVES
    TABLE 269. UFP INDUSTRIES, INC. (PALLETONE): COMPANY SNAPSHOT
    TABLE 270. UFP INDUSTRIES, INC. (PALLETONE): PRODUCT SEGMENTS
    TABLE 271. UFP INDUSTRIES, INC. (PALLETONE): PRODUCT PORTFOLIO
    TABLE 272. UFP INDUSTRIES, INC. (PALLETONE): KEY STRATERGIES
    TABLE 273. CABKA GROUP GMBH (CABKA): KEY EXECUTIVES
    TABLE 274. CABKA GROUP GMBH (CABKA): COMPANY SNAPSHOT
    TABLE 275. CABKA GROUP GMBH (CABKA): PRODUCT SEGMENTS
    TABLE 276. CABKA GROUP GMBH (CABKA): PRODUCT PORTFOLIO
    TABLE 277. REHRIG PACIFIC HOLDINGS, INC. (REHRIG PACIFIC): KEY EXECUTIVES
    TABLE 278. REHRIG PACIFIC HOLDINGS, INC. (REHRIG PACIFIC): COMPANY SNAPSHOT
    TABLE 279. REHRIG PACIFIC HOLDINGS, INC. (REHRIG PACIFIC): PRODUCT SEGMENTS
    TABLE 280. REHRIG PACIFIC HOLDINGS, INC. (REHRIG PACIFIC): PRODUCT PORTFOLIO
    TABLE 281. CRAEMER HOLDING GMBH (CRAEMER): KEY EXECUTIVES
    TABLE 282. CRAEMER HOLDING GMBH (CRAEMER): COMPANY SNAPSHOT
    TABLE 283. CRAEMER HOLDING GMBH (CRAEMER): PRODUCT SEGMENTS
    TABLE 284. CRAEMER HOLDING GMBH (CRAEMER): PRODUCT PORTFOLIO
    TABLE 285. CRAEMER HOLDING GMBH (CRAEMER): KEY STRATERGIES
    TABLE 286. MENASHA CORPORATION: KEY EXECUTIVES
    TABLE 287. MENASHA CORPORATION: COMPANY SNAPSHOT
    TABLE 288. MENASHA CORPORATION: PRODUCT SEGMENTS
    TABLE 289. MENASHA CORPORATION: PRODUCT PORTFOLIO
    TABLE 290. MENASHA CORPORATION: KEY STRATERGIES
    TABLE 291. LOSCAM INTERNATIONAL HOLDINGS CO., LTD. (LOSCAM): KEY EXECUTIVES
    TABLE 292. LOSCAM INTERNATIONAL HOLDINGS CO., LTD. (LOSCAM): COMPANY SNAPSHOT
    TABLE 293. LOSCAM INTERNATIONAL HOLDINGS CO., LTD. (LOSCAM): PRODUCT SEGMENTS
    TABLE 294. LOSCAM INTERNATIONAL HOLDINGS CO., LTD. (LOSCAM): PRODUCT PORTFOLIO
    TABLE 295. MILLWOOD, INC.: KEY EXECUTIVES
    TABLE 296. MILLWOOD, INC.: COMPANY SNAPSHOT
    TABLE 297. MILLWOOD, INC.: PRODUCT SEGMENTS
    TABLE 298. MILLWOOD, INC.: PRODUCT PORTFOLIO
    TABLE 299. MILLWOOD, INC.: KEY STRATERGIES
    TABLE 300. FALKENHAHN AG (FALKENHAHN): KEY EXECUTIVES
    TABLE 301. FALKENHAHN AG (FALKENHAHN): COMPANY SNAPSHOT
    TABLE 302. FALKENHAHN AG (FALKENHAHN): PRODUCT SEGMENTS
    TABLE 303. FALKENHAHN AG (FALKENHAHN): PRODUCT PORTFOLIO
  • LIST OF FIGURES

  • FIGURE 01. PALLETS MARKET, 2010-2032
    FIGURE 02. SEGMENTATION OF PALLETS MARKET, 2010-2032
    FIGURE 03. TOP INVESTMENT POCKETS IN PALLETS MARKET (2023-2032)
    FIGURE 04. LOW BARGAINING POWER OF SUPPLIERS
    FIGURE 05. LOW BARGAINING POWER OF BUYERS
    FIGURE 06. LOW THREAT OF SUBSTITUTES
    FIGURE 07. LOW THREAT OF NEW ENTRANTS
    FIGURE 08. LOW INTENSITY OF RIVALRY
    FIGURE 09. DRIVERS, RESTRAINTS AND OPPORTUNITIES: GLOBALPALLETS MARKET
    FIGURE 10. PALLETS MARKET, BY MATERIAL, 2010(%)
    FIGURE 11. COMPARATIVE SHARE ANALYSIS OF PALLETS MARKET FOR WOOD, BY COUNTRY 2010 AND 2032(%)
    FIGURE 12. COMPARATIVE SHARE ANALYSIS OF PALLETS MARKET FOR PLASTIC VIA INJECTION MOLDING, BY COUNTRY 2010 AND 2032(%)
    FIGURE 13. COMPARATIVE SHARE ANALYSIS OF PALLETS MARKET FOR PLASTIC VIA OTHER METHODS, BY COUNTRY 2010 AND 2032(%)
    FIGURE 14. COMPARATIVE SHARE ANALYSIS OF PALLETS MARKET FOR CORRUGATED PAPER, BY COUNTRY 2010 AND 2032(%)
    FIGURE 15. COMPARATIVE SHARE ANALYSIS OF PALLETS MARKET FOR METAL, BY COUNTRY 2010 AND 2032(%)
    FIGURE 16. PALLETS MARKET, BY TYPE, 2010(%)
    FIGURE 17. COMPARATIVE SHARE ANALYSIS OF PALLETS MARKET FOR RACKABLE, BY COUNTRY 2010 AND 2032(%)
    FIGURE 18. COMPARATIVE SHARE ANALYSIS OF PALLETS MARKET FOR NESTABLE, BY COUNTRY 2010 AND 2032(%)
    FIGURE 19. COMPARATIVE SHARE ANALYSIS OF PALLETS MARKET FOR STACKABLE, BY COUNTRY 2010 AND 2032(%)
    FIGURE 20. COMPARATIVE SHARE ANALYSIS OF PALLETS MARKET FOR DISPLAY, BY COUNTRY 2010 AND 2032(%)
    FIGURE 21. PALLETS MARKET, BY APPLICATION, 2010(%)
    FIGURE 22. COMPARATIVE SHARE ANALYSIS OF PALLETS MARKET FOR RENTAL, BY COUNTRY 2010 AND 2032(%)
    FIGURE 23. COMPARATIVE SHARE ANALYSIS OF PALLETS MARKET FOR NON-RENTAL, BY COUNTRY 2010 AND 2032(%)
    FIGURE 24. PALLETS MARKET, BY END-USER, 2010(%)
    FIGURE 25. COMPARATIVE SHARE ANALYSIS OF PALLETS MARKET FOR FOOD AND BEVERAGE, BY COUNTRY 2010 AND 2032(%)
    FIGURE 26. COMPARATIVE SHARE ANALYSIS OF PALLETS MARKET FOR CHEMICAL, BY COUNTRY 2010 AND 2032(%)
    FIGURE 27. COMPARATIVE SHARE ANALYSIS OF PALLETS MARKET FOR RETAIL, BY COUNTRY 2010 AND 2032(%)
    FIGURE 28. COMPARATIVE SHARE ANALYSIS OF PALLETS MARKET FOR PHARMACEUTICAL, BY COUNTRY 2010 AND 2032(%)
    FIGURE 29. COMPARATIVE SHARE ANALYSIS OF PALLETS MARKET FOR OTHERS, BY COUNTRY 2010 AND 2032(%)
    FIGURE 30. PALLETS MARKET BY REGION, 2010
    FIGURE 31. U.S. PALLETS MARKET, 2010-2032 ($MILLION)
    FIGURE 32. CANADA PALLETS MARKET, 2010-2032 ($MILLION)
    FIGURE 33. MEXICO PALLETS MARKET, 2010-2032 ($MILLION)
    FIGURE 34. GERMANY PALLETS MARKET, 2010-2032 ($MILLION)
    FIGURE 35. FRANCE PALLETS MARKET, 2010-2032 ($MILLION)
    FIGURE 36. UK PALLETS MARKET, 2010-2032 ($MILLION)
    FIGURE 37. ITALY PALLETS MARKET, 2010-2032 ($MILLION)
    FIGURE 38. REST OF EUROPE PALLETS MARKET, 2010-2032 ($MILLION)
    FIGURE 39. CHINA PALLETS MARKET, 2010-2032 ($MILLION)
    FIGURE 40. JAPAN PALLETS MARKET, 2010-2032 ($MILLION)
    FIGURE 41. SOUTH KOREA PALLETS MARKET, 2010-2032 ($MILLION)
    FIGURE 42. INDIA PALLETS MARKET, 2010-2032 ($MILLION)
    FIGURE 43. INDONESIA PALLETS MARKET, 2010-2032 ($MILLION)
    FIGURE 44. MALAYSIA PALLETS MARKET, 2010-2032 ($MILLION)
    FIGURE 45. THAILAND PALLETS MARKET, 2010-2032 ($MILLION)
    FIGURE 46. VIET NAM PALLETS MARKET, 2010-2032 ($MILLION)
    FIGURE 47. CAMBODIA PALLETS MARKET, 2010-2032 ($MILLION)
    FIGURE 48. LAO PEOPLE PALLETS MARKET, 2010-2032 ($MILLION)
    FIGURE 49. REST OF ASIA-PACIFIC PALLETS MARKET, 2010-2032 ($MILLION)
    FIGURE 50. LATIN AMERICA PALLETS MARKET, 2010-2032 ($MILLION)
    FIGURE 51. MIDDLE EAST PALLETS MARKET, 2010-2032 ($MILLION)
    FIGURE 52. AFRICA PALLETS MARKET, 2010-2032 ($MILLION)
    FIGURE 53. TOP WINNING STRATEGIES, BY YEAR
    FIGURE 54. TOP WINNING STRATEGIES, BY DEVELOPMENT
    FIGURE 55. TOP WINNING STRATEGIES, BY COMPANY
    FIGURE 56. PRODUCT MAPPING OF TOP 10 PLAYERS
    FIGURE 57. COMPETITIVE DASHBOARD
    FIGURE 58. COMPETITIVE HEATMAP: PALLETS MARKET
    FIGURE 59. TOP PLAYER POSITIONING, 2010
    FIGURE 60. BRAMBLES LIMITED: NET REVENUE, 2020-2022 ($MILLION)
    FIGURE 61. BRAMBLES LIMITED: REVENUE SHARE BY SEGMENT, 2022 (%)
    FIGURE 62. BRAMBLES LIMITED: REVENUE SHARE BY SEGMENT, 2022 (%)
    FIGURE 63. SCHOELLER ALLIBERT SERVICES B.V. (SCHOELLER ALLIBERT): NET REVENUE, 2020-2022 ($MILLION)
    FIGURE 64. SCHOELLER ALLIBERT SERVICES B.V. (SCHOELLER ALLIBERT): RESEARCH & DEVELOPMENT EXPENDITURE, 2020-2022
    FIGURE 65. SCHOELLER ALLIBERT SERVICES B.V. (SCHOELLER ALLIBERT): REVENUE SHARE BY SEGMENT, 2022 (%)
    FIGURE 66. SCHOELLER ALLIBERT SERVICES B.V. (SCHOELLER ALLIBERT): REVENUE SHARE BY REGION, 2022 (%)
    FIGURE 67. UFP INDUSTRIES, INC. (PALLETONE): NET SALES, 2020-2022 ($MILLION)
    FIGURE 68. UFP INDUSTRIES, INC. (PALLETONE): REVENUE SHARE BY SEGMENT, 2022 (%)
    FIGURE 69. UFP INDUSTRIES, INC. (PALLETONE): REVENUE SHARE BY REGION, 2022 (%)
    FIGURE 70. CABKA GROUP GMBH (CABKA): NET REVENUE, 2020-2022 ($MILLION)
    FIGURE 71. CABKA GROUP GMBH (CABKA): REVENUE SHARE BY REGION, 2022 (%)


PURCHASE OPTIONS

Call or Email us

U.S.-Canada Toll-free: +1-800-792-5285
Int'l : +1-503-894-6022
Europe : +44-845-528-1300
Email : help@alliedmarketresearch.com
 
FREQUENTLY ASKED QUESTIONS?

A. The global pallets market was valued at $57,389.4 million in 2010, and is projected to reach $130,453.7 million by 2032, registering a CAGR of 4.1% from 2023 to 2032.

A. The forecast period considered for the global pallets market is 2023 to 2032, wherein, 2022 is the base year, 2023 is the estimated year, and 2031 is the forecast year.

A. The latest version of the global pallets market report can be obtained on demand from the website.

A. The base year considered in the global pallets market report is 2022.

A. The major players profiled in the pallets market include Brambles Limited, CABKA Group GmbH (CABKA), Craemer Holding GmbH (CRAEMER), Falkenhahn AG (Falkenhahn), LOSCAM International Holdings Co., Ltd. (LOSCAM), Menasha Corporation, Millwood, Inc., Rehrig Pacific Holdings, Inc. (Rehrig Pacific), Schoeller Allibert Services B.V. (Schoeller Allibert), and UFP Industries, Inc. (PalletOne).

A. The top ten market players are selected based on two key attributes - competitive strength and market positioning.

A. The report contains an exclusive company profile section, where leading companies in the market are profiled. These profiles typically cover company overview, geographical presence, market dominance (in terms of revenue and volume sales), various strategies, and recent developments.

A. Based on type, the stackable segment dominated the market in 2022.

Looking for Customization?

 Customization Request

Have a Question?

 Speak with Analyst

Any Confusion?

 Inquire Before Buying

Have a glance of the Report

  Request Sample
RELATED TAGS

Purchase Full Report of
Pallets Market

Start reading instantly.
This Report and over 66,783+ more Reports, Available with Avenue Library. T&C*.

  • Online Only
  • $3,690
  • Online cloud access only
  • Restricted print, copy, paste & download
  • Read only
  • Free industry update
    (Within 180 days)
  • Free report update in next update cycle
    (May 2024 - May 2025)
  • Data Pack
  • $3,930
  • Restricted to one authorized user
  • One print only
  • Available in
    Excel
  • Free industry update
    (Within 180 days)
  •   Free report update in next update cycle
    (May 2024 - May 2025)
  • Single User
  • $5,820
  • Restricted to one authorized user
  • One print only
  • Available in
    PDF
  • Free industry update
    (Within 180 days)
  •   Free report update in next update cycle
    (May 2024 - May 2025)
  • Five Users
  • $6,540
  • Limited to five authorized users
  • Print upto five copies
  • Available in
    PDF
  • Free industry update
    (Within 180 days)
  •   Free report update in next update cycle
    (May 2024 - May 2025)
  • Enterprise
    License/PDF

  • $9,870
  • Unlimited
    within
    company/enterprise
  • Available in Excel & PDF
  • Free industry update
    (Within 180 days)
  •   Free report update in next update cycle
    (May 2024 - May 2025)
  • Library
    Membership

  • $999 $ 1,175
    Per User/ Per month/ Billed annually
  • Published Content
    E-access
  • Company Profiles
    E-access
  • Newly Added Content Access
  • 10 PDF
    Downloads
  • 5 Excel Data
    Pack Downloads
  • 250 Company Profiles PDF Downloads
  • Buy Now

*Taxes/Fees, if applicable will be added during checkout. All prices in USD

RELATED REPORTS
 

Why Allied Market Research?


Infallible Methodology

To ensure high-level data integrity, accurate analysis, and impeccable forecasts

Analyst Support

For complete satisfaction

Customization

On-demand customization of scope of the report to exactly meet your needs

TARGETED MARKET VIEW

Targeted market view to provide pertinent information and save time of readers

Get fresh content delivered

Get insights on topics that are crucial for your business. Stay abreast of your interest areas.

Get Industry Data Alerts

Why Allied Market Research?

Infallible Methodology

To ensure high-level data integrity, accurate analysis, and impeccable forecasts

Analyst Support

For complete satisfaction

Customization

On-demand customization of scope of the report to exactly meet your needs

TARGETED MARKET VIEW

Targeted market view to provide pertinent information and save time of readers