0
2022
Paper Straw Market

Paper Straw Market

by Material (Virgin paper, Recycled paper), by Product (Printed, Non-printed), by Application (Foodservice, Household): Global Opportunity Analysis and Industry Forecast, 2021-2031

Report Code: A07893
Sep 2022 | Pages: 240
Tables: 166
Charts: 56
  • Formats*:

  • pdf

    Single User License, Five User
    License & Enterprise User License

  • xls

    Data Pack Excel License

  • ppt

    It comes with the additional cost
    of $2500.00 contact sales.


Paper Straw Market Research, 2031

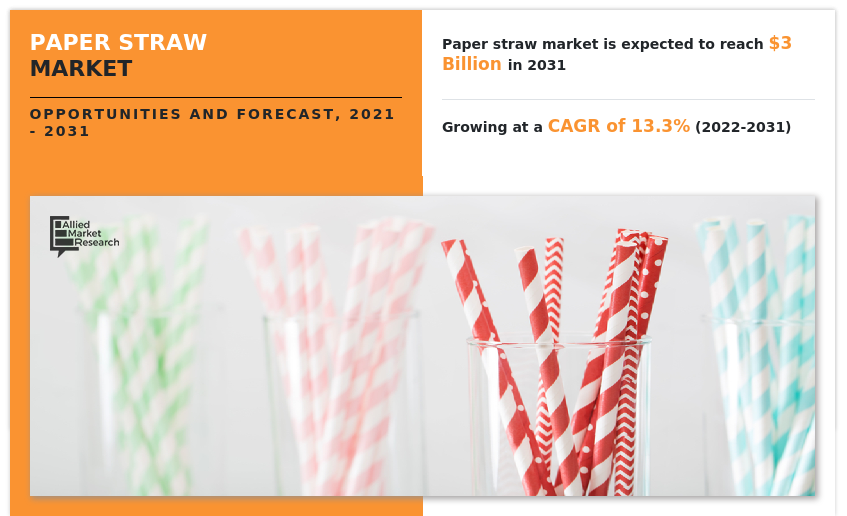
The global paper straw market size was valued at $865.3 million in 2021, and is projected to reach $3 billion by 2031, growing at a CAGR of 13.3% from 2022 to 2031. Paper straw is a thin tube made of waterproof paper that is used to suck liquid into the mouth. During the paper straw manufacturing process, several thin reels of paper are run through a glue bath. These tacky reels are then wound together into a long paper cylinder. Those long cylinder tubes are then cut to size, packaged, and shipped.

The paper straw market was hampered during the outbreak of COVID-19 owing to complete shutdown of restaurants and hotels as well as limitations on household supplies.

The global paper straw market is in the introductory phase of the industry life cycle and is expected to explore new growth opportunities during the coming years. Some of the basic factors driving the demand for the market include, governmental initiatives to eliminate use of plastic and strict regulatory outlook against the use of conventional plastic products for manufacturing of utensils.

Paper Straw Market, Paper Straw Industry, Paper Straw Market Size, Paper Straw Market Share, Paper Straw Market Growth, Paper Straw Market Trends, Paper Straw Market Analysis, Paper Straw Market Forecast, Paper Straw Market Opportunities

Industry trends are shifting toward bio-based products to reduce dependence on conventional plastics for straws. Moreover, most of the manufacturers in industries, such as packaging, textile, and agriculture are shifting toward bio-based products for manufacturing of straws and other utensils due to stringent regulations from the government. Such factors are largely impacting the paper straw market growth.

Paper Straw Market

On the other hand, the growth of the market is negatively impacted by strict government regulations while installation of machines used for manufacturing of paper straws. During the outbreak of the COVID-19 pandemic, construction, manufacturing, hotel, and tourism industries were majorly affected. Manufacturing activities were halted or restricted. This led to decline in manufacturing of various equipment used for manufacturing of paper straw as well as their demand in the market, thereby restraining the growth of the paper straw industry. Conversely, industries are gradually resuming their regular manufacturing and services. This is expected to lead to re-initiation of paper straw companies at their full-scale capacities, that helped the paper straw market share to recover by end of 2021.

Paper Straw Market

The paper straw market is segmented on the basis of material, product, end user, and region. By material, the market is fragmented into virgin paper and recycled paper. By product, the global market is categorized into printed and non-printed. By end user, the market is divided into food service and household. Region-wise, the market analysis is conducted across North America (the U.S., Canada, and Mexico), Europe (UK, France, Germany, Italy, and Rest of Europe), Asia-Pacific (China, Japan, India, South Korea, and Rest of Asia-Pacific), and LAMEA (Latin America, the Middle East, and Africa).

Paper Straw Market

On the basis of material, in 2021 the recycled paper segment dominated the paper straw market, in terms of revenue, and is expected to witness growth at the highest CAGR during the forecast period. As per product, in 2021, the printed segment led the market, and is expected to exhibit highest CAGR in the near future. By end user, the foodservice segment led the market in 2021, in terms of revenue and the household segment is anticipated to register highest CAGR during the forecast period. Region wise, Europe garnered the highest revenue in 2021; however, Asia-Pacific is anticipated to register highest CAGR during the forecast period.

Paper Straw Market

COMPETITION ANALYSIS

The major players profiled in the paper straw  market report include, Aleco Industrial Co. Ltd., Biopak , Bygreen, Canada Brown Eco Products Ltd , Charta Global , Focus Technology Co., Ltd. , Footprint , Fuling Global Inc. , Hoffmaster Group, Inc. , Huhtamaki Oyj , Lollicup USA, Inc. , Ningbo Jiangbei Shenyu Industry and Trade Co., Ltd. , Shenzhen Grizzlies Industries Co., LTD , Soton Daily Necessities Co., Ltd. , Tipi Straws, Transcend Packaging Ltd., and YuTong Eco-Technology (SuQian) Co., Ltd. Major companies in the market have adopted product launch and business expansion as their key developmental strategies to offer better products and services to customers in the paper straw market.

Key Benefits For Stakeholders

  • This report provides a quantitative analysis of the market segments, current trends, estimations, and dynamics of the paper straw market analysis from 2021 to 2031 to identify the prevailing paper straw market opportunities.
  • The market research is offered along with information related to key drivers, restraints, and opportunities.
  • Porter's five forces analysis highlights the potency of buyers and suppliers to enable stakeholders make profit-oriented business decisions and strengthen their supplier-buyer network.
  • In-depth analysis of the paper straw market forecast.
  • Major countries in each region are mapped according to their revenue contribution to the global market.
  • Market player positioning facilitates benchmarking and provides a clear understanding of the present position of the market players.
  • The report includes the analysis of the regional as well as global paper straw market trends, key players, market segments, application areas, and market growth strategies.

Paper Straw Market Report Highlights

Aspects Details
Market Size By 2031 USD 3 billion
Growth Rate CAGR of 13.3%
Forecast period 2021 - 2031
Report Pages 240
By Product
  • Printed
  • Non-printed
By Material
  • Virgin paper
  • Recycled paper
By Application
  • Foodservice
  • Household
By Region
  • North America  (U.S., Canada, Mexico)
  • Europe  (Germany, UK, France, Italy, Rest Of Europe)
  • Asia-Pacific  (China, Japan, South Korea, India, Rest Of Asia-Pacific)
  • LAMEA  (Latin America, Middle East, Africa)
Key Market Players Huhtamaki Oyj, Shenzhen Grizzlies Industries Co., LTD, ALECO INDUSTRIAL CO., LTD., Canada Brown Eco Products Ltd, Focus Technology Co., Ltd., Bygreen, YuTong Eco-Technology (SuQian) Co., Ltd, Footprint, Lollicup USA, Inc., Transcend Packaging Ltd., Ningbo Jiangbei Shenyu Industry and Trade Co., Ltd., Hoffmaster Group, Inc., BioPak, Tipi Straws, Soton Daily Necessities Co., Ltd., Fuling Global Inc., charta global, inc.
 

CHAPTER 1:INTRODUCTION

1.1.Report description
1.2.Key benefits for stakeholders
1.3.Key market segments
1.4.Key Players
1.5.Research methodology

1.5.1.Primary research
1.5.2.Secondary research
1.5.3.Analyst tools and models

CHAPTER 2:EXECUTIVE SUMMARY

2.1.CXO perspective

CHAPTER 3:MARKET OVERVIEW

3.1.Market definition and scope
3.2.Key findings

3.2.1.Top investment pockets
3.2.2.Top investment factors

3.3.Key forces shaping paper straw market
3.4.PESTEL Analysis

3.4.1.Political
3.4.2.Economic
3.4.3.Socio-Culture
3.4.4.Technology
3.4.5.Environment
3.4.6.Legal

3.5.Parent market analysis
3.6.Value chain analysis
3.7.Smiling curve value chain model
3.8.Product life-cycle analysis
3.9.Market dynamics

3.9.1.Drivers

3.9.1.1.Eco-friendly nature and rise in consumer adoption of biodegradable materials
3.9.1.2.Rise in awareness about personal hygiene

3.9.2.Restraints

3.9.2.1.Strict government regulations

3.9.3.Opportunities

3.9.3.1.Rise in technological innovations

3.10.COVID-19 impact analysis

CHAPTER 4:PAPER STRAW MARKET, BY MATERIAL

4.1.Market overview

4.1.1.Market size and forecast, by material

4.2.Virgin Paper

4.2.1.Key market trends, growth factors, and opportunities
4.2.2.Market size and forecast, by region
4.2.3.Market analysis, by country

4.3.Recycled paper

4.3.1.Key market trends, growth factors, and opportunities
4.3.2.Market size and forecast, by region
4.3.3.Market analysis, by country

CHAPTER 5:PAPER STRAW MARKET, BY PRODUCT

5.1.Market overview

5.1.1.Market size and forecast, by product

5.2.Printed

5.2.1.Key market trends, growth factors, and opportunities
5.2.2.Market size and forecast, by region
5.2.3.Market analysis, by country

5.3.Non-Printed

5.3.1.Key market trends, growth factors, and opportunities
5.3.2.Market size and forecast, by region
5.3.3.Market analysis, by country

CHAPTER 6:PAPER STRAW MARKET, BY END USER

6.1.Market overview

6.1.1.Market size and forecast, by end user

6.2.Foodservice

6.2.1.Key market trends, growth factors, and opportunities
6.2.2.Market size and forecast, by region
6.2.3.Market analysis, by country
6.2.4.Market size and forecast, for foodservice, by supplier

6.2.4.1.OEM

6.2.4.1.1.Market size and forecast, by region

6.2.4.2.Third party

6.2.4.2.1.Market size and forecast, by region

6.2.4.3.Market size and forecast for OEM, by sales type

6.2.4.3.1.Online

6.2.4.3.1.1.Market size and forecast, by region

6.2.4.3.2.Offline

6.2.4.3.2.1.Market size and forecast, by region

6.2.4.4.Market size and forecast for third party, by sales type

6.2.4.4.1.Online

6.2.4.4.1.1.Market size and forecast, by region

6.2.4.4.2.Offline

6.2.4.4.2.1.Market size and forecast, by region

6.3.Household

6.3.1.Key market trends, growth factors, and opportunities
6.3.2.Market size and forecast, by region
6.3.3.Market analysis, by country

CHAPTER 7:PAPER STRAW MARKET, BY REGION

7.1.Market overview

7.1.1.Market size and forecast, by region

7.2.North America

7.2.1.Key market trends, growth factors, and opportunities
7.2.2.Market size and forecast, by material
7.2.3.Market size and forecast, by product
7.2.4.Market size and forecast, by end user

7.2.4.1.North America market size and forecast, for foodservice, by supplier

7.2.4.1.1.North America market size and forecast, for OEM, by sales type
7.2.4.1.2.North America market size and forecast, for third party, by sales type

7.2.5.Market size and forecast, by country

7.2.5.1.U.S.

7.2.5.1.1.Market size and forecast, by material
7.2.5.1.2.Market size and forecast, by product
7.2.5.1.3.Market size and forecast, by end user

7.2.5.2.Canada

7.2.5.2.1.Market size and forecast, by material
7.2.5.2.2.Market size and forecast, by product
7.2.5.2.3.Market size and forecast, by end user

7.2.5.3.Mexico

7.2.5.3.1.Market size and forecast, by material
7.2.5.3.2.Market size and forecast, by product
7.2.5.3.3.Market size and forecast, by end user

7.3.Europe

7.3.1.Key market trends, growth factors, and opportunities
7.3.2.Market size and forecast, by material
7.3.3.Market size and forecast, by product
7.3.4.Market size and forecast, by end user

7.3.4.1.Europe market size and forecast, for food service, by supplier

7.3.4.1.1.Europe market size and forecast, for OEM, by sales type
7.3.4.1.2.Europe market size and forecast, for third party, by sales type

7.3.5.Market size and forecast, by country

7.3.5.1.Germany

7.3.5.1.1.Market size and forecast, by material
7.3.5.1.2.Market size and forecast, by product
7.3.5.1.3.Market size and forecast, by end user

7.3.5.2.France

7.3.5.2.1.Market size and forecast, by material
7.3.5.2.2.Market size and forecast, by product
7.3.5.2.3.Market size and forecast, by end user

7.3.5.3.UK

7.3.5.3.1.Market size and forecast, by material
7.3.5.3.2.Market size and forecast, by product
7.3.5.3.3.Market size and forecast, by end user

7.3.5.4.Italy

7.3.5.4.1.Market size and forecast, by material
7.3.5.4.2.Market size and forecast, by product
7.3.5.4.3.Market size and forecast, by end user

7.3.5.5.Rest of Europe

7.3.5.5.1.Market size and forecast, by material
7.3.5.5.2.Market size and forecast, by product
7.3.5.5.3.Market size and forecast, by end user

7.4.Asia-Pacific

7.4.1.Key market trends, growth factors, and opportunities
7.4.2.Market size and forecast, by material
7.4.3.Market size and forecast, by product
7.4.4.Market size and forecast, by end user

7.4.4.1.Asia-Pacific market size and forecast, for foodservice, by supplier

7.4.4.1.1.Asia-Pacific market size and forecast, for OEM, by sales type
7.4.4.1.2.Asia-Pacific market size and forecast, for third party, by sales type

7.4.5.Market size and forecast, by country

7.4.5.1.China

7.4.5.1.1.Market size and forecast, by material
7.4.5.1.2.Market size and forecast, by product
7.4.5.1.3.Market size and forecast, by end user

7.4.5.2.Japan

7.4.5.2.1.Market size and forecast, by material
7.4.5.2.2.Market size and forecast, by product
7.4.5.2.3.Market size and forecast, by end user

7.4.5.3.South Korea

7.4.5.3.1.Market size and forecast, by material
7.4.5.3.2.Market size and forecast, by product
7.4.5.3.3.Market size and forecast, by end user

7.4.5.4.India

7.4.5.4.1.Market size and forecast, by material
7.4.5.4.2.Market size and forecast, by product
7.4.5.4.3.Market size and forecast, by end user

7.4.5.5.Rest of Asia-Pacific

7.4.5.5.1.Market size and forecast, by material
7.4.5.5.2.Market size and forecast, by product
7.4.5.5.3.Market size and forecast, by end user

7.5.LAMEA

7.5.1.Key market trends, growth factors, and opportunities
7.5.2.Market size and forecast, by material
7.5.3.Market size and forecast, by product
7.5.4.Market size and forecast, by end user

7.5.4.1.LAMEA market size and forecast, for foodservice, by supplier

7.5.4.1.1.LAMEA market size and forecast, for OEM, by sales type
7.5.4.1.2.LAMEA market size and forecast, for third party, by sales type

7.5.5.Market size and forecast, by country

7.5.5.1.Latin America

7.5.5.1.1.Market size and forecast, by material
7.5.5.1.2.Market size and forecast, by product
7.5.5.1.3.Market size and forecast, by end user

7.5.5.2.Middle East

7.5.5.2.1.Market size and forecast, by material
7.5.5.2.2.Market size and forecast, by product
7.5.5.2.3.Market size and forecast, by end user

7.5.5.3.Africa

7.5.5.3.1.Market size and forecast, by material
7.5.5.3.2.Market size and forecast, by product
7.5.5.3.3.Market size and forecast, by end user

CHAPTER 8:COMPETITIVE LANDSCAPE

8.1.Introduction
8.2.Top player positioning 2021
8.3.Top winning strategies

8.3.1.Top winning strategies, by year
8.3.2.Top winning strategies, by development
8.3.3.Top winning strategies, by company

8.4.Product Mapping
8.5.Competitive dashboard
8.6.Competitive heat map
8.7.Key developments

8.7.1.Product Launch
8.7.2.Business Expansion

CHAPTER 9:COMPANY PROFILES

9.1.BIOPAK

9.1.1.Company overview
9.1.2.Key executive
9.1.3.Company snapshot
9.1.4.Product portfolio

9.2.BYGREEN

9.2.1.Company overview
9.2.2.Key executive
9.2.3.Company snapshot
9.2.4.Product portfolio

9.3.CANADA BROWN ECO PRODUCTS LTD.

9.3.1.Company overview
9.3.2.Key executive
9.3.3.Company snapshot
9.3.4.Product portfolio

9.4.CHARTA GLOBAL

9.4.1.Company overview
9.4.2.Key executive
9.4.3.Company snapshot
9.4.4.Product portfolio
9.4.5.Key strategic moves and developments

9.5.FULING GLOBAL INC.

9.5.1.Company overview
9.5.2.Key executive
9.5.3.Company snapshot
9.5.4.Product portfolio

9.6.HOFFMASTER GROUP, INC.

9.6.1.Company overview
9.6.2.Key executive
9.6.3.Company snapshot
9.6.4.Product portfolio

9.7.HUHTAMAKI OYJ

9.7.1.Company overview
9.7.2.Key executive
9.7.3.Company snapshot
9.7.4.Operating business segments
9.7.5.Product portfolio
9.7.6.Business performance
9.7.7.Key strategic moves and developments

9.8.KLEAN KANTEEN

9.8.1.Company overview
9.8.2.Key executive
9.8.3.Company snapshot
9.8.4.Product portfolio

9.9.LOLLICUP USA, INC.

9.9.1.Company overview
9.9.2.Key executive
9.9.3.Company snapshot
9.9.4.Product portfolio

9.10.NINGBO JIANGBEI SHENYU INDUSTRY AND TRADE CO., LTD.

9.10.1.Company overview
9.10.2.Key executive
9.10.3.Company snapshot
9.10.4.Product portfolio

9.11.SHENZHEN GRIZZLIES’ INDUSTRIES CO., LTD.

9.11.1.Company overview
9.11.2.Key executive
9.11.3.Company snapshot
9.11.4.Product portfolio

9.12.SOTON DAILY NECESSITIES CO., LTD.

9.12.1.Company overview
9.12.2.Key executive
9.12.3.Company snapshot
9.12.4.Product portfolio

9.13.SOUTHEASTERN LIQUID ANALYZERS

9.13.1.Company overview
9.13.2.Key executive
9.13.3.Company snapshot
9.13.4.Product portfolio

9.14.THE PAPER STRAW

9.14.1.Company overview
9.14.2.Key executive
9.14.3.Company snapshot
9.14.4.Product portfolio

9.15.YUTONG ECO-TECHNOLOGY (SUQIAN) CO., LTD.

9.15.1.Company overview
9.15.2.Key executive
9.15.3.Company snapshot
9.15.4.Product portfolio

CHAPTER 10:KEY INNOVATORS

10.1.ALECO INDUSTRIAL CO. LTD.

10.1.1.Company overview
10.1.2.Key executive
10.1.3.Company snapshot
10.1.4.Product portfolio
10.1.5.AMR Perspective: Aleco Industrial Co. Ltd. Innovations and its Impact on the Market

10.2.TRANSCEND PACKAGING LTD.

10.2.1.Company overview
10.2.2.Key executive
10.2.3.Company snapshot
10.2.4.Product portfolio
10.2.5.AMR Perspective: Transcend Packaging Ltd. Innovations and its Impact on the Market

LIST OF TABLES

TABLE 01.PAPER STRAW MARKET, BY MATERIAL, 2021–2031 ($ MILLION)
TABLE 02.PAPER STRAW MARKET FOR VIRGIN PAPER STRAWS, BY REGION, 2021–2031 ($ MILLION)
TABLE 03.NORTH AMERICA PAPER STRAW MARKET FOR VIRGIN PAPER, BY COUNTRY, 2021–2031 ($ MILLION)
TABLE 04.EUROPE PAPER STRAW MARKET FOR VIRGIN PAPER, BY COUNTRY, 2021–2031 ($ MILLION)
TABLE 05.ASIA-PACIFIC PAPER STRAW MARKET FOR VIRGIN PAPER, BY COUNTRY, 2021–2031 ($ MILLION)
TABLE 06.LAMEA PAPER STRAW MARKET FOR VIRGIN PAPER, BY COUNTRY, 2021–2031 ($ MILLION)
TABLE 07.PAPER STRAW MARKET RECYCLED PAPER, BY REGION, 2021–2031 ($ MILLION)
TABLE 08.NORTH AMERICA PAPER STRAW MARKET FOR RECYCLED PAPER, BY COUNTRY, 2021–2031 ($ MILLION)
TABLE 09.EUROPE PAPER STRAW MARKET FOR RECYCLED PAPER, BY COUNTRY, 2021–2031 ($ MILLION)
TABLE 10.ASIA-PACIFIC PAPER STRAW MARKET FOR RECYCLED PAPER, BY COUNTRY, 2021–2031 ($ MILLION)
TABLE 11.LAMEA PAPER STRAW MARKET FOR RECYCLED PAPER, BY COUNTRY, 2021–2031 ($ MILLION)
TABLE 12.PAPER STRAW MARKET, BY PRODUCT, 2021–2031 ($ MILLION)
TABLE 13.PAPER STRAW MARKET FOR PRINTED, BY REGION, 2021–2031 ($ MILLION)
TABLE 14.NORTH AMERICA PAPER STRAW MARKET FOR PRINTED, BY COUNTRY, 2021–2031 ($ MILLION)
TABLE 15.EUROPE PAPER STRAW MARKET FOR PRINTED, BY COUNTRY, 2021–2031 ($ MILLION)
TABLE 16.ASIA-PACIFIC PAPER STRAW MARKET FOR PRINTED, BY COUNTRY, 2021–2031 ($ MILLION)
TABLE 17.LAMEA PAPER STRAW MARKET FOR PRINTED, BY COUNTRY, 2021–2031 ($ MILLION)
TABLE 18.PAPER STRAW MARKET FOR NON-PRINTED, BY REGION, 2021–2031 ($ MILLION)
TABLE 19.NORTH AMERICA PAPER STRAW MARKET FOR NON-PRINTED, BY COUNTRY, 2021–2031 ($ MILLION)
TABLE 20.EUROPE PAPER STRAW MARKET FOR NON-PRINTED, BY COUNTRY, 2021–2031 ($ MILLION)
TABLE 21.ASIA-PACIFIC PAPER STRAW MARKET FOR NON-PRINTED, BY COUNTRY, 2021–2031 ($ MILLION)
TABLE 22.LAMEA PAPER STRAW MARKET FOR NON-PRINTED, BY COUNTRY, 2021–2031 ($ MILLION)
TABLE 23.PAPER STRAW MARKET REVENUE, BY END USER, 2021–2031 ($ MILLION)
TABLE 24.PAPER STRAW MARKET FOR FOODSERVICE, BY REGION, 2021–2031 ($ MILLION)
TABLE 25.NORTH AMERICA PAPER STRAW MARKET FOR FOODSERVICE, BY COUNTRY, 2021–2031 ($ MILLION)
TABLE 26.EUROPE PAPER STRAW MARKET FOR FOODSERVICE, BY COUNTRY, 2021–2031 ($ MILLION)
TABLE 27.ASIA-PACIFIC PAPER STRAW MARKET FOR FOODSERVICE, BY COUNTRY, 2021–2031 ($ MILLION)
TABLE 28.LAMEA PAPER STRAW MARKET FOR FOODSERVICE, BY COUNTRY, 2021–2031 ($ MILLION)
TABLE 29.INVERTED POUCH MARKET FOR FOODSERVICE, BY SUPPLIER, 2021–2031 ($MILLION)
TABLE 30.INVERTED POUCH MARKET FOR OEM, BY REGION, 2021–2031 ($MILLION)
TABLE 31.INVERTED POUCH MARKET FOR THIRD PARTY, BY REGION, 2021–2031 ($MILLION)
TABLE 32.INVERTED POUCH MARKET FOR OEM, BY SALES TYPE, 2021–2031 ($MILLION)
TABLE 33.INVERTED POUCH MARKET FOR ONLINE, BY REGION 2021–2031 ($MILLION)
TABLE 34.INVERTED POUCH MARKET FOR OFFLINE, BY REGION, 2021–2031 ($MILLION)
TABLE 35.INVERTED POUCH MARKET FOR THIRD PARTY, BY SALES TYPE, 2021–2031 ($MILLION)
TABLE 36.INVERTED POUCH MARKET FOR ONLINE, BY REGION 2021–2031 ($MILLION)
TABLE 37.INVERTED POUCH MARKET FOR OFFLINE, BY REGION, 2021–2031 ($MILLION)
TABLE 38.PAPER STRAW MARKET FOR HOUSEHOLD, BY REGION, 2021–2031 ($ MILLION)
TABLE 39.NORTH AMERICA PAPER STRAW MARKET FOR HOUSEHOLD, BY COUNTRY, 2021–2031 ($ MILLION)
TABLE 40.EUROPE PAPER STRAW MARKET FOR HOUSEHOLD, BY COUNTRY, 2021–2031 ($ MILLION)
TABLE 41.ASIA-PACIFIC PAPER STRAW MARKET FOR HOUSEHOLD, BY COUNTRY, 2021–2031 ($ MILLION)
TABLE 42.LAMEA PAPER STRAW MARKET FOR HOUSEHOLD, BY COUNTRY, 2021–2031 ($ MILLION)
TABLE 43.PAPER STRAW MARKET, BY REGION, 2021–2031 ($ MILLION)
TABLE 44.PAPER STRAW MARKET, BY REGION, 2021–2031 ($ MILLION)
TABLE 45.NORTH AMERICA PAPER STRAW MARKET, BY MATERIAL, 2021–2031 ($ MILLION)
TABLE 46.NORTH AMERICA PAPER STRAW MARKET, BY PRODUCT, 2021–2031 ($ MILLION)
TABLE 47.NORTH AMERICA PAPER STRAW MARKET, BY END USER, 2021–2031 ($ MILLION)
TABLE 48.NORTH AMERICA PAPER STRAW MARKET, FOR FOODSERVICE, BY SUPPLIER, 2021–2031 ($ MILLION)
TABLE 49.NORTH AMERICA PAPER STRAW MARKET, FOR OEM, BY SALES TYPE, 2021–2031 ($ MILLION)
TABLE 50.NORTH AMERICA PAPER STRAW MARKET, FOR THIRD PARTY, BY SALES TYPE, 2021–2031 ($ MILLION)
TABLE 51.NORTH AMERICA PAPER STRAW MARKET, BY COUNTRY, 2021–2031 ($ MILLION)
TABLE 52.U.S. PAPER STRAW MARKET, BY MATERIAL, 2021–2031 ($ MILLION)
TABLE 53.U.S. PAPER STRAW MARKET, BY PRODUCT, 2021–2031 ($ MILLION)
TABLE 54.U.S. PAPER STRAW MARKET, BY END USER, 2021–2031 ($ MILLION)
TABLE 55.CANADA PAPER STRAW MARKET, BY MATERIAL, 2021–2031 ($ MILLION)
TABLE 56.CANADA PAPER STRAW MARKET, BY PRODUCT, 2021–2031 ($ MILLION)
TABLE 57.CANADA PAPER STRAW MARKET, BY END USER, 2021–2031 ($ MILLION)
TABLE 58.MEXICO PAPER STRAW MARKET, BY MATERIAL, 2021–2031 ($ MILLION)
TABLE 59.MEXICO PAPER STRAW MARKET, BY PRODUCT, 2021–2031 ($ MILLION)
TABLE 60.MEXICO PAPER STRAW MARKET, BY END USER, 2021–2031 ($ MILLION)
TABLE 61.EUROPE PAPER STRAW MARKET, BY MATERIAL, 2021–2031 ($ MILLION)
TABLE 62.EUROPE PAPER STRAW MARKET, BY PRODUCT, 2021–2031 ($ MILLION)
TABLE 63.EUROPE PAPER STRAW MARKET, BY END USER, 2021–2031 ($ MILLION)
TABLE 64.EUROPE PAPER STRAW MARKET, FOR FOODSERVICE, BY SUPPLIER, 2021–2031 ($ MILLION)
TABLE 65.EUROPE PAPER STRAW MARKET, FOR OEM, BY SALES TYPE, 2021–2031 ($ MILLION)
TABLE 66.EUROPE PAPER STRAW MARKET, FOR THIRD PARTY, BY SALES TYPE, 2021–2031 ($ MILLION)
TABLE 67.EUROPE PAPER STRAW MARKET, BY COUNTRY, 2021–2031 ($ MILLION)
TABLE 68.GERMANY PAPER STRAW MARKET, BY MATERIAL, 2021–2031 ($ MILLION)
TABLE 69.GERMANY PAPER STRAW MARKET, BY PRODUCT, 2021–2031 ($ MILLION)
TABLE 70.GERMANY PAPER STRAW MARKET, BY END USER, 2021–2031 ($ MILLION)
TABLE 71.FRANCE PAPER STRAW MARKET, BY MATERIAL, 2021–2031 ($ MILLION)
TABLE 72.FRANCE PAPER STRAW MARKET, BY PRODUCT, 2021–2031 ($ MILLION)
TABLE 73.FRANCE PAPER STRAW MARKET, BY END USER, 2021–2031 ($ MILLION)
TABLE 74.UK PAPER STRAW MARKET, BY MATERIAL, 2021–2031 ($ MILLION)
TABLE 75.UK PAPER STRAW MARKET, BY PRODUCT, 2021–2031 ($ MILLION)
TABLE 76.UK PAPER STRAW MARKET, BY END USER, 2021–2031 ($ MILLION)
TABLE 77.ITALY PAPER STRAW MARKET, BY MATERIAL, 2021–2031 ($ MILLION)
TABLE 78.ITALY PAPER STRAW MARKET, BY PRODUCT, 2021–2031 ($ MILLION)
TABLE 79.ITALY PAPER STRAW MARKET, BY END USER, 2021–2031 ($ MILLION)
TABLE 80.REST OF EUROPE PAPER STRAW MARKET, BY MATERIAL, 2021–2031 ($ MILLION)
TABLE 81.REST OF EUROPE PAPER STRAW MARKET, BY PRODUCT, 2021–2031 ($ MILLION)
TABLE 82.REST OF EUROPE PAPER STRAW MARKET, BY END USER, 2021–2031 ($ MILLION)
TABLE 83.ASIA-PACIFIC PAPER STRAW MARKET, BY MATERIAL, 2021–2031 ($ MILLION)
TABLE 84.ASIA-PACIFIC PAPER STRAW MARKET, BY PRODUCT, 2021–2031 ($ MILLION)
TABLE 85.ASIA-PACIFIC PAPER STRAW MARKET, BY END USER, 2021–2031 ($ MILLION)
TABLE 86.ASIA-PACIFIC PAPER STRAW MARKET, FOR FOODSERVICE, BY SUPPLIER, 2021–2031 ($ MILLION)
TABLE 87.ASIA-PACIFIC PAPER STRAW MARKET, FOR OEM, BY SALES TYPE, 2021–2031 ($ MILLION)
TABLE 88.ASIA-PACIFIC PAPER STRAW MARKET, FOR THIRD PARTY, BY SALES TYPE, 2021–2031 ($ MILLION)
TABLE 89.ASIA-PACIFIC PAPER STRAW MARKET, BY COUNTRY, 2021–2031 ($ MILLION)
TABLE 90.CHINA PAPER STRAW MARKET, BY MATERIAL, 2021–2031 ($ MILLION)
TABLE 91.CHINA PAPER STRAW MARKET, BY PRODUCT, 2021–2031 ($ MILLION)
TABLE 92.CHINA PAPER STRAW MARKET, BY END USER, 2021–2031 ($ MILLION)
TABLE 93.JAPAN PAPER STRAW MARKET, BY MATERIAL, 2021–2031 ($ MILLION)
TABLE 94.JAPAN PAPER STRAW MARKET, BY PRODUCT, 2021–2031 ($ MILLION)
TABLE 95.JAPAN PAPER STRAW MARKET, BY END USER, 2021–2031 ($ MILLION)
TABLE 96.SOUTH KOREA PAPER STRAW MARKET, BY MATERIAL, 2021–2031 ($ MILLION)
TABLE 97.SOUTH KOREA PAPER STRAW MARKET, BY PRODUCT, 2021–2031 ($ MILLION)
TABLE 98.SOUTH KOREA PAPER STRAW MARKET, BY END USER, 2021–2031 ($ MILLION)
TABLE 99.INDIA PAPER STRAW MARKET, BY MATERIAL, 2021–2031 ($ MILLION)
TABLE 100.INDIA PAPER STRAW MARKET, BY PRODUCT, 2021–2031 ($ MILLION)
TABLE 101.INDIA PAPER STRAW MARKET, BY END USER, 2021–2031 ($ MILLION)
TABLE 102.REST OF ASIA-PACIFIC PAPER STRAW MARKET, BY MATERIAL, 2021–2031 ($ MILLION)
TABLE 103.REST OF ASIA-PACIFIC PAPER STRAW MARKET, BY PRODUCT, 2021–2031 ($ MILLION)
TABLE 104.REST OF ASIA-PACIFIC PAPER STRAW MARKET, BY END USER, 2021–2031 ($ MILLION)
TABLE 105.LAMEA PAPER STRAW MARKET, BY MATERIAL, 2021–2031 ($ MILLION)
TABLE 106.LAMEA PAPER STRAW MARKET, BY PRODUCT, 2021–2031 ($ MILLION)
TABLE 107.LAMEA PAPER STRAW MARKET, BY END USER, 2021–2031 ($ MILLION)
TABLE 108.LAMEA PAPER STRAW MARKET, FOR FOODSERVICE, BY SUPPLIER, 2021–2031 ($ MILLION)
TABLE 109.LAMEA PAPER STRAW MARKET, FOR OEM, BY SALES TYPE, 2021–2031 ($ MILLION)
TABLE 110.LAMEA PAPER STRAW MARKET, FOR THIRD PARTY, BY SALES TYPE, 2021–2031 ($ MILLION)
TABLE 111.LAMEA PAPER STRAW MARKET, BY COUNTRY, 2021–2031 ($ MILLION)
TABLE 112.LATIN AMERICA PAPER STRAW MARKET, BY MATERIAL, 2021–2031 ($ MILLION)
TABLE 113.LATIN AMERICA PAPER STRAW MARKET, BY PRODUCT, 2021–2031 ($ MILLION)
TABLE 114.LATIN AMERICA PAPER STRAW MARKET, BY END USER, 2021–2031 ($ MILLION)
TABLE 115.MIDDLE EAST PAPER STRAW MARKET, BY MATERIAL, 2021–2031 ($ MILLION)
TABLE 116.MIDDLE EAST PAPER STRAW MARKET, BY PRODUCT, 2021–2031 ($ MILLION)
TABLE 117.MIDDLE EAST PAPER STRAW MARKET, BY END USER, 2021–2031 ($ MILLION)
TABLE 118.AFRICA PAPER STRAW MARKET, BY MATERIAL, 2021–2031 ($ MILLION)
TABLE 119.AFRICA PAPER STRAW MARKET, BY PRODUCT, 2021–2031 ($ MILLION)
TABLE 120.AFRICA PAPER STRAW MARKET, BY END USER, 2021–2031 ($ MILLION)
TABLE 121.BIOPAK: KEY EXECUTIVE
TABLE 122.BIOPAK: COMPANY SNAPSHOT
TABLE 123.BIOPAK: PRODUCT PORTFOLIO
TABLE 124.BYGREEN: KEY EXECUTIVE
TABLE 125.BYGREEN: COMPANY SNAPSHOT
TABLE 126.BYGREEN: PRODUCT PORTFOLIO
TABLE 127.CANADA BROWN ECO PRODUCTS LTD: KEY EXECUTIVE
TABLE 128.CANADA BROWN ECO PRODUCTS LTD: COMPANY SNAPSHOT
TABLE 129.CANADA BROWN ECO PRODUCTS LTD: PRODUCT PORTFOLIO
TABLE 130.CHARTA GLOBAL: KEY EXECUTIVE
TABLE 131.CHARTA GLOBAL: COMPANY SNAPSHOT
TABLE 132.CHARTA GLOBAL: PRODUCT PORTFOLIO
TABLE 133.FULING GLOBAL INC.: KEY EXECUTIVE
TABLE 134.FULING GLOBAL INC.: COMPANY SNAPSHOT
TABLE 135.FULING GLOBAL INC.: PRODUCT PORTFOLIO
TABLE 136.HOFFMASTER GROUP, INC.: KEY EXECUTIVE
TABLE 137.HOFFMASTER GROUP, INC.: COMPANY SNAPSHOT
TABLE 138.HOFFMASTER GROUP, INC.: PRODUCT PORTFOLIO
TABLE 139.HUHTAMAKI OYJ: KEY EXECUTIVE
TABLE 140.HUHTAMAKI OYJ: COMPANY SNAPSHOT
TABLE 141.HUHTAMAKI OYJ: OPERATING SEGMENTS
TABLE 142.HUHTAMAKI OYJ: PRODUCT PORTFOLIO
TABLE 143.KLEAN KANTEEN: KEY EXECUTIVE
TABLE 144.KLEAN KANTEEN: COMPANY SNAPSHOT
TABLE 145.KLEAN KANTEEN: PRODUCT PORTFOLIO
TABLE 146.KEY EXECUTIVE: LOLLICUP USA, INC.
TABLE 147.LOLLICUP USA, INC.: COMPANY SNAPSHOT
TABLE 148.LOLLICUP USA, INC.: PRODUCT PORTFOLIO
TABLE 149.NINGBO JIANGBEI SHENYU INDUSTRY AND TRADE CO., LTD.:KEY EXECUTIVE
TABLE 150.NINGBO JIANGBEI SHENYU INDUSTRY AND TRADE CO., LTD.: COMPANY SNAPSHOT
TABLE 151.NINGBO JIANGBEI SHENYU INDUSTRY AND TRADE CO., LTD.: PRODUCT PORTFOLIO
TABLE 152.SHENZHEN GRIZZLIES’ INDUSTRIES CO., LTD: KEY EXECUTIVE
TABLE 153.SHENZHEN GRIZZLIES’ INDUSTRIES CO., LTD: COMPANY SNAPSHOT
TABLE 154.SHENZHEN GRIZZLIES’ INDUSTRIES CO., LTD: PRODUCT PORTFOLIO
TABLE 155.SOTON DAILY NECESSITIES CO., LTD.: KEY EXECUTIVE
TABLE 156.SOTON DAILY NECESSITIES CO., LTD.: COMPANY SNAPSHOT
TABLE 157.SOTON DAILY NECESSITIES CO., LTD.: PRODUCT PORTFOLIO
TABLE 158.SOUTHEASTERN LIQUID ANALYZERS: KEY EXECUTIVE
TABLE 159.SOUTHEASTERN LIQUID ANALYZERS: COMPANY SNAPSHOT
TABLE 160.SOUTHEASTERN LIQUID ANALYZERS: PRODUCT PORTFOLIO
TABLE 161.THE PAPER STRAW:KEY EXECUTIVE
TABLE 162.THE PAPER STRAW: COMPANY SNAPSHOT
TABLE 163.THE PAPER STRAW: PRODUCT PORTFOLIO
TABLE 164.YUTONG ECO-TECHNOLOGY (SUQIAN) CO., LTD: KEY EXECUTIVE
TABLE 165.YUTONG ECO-TECHNOLOGY (SUQIAN) CO., LTD: COMPANY SNAPSHOT
TABLE 166.YUTONG ECO-TECHNOLOGY (SUQIAN) CO., LTD: PRODUCT PORTFOLIO
TABLE 167.ALECO INDUSTRIAL CO. LTD.:KEY EXECUTIVE
TABLE 168.ALECO INDUSTRIAL CO. LTD.: COMPANY SNAPSHOT
TABLE 169.ALECO INDUSTRIAL CO. LTD.: PRODUCT PORTFOLIO
TABLE 170.TRANSCEND PACKAGING LTD.: KEY EXECUTIVE
TABLE 171.TRANSCEND PACKAGING LTD.: COMPANY SNAPSHOT
TABLE 172.TRANSCEND PACKAGING LTD.: PRODUCT PORTFOLIO

LIST OF FIGURES

FIGURE 01.KEY MARKET SEGMENTS
FIGURE 02.PAPER STRAW MARKET SNAPSHOT, FOR SEGMENT, 2021–2031
FIGURE 03.PAPER STRAW MARKET SNAPSHOT, BY COUNTRY, 2021–2031
FIGURE 04.PAPER STRAWS: KEY PLAYERS
FIGURE 05.TOP INVESTMENT POCKETS
FIGURE 06.TOP INVESTMENT FACTOR
FIGURE 07.LOW-TO-HIGH BARGAINING POWER OF SUPPLIERS
FIGURE 08.LOW-TO-MODERATE THREAT OF NEW ENTRANTS
FIGURE 09.MODERATE-TO-HIGH THREAT OF SUBSTITUTES
FIGURE 10.LOW-TO-MODERATE BARGAINING POWER OF BUYERS
FIGURE 11.MODERATE-TO-HIGH INTENSITY OF RIVALRY
FIGURE 12.PARENT MARKET ANALYSIS
FIGURE 13.VALUE CHAIN ANALYSIS
FIGURE 14.SMILING CURVE VALUE CHAIN MODEL
FIGURE 15.PRODUCT LIFE-CYCLE ANALYSIS
FIGURE 16.MARKET DYNAMICS
FIGURE 17.PAPER STRAW MARKET, BY MATERIAL, 2021–2031
FIGURE 18.COMPARATIVE SHARE ANALYSIS OF PAPER STRAW MARKET FOR VIRGIN PAPER, BY COUNTRY, 2021 & 2031 (%)
FIGURE 19.COMPARATIVE SHARE ANALYSIS OF PAPER STRAW MARKET FOR RECYCLED PAPER, BY COUNTRY,  2021 & 2031 (%)
FIGURE 20.PAPER STRAW MARKET, BY PRODUCT, 2021–2031
FIGURE 21.COMPARATIVE SHARE ANALYSIS OF PAPER STRAW MARKET FOR PRINTED, BY COUNTRY, 2021 & 2031 (%)
FIGURE 22.COMPARATIVE SHARE ANALYSIS OF PAPER STRAW MARKET FOR NON PRINTED, BY COUNTRY, 2021 & 2031 (%)
FIGURE 23.PAPER STRAW MARKET, BY END USER, 2021–2031
FIGURE 24.COMPARATIVE SHARE ANALYSIS OF PAPER STRAW MARKET FOR FOODSERVICE, BY COUNTRY, 2021 & 2031 (%)
FIGURE 25.COMPARATIVE SHARE ANALYSIS OF PAPER STRAW MARKET FOR HOUSEHOLD, BY COUNTRY, 2021 & 2031 (%)
FIGURE 26.PAPER STRAW MARKET, BY REGION, 2021–2031
FIGURE 27.U.S. PAPER STRAW MARKET REVENUE, 2021–2031 ($ MILLION)
FIGURE 28.CANADA PAPER STRAW MARKET REVENUE, 2021–2031 ($ MILLION)
FIGURE 29.MEXICO PAPER STRAW MARKET REVENUE, 2021–2031 ($ MILLION)
FIGURE 30.GERMANY PAPER STRAW MARKET REVENUE, 2021–2031 ($ MILLION)
FIGURE 31.FRANCE PAPER STRAW MARKET REVENUE, 2021–2031 ($ MILLION)
FIGURE 32.UK PAPER STRAW MARKET REVENUE, 2021–2031 ($ MILLION)
FIGURE 33.ITALY PAPER STRAW MARKET REVENUE, 2021–2031 ($ MILLION)
FIGURE 34.REST OF EUROPE PAPER STRAW MARKET REVENUE, 2021–2031 ($ MILLION)
FIGURE 35.CHINA PAPER STRAW MARKET REVENUE, 2021–2031 ($ MILLION)
FIGURE 36.JAPAN PAPER STRAW MARKET REVENUE, 2021–2031 ($ MILLION)
FIGURE 37.SOUTH KOREA PAPER STRAW MARKET REVENUE, 2021–2031 ($ MILLION)
FIGURE 38.INDIA PAPER STRAW MARKET REVENUE, 2021–2031 ($ MILLION)
FIGURE 39.REST OF ASIA-PACIFIC PAPER STRAW MARKET REVENUE, 2021–2031 ($ MILLION)
FIGURE 40.LATIN AMERICA PAPER STRAW MARKET REVENUE, 2021–2031 ($ MILLION)
FIGURE 41.MIDDLE EAST PAPER STRAW MARKET REVENUE, 2021–2031 ($ MILLION)
FIGURE 42.AFRICA PAPER STRAW MARKET REVENUE, 2021–2031 ($ MILLION)
FIGURE 43.TOP PLAYER POSITIONING, 2021
FIGURE 44.TOP WINNING STRATEGIES, BY YEAR, 2020–2022
FIGURE 45.TOP WINNING STRATEGIES, BY DEVELOPMENT, 2020–2022 (%)
FIGURE 46.TOP WINNING STRATEGIES, BY COMPANY, 2020–2022
FIGURE 47.PRODUCT MAPPING-1
FIGURE 48.PRODUCT MAPPING-2
FIGURE 49.COMPANY SNAPSHOT-1
FIGURE 50.COMPANY SNAPSHOT-2
FIGURE 51.COMPANY SNAPSHOT-3
FIGURE 52.COMPANY SNAPSHOT-4
FIGURE 53.COMPETITIVE HEAT MAP
FIGURE 54.HUHTAMAKI OYJ: REVENUE, 2019–2021 ($MILLION)
FIGURE 55.HUHTAMAKI OYJ: REVENUE SHARE BY SEGMENT, 2021 (%)
FIGURE 56.HUHTAMAKI OYJ: REVENUE SHARE BY REGION, 2021 (%)


Paper straws are considered as the major innovation from renewable material as the world is discovering alternatives to single use plastic products. It is being adopted as a perfect substitute to single use plastic as the paper products decompose easily as compared to plastic after a definite period of time by causing no harm to the environment.

Increase in number of manufacturers, favorable government policies for the adoption of sustainable and biodegradable products, and rise in availability of renewable feedstock boost the growth of the paper straw market. Rise in consumer acceptance due to various awareness and education programs regarding bio-based products is providing a new perspective to eliminate usage of conventional plastic. However, higher price of bio-based plastic as compared to traditional plastic coupled with low performance standards hamper the market growth.

At present, there is an increase in the number of restaurants and cafes around the world. This propels the growth of the paper straw market. Furthermore, rapid expansion of the food & beverage industry, along with surge in demand for the straws made from chlorine free paper that is more environment–friendly option for on-the-go food and drinks, increase the adoption of paper straws.

PURCHASE OPTIONS

Call or Email us

U.S.-Canada Toll-free: +1-800-792-5285
Int'l : +1-503-894-6022
Europe : +44-845-528-1300
Email : help@alliedmarketresearch.com
 
FREQUENTLY ASKED QUESTIONS?

A. The global paper straw market was valued at $865.3 million in 2021, and is projected to reach $3,042.8 million by 2031, registering a CAGR of 13.3% from 2022 to 2031.

A. The forecast period considered for the global paper straw market is 2022 to 2031, wherein, 2021 is the base year, 2022 is the estimated year, and 2031 is the forecast year.

A. To get latest version of global paper straw market report can be obtained on demand from the website.

A. The base year considered in the global paper straw market report is 2021.

A. The top companies holding the market share in the global paper straw market report include Aleco Industrial Co. Ltd., Biopak , Bygreen, Canada Brown Eco Products Ltd , Charta Global , Focus Technology Co., Ltd. , Footprint , Fuling Global Inc. , Hoffmaster Group, Inc. , Huhtamaki Oyj , Lollicup USA, Inc. , Ningbo Jiangbei Shenyu Industry and Trade Co., Ltd. , Shenzhen Grizzlies Industries Co., LTD , Soton Daily Necessities Co., Ltd. , Tipi Straws, Transcend Packaging Ltd., and YuTong Eco-Technology (SuQian) Co., Ltd.

A. The top seventeen market players are selected based on two key attributes - competitive strength and market positioning.

A. The report contains an exclusive company profile section, where leading companies in the market are profiled. These profiles typically cover company overview, geographical presence, market dominance (in terms of revenue and volume sales), various strategies and recent developments.

A. By product, the printed segment is the highest share holder of paper straw market.

Looking for Customization?

 Customization Request

Have a Question?

 Speak with Analyst

Any Confusion?

 Inquire Before Buying

Have a glance of the Report

  Request Sample
RELATED TAGS

Purchase Full Report of
Paper Straw Market

Start reading instantly.
This Report and over 67,068+ more Reports, Available with Avenue Library. T&C*.

  • Online Only
  • $3,570
  • Online cloud access only
  • Restricted print, copy, paste & download
  • Read only
  • Free industry update
    (Within 180 days)
  • Free report update in next update cycle
    (Sep 2023 - Sep 2024)
  • Data Pack
  • $3,840
  • Restricted to one authorized user
  • One print only
  • Available in
    Excel
  • Free industry update
    (Within 180 days)
  •   Free report update in next update cycle
    (Sep 2023 - Sep 2024)
  • Single User
  • $5,730
  • Restricted to one authorized user
  • One print only
  • Available in
    PDF
  • Free industry update
    (Within 180 days)
  •   Free report update in next update cycle
    (Sep 2023 - Sep 2024)
  • Five Users
  • $6,450
  • Limited to five authorized users
  • Print upto five copies
  • Available in
    PDF
  • Free industry update
    (Within 180 days)
  •   Free report update in next update cycle
    (Sep 2023 - Sep 2024)
  • Enterprise
    License/PDF

  • $9,600
  • Unlimited
    within
    company/enterprise
  • Available in Excel & PDF
  • Free industry update
    (Within 180 days)
  •   Free report update in next update cycle
    (Sep 2023 - Sep 2024)
  • Library
    Membership

  • $999 $ 1,175
    Per User/ Per month/ Billed annually
  • Published Content
    E-access
  • Company Profiles
    E-access
  • Newly Added Content Access
  • 10 PDF
    Downloads
  • 5 Excel Data
    Pack Downloads
  • 250 Company Profiles PDF Downloads
  • Buy Now

*Taxes/Fees, if applicable will be added during checkout. All prices in USD

RELATED REPORTS
 

Why Allied Market Research?


Infallible Methodology

To ensure high-level data integrity, accurate analysis, and impeccable forecasts

Analyst Support

For complete satisfaction

Customization

On-demand customization of scope of the report to exactly meet your needs

TARGETED MARKET VIEW

Targeted market view to provide pertinent information and save time of readers

Get fresh content delivered

Get insights on topics that are crucial for your business. Stay abreast of your interest areas.

Get Industry Data Alerts

Why Allied Market Research?

Infallible Methodology

To ensure high-level data integrity, accurate analysis, and impeccable forecasts

Analyst Support

For complete satisfaction

Customization

On-demand customization of scope of the report to exactly meet your needs

TARGETED MARKET VIEW

Targeted market view to provide pertinent information and save time of readers