0
2023
Pediatric Neurology Device Market

Pediatric Neurology Device Market

by Product Type (Neurostimulation Devices, Neurosurgery Devices, Interventional Neurology Devices, Cerebrospinal Fluid Management Devices, Others), by Condition (Stroke, Seizures, Hydrocephalus, Oncology, Others), by Age group (0-5 Years, 5-10 Years, 10-15 Years), by End User (Hospitals, Ambulatory surgery centers, Others): Global Opportunity Analysis and Industry Forecast, 2021-2031

Report Code: A11670
Jan 2023 | Pages: 220
Tables: 163
Charts: 84
  • Formats*:

  • pdf

    Single User License, Five User
    License & Enterprise User License

  • xls

    Data Pack Excel License

  • ppt

    It comes with the additional cost
    of $2500.00 contact sales.


Pediatric Neurology Device Market Research, 2031

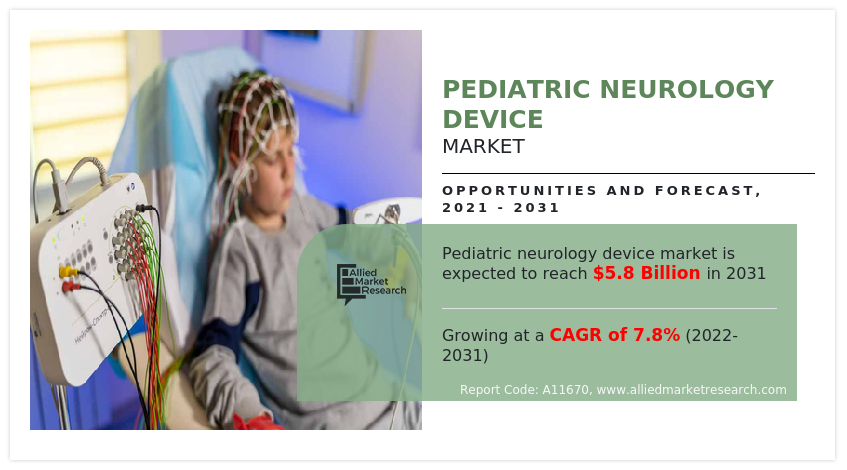
The global pediatric neurology device market was valued at $2.8 billion in 2021, and is projected to reach $5.8 billion by 2031, growing at a CAGR of 7.8% from 2022 to 2031. Pediatric neurology is a specialized branch of medicine that deals with the diagnosis and management of neurological conditions in neonates (newborns), infants, children, and adolescents. Neurological disorders have a wide spectrum and can have various causes, complications, symptoms, and results. 

The COVID-19 pandemic witnessed a negative impact on the pediatric neurology devices industry, owing to the situation of COVID-19 that did not allow the pediatric patients to travel to a hospital for any kind of invasive procedure to evaluate the neurological harm of the patient. Hence, the parents of the neurological pediatric patients were made to postpone the treatment procedures for the patients

Pediatric Neurology Device Market

The child neurology includes diseases and disorders of the spinal cord, brain, peripheral nervous system (PNS), autonomic nervous system (ANS), muscles, and blood vessels that affect individuals in these age groups. The disease conditions require various devices for the purpose of diagnosis and treatment procedures. Some of the devices used in pediatric patients include the neurosurgical devices used in surgical treatment procedures or implant devices for regular management of the brain CSF.

Market Dynamics

The growth in the diagnostic and biotechnology industry for the adoption of pediatric neurological devices is expected to increase at a faster rate owing to the massive pool of neurological diseases among the target population, which creates an opportunity for the Pediatric Neurology Device Industry. Rise in launch of new tests due to advanced technology by various key players across the globe is set to affect the market growth positively. For instance, in February 2019, Medtronic plc announced both the U.S. launch of Deep Brain Stimulation (DBS) for medically refractory epilepsy and the first commercially implanted patient at Emory University in Atlanta, Ga.  DBS therapy for epilepsy delivers controlled electrical pulses to a target in the brain called the anterior nucleus of the thalamus (ANT), which is part of a network involved in seizures. The growth of the pediatric neurology devices market is also expected to be driven by high potential in adoption of the devices in developing countries due to increase in the prevalence of neurological disorders, increase in practice to diagnose the children for neurological diseases, and surge in demand for pediatric neurological devices.

Furthermore, the healthcare industry in emerging economies is developing at a significant rate, owing to significant investments by government to improve pediatric healthcare, and strong foothold of medical technology industries in emerging countries. In addition, the launch of cost-effective devices may also decide the adoption of the device. For instance, Medtronic plc announced the launch of the Solitaire (TM) X Revascularization Device in the U.S. and its first use in patients for the treatment of acute ischemic stroke. In addition, Medtronic introduced Phenom (TM) 21 Catheter, a 160cm length microcatheter for the delivery of all sizes of Solitaire X. The Solitaire X device mechanically removes blood clots from blocked vessels in the brain to restore blood flow in patients suffering an acute ischemic stroke with large vessel occlusion. Solitaire X provides a low clot crossing profile, with smooth delivery to occlusions in distal vessels as small as 2.0mm with the combination of device with Phenom 21. Hence, the product launch factor for pediatric neurology devices is attributed to further support the Pediatric Neurology Device Market Growth. The demand for pediatric neurology devices is not only limited to developed countries, but is also being witnessed in the developing countries, such as China, Brazil, and India, which fuel the growth of the market. Factors such as rise in adoption of neurological devices among the pediatric patients and increase in awareness toward chronic neurological diseases risks further drive the growth of the market. Furthermore, rise in consumer awareness related to preventive healthcare of newborns boosts the adoption of pediatric neurology devices. Moreover, an increase in research activities by manufacturers for developing innovative solutions in pediatric neurology devices technology is expected to fuel their adoption in the near future.

However, the cost of neurological disease treatment is hampering the market growth. Moreover, stringency in product approval is anticipated to hamper the growth of the market. Increasing R&D activities in the field of medical devices along with significant improvement in medical infrastructure are anticipated to provide new opportunities for the expansion of the market.

The pediatric neurology device market is segmented into Product Type, Condition, Age group and End User.

The pediatric neurology devices market is segmented on the basis of product type, condition, age group, end user, and region. On the basis of product, the market is categorized into neurostimulator devices, neurosurgery devices, interventional neurology devices, cerebrospinal fluid (CSF) management devices and others. On the basis of condition, the market is classified into stroke, seizures, hydrocephalus, oncology and others. Based on age group, the market is classified into 0-5 years, 5-10 years and 10-15 years. On the basis of end user, the market is classified into hospitals, ambulatory surgery centers and others. Region wise, the market is studied across North America (the U.S., Canada, and Mexico), Europe (Germany, France, UK, Italy, Spain, and Rest of Europe), Asia-Pacific (Japan, China, Australia, India, South Korea and rest of Asia-Pacific), and LAMEA (Brazil, South Africa, Saudi Arabia, and rest of LAMEA).

Pediatric Neurology Device Market

By Product Type

The cerebrospinal fluid management devices segment dominated the global Pediatric Neurology Device Market Share in 2021 and is expected to remain dominant throughout the forecast period, owing to the increase in the adoption of cerebrospinal fluid management devices for surgical procedures of the patients and availability of several types of devices developed by various key players in the market.

Pediatric Neurology Device Market

By Condition

The seizures segment dominated the global Pediatric Neurology Device Market Size in 2021 and is anticipated to continue this trend during the forecast period. This is attributed to the increase in the prevalence of stroke among the pediatric population. In addition, the launch of new devices and an increase in the support from the government authorities for the cost-effective treatment of pediatric patients are contributes to the growth of the market.

Pediatric Neurology Device Market

By Age Group

The 5-10 years segment dominated the global Pediatric Neurology Device Market Size in 2021 and is anticipated to continue this trend during the forecast period. This is attributed to the increase in the prevalence of neurological diseases among the target population. In addition, growth in awareness regarding neurological conditions drives the growth of the market.

Pediatric Neurology Device Market

By End User

The hospitals segment held the largest market share in 2021 and is expected to remain dominant throughout the Pediatric Neurology Device Market Forecast period, owing to the preference of the population for the treatment of diseases among the hospitals and ease of the accessibility of the hospital's admissions post-COVID-19 pandemic situation.

Pediatric Neurology Device Market

By Region

In 2021, North America was the dominant region and is expected to remain dominant throughout the forecast period, owing to high prevalence rate of neurological disease such as seizures and hydrocephalus among pediatric population and increase in the number of market players available in the region. However, Asia-Pacific is expected to witness the highest CAGR during the analysis period, owing to the presence of high populace countries such as India and China, which in turn increases the number of chances of suffering from genetic conditions, and the increasing number of strategies and trends adopted by the market players.

COMPETITION ANALYSIS

Competitive analysis and profiles of the major players in the pediatric neurology devices, such as Abbott Laboratories, B. Braun Melsungen AG, Boston Scientific Corporation, Integra LifeSciences Holdings KARL STORZ SE & Co. KG., LivaNova PLC, Medtronic plc, Natus Medical Incorporated (ArchiMed), Stryker Corporation, Zimmer Biomet are provided in this report. There are some important players in the market such as Abbott Laboratories, Boston Scientific Corporation, LivaNova PLC and Medtronic plc. Various players have adopted strategies such as product launch and product approval as key developmental strategies to improve the product portfolio of the pediatric neurology devices market.  

Product launch in the market

In January 2021, Medtronic plc announced the launch of ADAPT-PD (Adaptive DBS Algorithm for Personalized Therapy in Parkinson's Disease). Adaptive deep brain stimulation is an investigational feature of the Percept PC device that could be enabled if approved.

In October 2019, Medtronic plc announced the U.S. launch of its advanced Patient Programmer technology for Deep Brain Stimulation (DBS) therapy at the Samsung Developers Conference in San Jose, Calif. The new programmer which received U.S. Food and Drug Administration (FDA) approval on July 3, 2019, leveraged a user-friendly, custom-configured Samsung mobile device, which allows patients to manage their therapy more simply and discreetly. 

Product approval in the market

In July 2021, Medtronic plc announced the U.S. Food and Drug Administration (FDA) approval and first U.S. implants of the SenSight Directional Lead System used for Deep Brain Stimulation (DBS) therapy. SenSight was the first-of-its-kind DBS directional lead that combines the benefits of directionality with the power of sensing, allowing physicians to deliver precise, patient-specific DBS therapy for the treatment of some symptoms associated with movement disorders such as Parkinson's disease, dystonia and essential tremor, and medically refractory epilepsy.

Key Benefits For Stakeholders

  • This report provides a quantitative analysis of the market segments, current trends, estimations, and dynamics of the pediatric neurology device market analysis from 2021 to 2031 to identify the prevailing Pediatric Neurology Device Market Opportunity.
  • The market research is offered along with information related to key drivers, restraints, and opportunities.
  • Porter's five forces analysis highlights the potency of buyers and suppliers to enable stakeholders make profit-oriented business decisions and strengthen their supplier-buyer network.
  • In-depth analysis of the pediatric neurology device market segmentation assists to determine the prevailing market opportunities.
  • Major countries in each region are mapped according to their revenue contribution to the global market.
  • Market player positioning facilitates benchmarking and provides a clear understanding of the present position of the market players.
  • The report includes the analysis of the regional as well as global pediatric neurology device market trends, key players, market segments, application areas, and market growth strategies.

Pediatric Neurology Device Market Report Highlights

Aspects Details
Market Size By 2031 USD 5.8 billion
Growth Rate CAGR of 7.8%
Forecast period 2021 - 2031
Report Pages 220
By Product Type
  • Neurostimulation Devices
  • Neurosurgery Devices
  • Interventional Neurology Devices
  • Cerebrospinal Fluid Management Devices
  • Others
By Condition
  • Stroke
  • Seizures
  • Hydrocephalus
  • Oncology
  • Others
By Age group
  • 0-5 Years
  • 5-10 Years
  • 10-15 Years
By End User
  • Hospitals
  • Ambulatory surgery centers
  • Others
By Region
  • North America  (U.S., Canada, Mexico)
  • Europe  (Germany, France, UK, Italy, Spain, Rest of Europe)
  • Asia-Pacific  (China, Japan, India, Australia, South Korea, Rest of Asia-Pacific)
  • LAMEA  (Brazil, Saudi Arabia, South Africa, Rest of LAMEA)
Key Market Players Integra LifeSciences Holdings, KARL STORZ SE & Co. KG, Zimmer Biomet Holding Inc., Abbott Laboratories, Natus Medical Incorporated, LivaNova PLC, Stryker Corporation, Boston Scientific Corporation, Medtronic plc, B.Braun SE
 
  • CHAPTER 1: INTRODUCTION

    • 1.1. Report description

    • 1.2. Key market segments

    • 1.3. Key benefits to the stakeholders

    • 1.4. Research Methodology

      • 1.4.1. Primary research

      • 1.4.2. Secondary research

      • 1.4.3. Analyst tools and models

  • CHAPTER 2: EXECUTIVE SUMMARY

    • 2.1. CXO Perspective

  • CHAPTER 3: MARKET OVERVIEW

    • 3.1. Market definition and scope

    • 3.2. Key findings

      • 3.2.1. Top impacting factors

      • 3.2.2. Top investment pockets

    • 3.3. Porter’s five forces analysis

      • 3.3.1. Moderate bargaining power of suppliers

      • 3.3.2. Moderate bargaining power of buyers

      • 3.3.3. Moderate threat of substitutes

      • 3.3.4. Moderate threat of new entrants

      • 3.3.5. Moderate intensity of rivalry

    • 3.4. Market dynamics

      • 3.4.1. Drivers

        • 3.4.1.1. Increase in the prevalence of neurological disorders in children
        • 3.4.1.2. Increase in government funding to support development activities for invention of new medical devices
        • 3.4.1.3. Changing lifestyles led by growing industrialization and urbanization

      • 3.4.2. Restraints

        • 3.4.2.1. High cost associated with diagnosis and treatment monitoring of neurological disorders

      • 3.4.3. Opportunities

        • 3.4.3.1. Rise in awareness regarding the benefits of pediatric neurology devices

    • 3.5. COVID-19 Impact Analysis on the market

  • CHAPTER 4: PEDIATRIC NEUROLOGY DEVICE MARKET, BY PRODUCT TYPE

    • 4.1. Overview

      • 4.1.1. Market size and forecast

    • 4.2. Neurostimulation Devices

      • 4.2.1. Key market trends, growth factors and opportunities

      • 4.2.2. Market size and forecast, by region

      • 4.2.3. Market share analysis by country

    • 4.3. Neurosurgery Devices

      • 4.3.1. Key market trends, growth factors and opportunities

      • 4.3.2. Market size and forecast, by region

      • 4.3.3. Market share analysis by country

    • 4.4. Interventional Neurology Devices

      • 4.4.1. Key market trends, growth factors and opportunities

      • 4.4.2. Market size and forecast, by region

      • 4.4.3. Market share analysis by country

    • 4.5. Cerebrospinal Fluid Management Devices

      • 4.5.1. Key market trends, growth factors and opportunities

      • 4.5.2. Market size and forecast, by region

      • 4.5.3. Market share analysis by country

    • 4.6. Others

      • 4.6.1. Key market trends, growth factors and opportunities

      • 4.6.2. Market size and forecast, by region

      • 4.6.3. Market share analysis by country

  • CHAPTER 5: PEDIATRIC NEUROLOGY DEVICE MARKET, BY CONDITION

    • 5.1. Overview

      • 5.1.1. Market size and forecast

    • 5.2. Stroke

      • 5.2.1. Key market trends, growth factors and opportunities

      • 5.2.2. Market size and forecast, by region

      • 5.2.3. Market share analysis by country

    • 5.3. Seizures

      • 5.3.1. Key market trends, growth factors and opportunities

      • 5.3.2. Market size and forecast, by region

      • 5.3.3. Market share analysis by country

    • 5.4. Hydrocephalus

      • 5.4.1. Key market trends, growth factors and opportunities

      • 5.4.2. Market size and forecast, by region

      • 5.4.3. Market share analysis by country

    • 5.5. Oncology

      • 5.5.1. Key market trends, growth factors and opportunities

      • 5.5.2. Market size and forecast, by region

      • 5.5.3. Market share analysis by country

    • 5.6. Others

      • 5.6.1. Key market trends, growth factors and opportunities

      • 5.6.2. Market size and forecast, by region

      • 5.6.3. Market share analysis by country

  • CHAPTER 6: PEDIATRIC NEUROLOGY DEVICE MARKET, BY AGE GROUP

    • 6.1. Overview

      • 6.1.1. Market size and forecast

    • 6.2. 0-5 Years

      • 6.2.1. Key market trends, growth factors and opportunities

      • 6.2.2. Market size and forecast, by region

      • 6.2.3. Market share analysis by country

    • 6.3. 5-10 Years

      • 6.3.1. Key market trends, growth factors and opportunities

      • 6.3.2. Market size and forecast, by region

      • 6.3.3. Market share analysis by country

    • 6.4. 10-15 Years

      • 6.4.1. Key market trends, growth factors and opportunities

      • 6.4.2. Market size and forecast, by region

      • 6.4.3. Market share analysis by country

  • CHAPTER 7: PEDIATRIC NEUROLOGY DEVICE MARKET, BY END USER

    • 7.1. Overview

      • 7.1.1. Market size and forecast

    • 7.2. Hospitals

      • 7.2.1. Key market trends, growth factors and opportunities

      • 7.2.2. Market size and forecast, by region

      • 7.2.3. Market share analysis by country

    • 7.3. Ambulatory surgery centers

      • 7.3.1. Key market trends, growth factors and opportunities

      • 7.3.2. Market size and forecast, by region

      • 7.3.3. Market share analysis by country

    • 7.4. Others

      • 7.4.1. Key market trends, growth factors and opportunities

      • 7.4.2. Market size and forecast, by region

      • 7.4.3. Market share analysis by country

  • CHAPTER 8: PEDIATRIC NEUROLOGY DEVICE MARKET, BY REGION

    • 8.1. Overview

      • 8.1.1. Market size and forecast By Region

    • 8.2. North America

      • 8.2.1. Key trends and opportunities

      • 8.2.2. Market size and forecast, by Product Type

      • 8.2.3. Market size and forecast, by Condition

      • 8.2.4. Market size and forecast, by Age group

      • 8.2.5. Market size and forecast, by End User

      • 8.2.6. Market size and forecast, by country

        • 8.2.6.1. U.S.
          • 8.2.6.1.1. Key market trends, growth factors and opportunities
          • 8.2.6.1.2. Market size and forecast, by Product Type
          • 8.2.6.1.3. Market size and forecast, by Condition
          • 8.2.6.1.4. Market size and forecast, by Age group
          • 8.2.6.1.5. Market size and forecast, by End User
        • 8.2.6.2. Canada
          • 8.2.6.2.1. Key market trends, growth factors and opportunities
          • 8.2.6.2.2. Market size and forecast, by Product Type
          • 8.2.6.2.3. Market size and forecast, by Condition
          • 8.2.6.2.4. Market size and forecast, by Age group
          • 8.2.6.2.5. Market size and forecast, by End User
        • 8.2.6.3. Mexico
          • 8.2.6.3.1. Key market trends, growth factors and opportunities
          • 8.2.6.3.2. Market size and forecast, by Product Type
          • 8.2.6.3.3. Market size and forecast, by Condition
          • 8.2.6.3.4. Market size and forecast, by Age group
          • 8.2.6.3.5. Market size and forecast, by End User
    • 8.3. Europe

      • 8.3.1. Key trends and opportunities

      • 8.3.2. Market size and forecast, by Product Type

      • 8.3.3. Market size and forecast, by Condition

      • 8.3.4. Market size and forecast, by Age group

      • 8.3.5. Market size and forecast, by End User

      • 8.3.6. Market size and forecast, by country

        • 8.3.6.1. Germany
          • 8.3.6.1.1. Key market trends, growth factors and opportunities
          • 8.3.6.1.2. Market size and forecast, by Product Type
          • 8.3.6.1.3. Market size and forecast, by Condition
          • 8.3.6.1.4. Market size and forecast, by Age group
          • 8.3.6.1.5. Market size and forecast, by End User
        • 8.3.6.2. France
          • 8.3.6.2.1. Key market trends, growth factors and opportunities
          • 8.3.6.2.2. Market size and forecast, by Product Type
          • 8.3.6.2.3. Market size and forecast, by Condition
          • 8.3.6.2.4. Market size and forecast, by Age group
          • 8.3.6.2.5. Market size and forecast, by End User
        • 8.3.6.3. UK
          • 8.3.6.3.1. Key market trends, growth factors and opportunities
          • 8.3.6.3.2. Market size and forecast, by Product Type
          • 8.3.6.3.3. Market size and forecast, by Condition
          • 8.3.6.3.4. Market size and forecast, by Age group
          • 8.3.6.3.5. Market size and forecast, by End User
        • 8.3.6.4. Italy
          • 8.3.6.4.1. Key market trends, growth factors and opportunities
          • 8.3.6.4.2. Market size and forecast, by Product Type
          • 8.3.6.4.3. Market size and forecast, by Condition
          • 8.3.6.4.4. Market size and forecast, by Age group
          • 8.3.6.4.5. Market size and forecast, by End User
        • 8.3.6.5. Spain
          • 8.3.6.5.1. Key market trends, growth factors and opportunities
          • 8.3.6.5.2. Market size and forecast, by Product Type
          • 8.3.6.5.3. Market size and forecast, by Condition
          • 8.3.6.5.4. Market size and forecast, by Age group
          • 8.3.6.5.5. Market size and forecast, by End User
        • 8.3.6.6. Rest of Europe
          • 8.3.6.6.1. Key market trends, growth factors and opportunities
          • 8.3.6.6.2. Market size and forecast, by Product Type
          • 8.3.6.6.3. Market size and forecast, by Condition
          • 8.3.6.6.4. Market size and forecast, by Age group
          • 8.3.6.6.5. Market size and forecast, by End User
    • 8.4. Asia-Pacific

      • 8.4.1. Key trends and opportunities

      • 8.4.2. Market size and forecast, by Product Type

      • 8.4.3. Market size and forecast, by Condition

      • 8.4.4. Market size and forecast, by Age group

      • 8.4.5. Market size and forecast, by End User

      • 8.4.6. Market size and forecast, by country

        • 8.4.6.1. China
          • 8.4.6.1.1. Key market trends, growth factors and opportunities
          • 8.4.6.1.2. Market size and forecast, by Product Type
          • 8.4.6.1.3. Market size and forecast, by Condition
          • 8.4.6.1.4. Market size and forecast, by Age group
          • 8.4.6.1.5. Market size and forecast, by End User
        • 8.4.6.2. Japan
          • 8.4.6.2.1. Key market trends, growth factors and opportunities
          • 8.4.6.2.2. Market size and forecast, by Product Type
          • 8.4.6.2.3. Market size and forecast, by Condition
          • 8.4.6.2.4. Market size and forecast, by Age group
          • 8.4.6.2.5. Market size and forecast, by End User
        • 8.4.6.3. India
          • 8.4.6.3.1. Key market trends, growth factors and opportunities
          • 8.4.6.3.2. Market size and forecast, by Product Type
          • 8.4.6.3.3. Market size and forecast, by Condition
          • 8.4.6.3.4. Market size and forecast, by Age group
          • 8.4.6.3.5. Market size and forecast, by End User
        • 8.4.6.4. Australia
          • 8.4.6.4.1. Key market trends, growth factors and opportunities
          • 8.4.6.4.2. Market size and forecast, by Product Type
          • 8.4.6.4.3. Market size and forecast, by Condition
          • 8.4.6.4.4. Market size and forecast, by Age group
          • 8.4.6.4.5. Market size and forecast, by End User
        • 8.4.6.5. South Korea
          • 8.4.6.5.1. Key market trends, growth factors and opportunities
          • 8.4.6.5.2. Market size and forecast, by Product Type
          • 8.4.6.5.3. Market size and forecast, by Condition
          • 8.4.6.5.4. Market size and forecast, by Age group
          • 8.4.6.5.5. Market size and forecast, by End User
        • 8.4.6.6. Rest of Asia-Pacific
          • 8.4.6.6.1. Key market trends, growth factors and opportunities
          • 8.4.6.6.2. Market size and forecast, by Product Type
          • 8.4.6.6.3. Market size and forecast, by Condition
          • 8.4.6.6.4. Market size and forecast, by Age group
          • 8.4.6.6.5. Market size and forecast, by End User
    • 8.5. LAMEA

      • 8.5.1. Key trends and opportunities

      • 8.5.2. Market size and forecast, by Product Type

      • 8.5.3. Market size and forecast, by Condition

      • 8.5.4. Market size and forecast, by Age group

      • 8.5.5. Market size and forecast, by End User

      • 8.5.6. Market size and forecast, by country

        • 8.5.6.1. Brazil
          • 8.5.6.1.1. Key market trends, growth factors and opportunities
          • 8.5.6.1.2. Market size and forecast, by Product Type
          • 8.5.6.1.3. Market size and forecast, by Condition
          • 8.5.6.1.4. Market size and forecast, by Age group
          • 8.5.6.1.5. Market size and forecast, by End User
        • 8.5.6.2. Saudi Arabia
          • 8.5.6.2.1. Key market trends, growth factors and opportunities
          • 8.5.6.2.2. Market size and forecast, by Product Type
          • 8.5.6.2.3. Market size and forecast, by Condition
          • 8.5.6.2.4. Market size and forecast, by Age group
          • 8.5.6.2.5. Market size and forecast, by End User
        • 8.5.6.3. South Africa
          • 8.5.6.3.1. Key market trends, growth factors and opportunities
          • 8.5.6.3.2. Market size and forecast, by Product Type
          • 8.5.6.3.3. Market size and forecast, by Condition
          • 8.5.6.3.4. Market size and forecast, by Age group
          • 8.5.6.3.5. Market size and forecast, by End User
        • 8.5.6.4. Rest of LAMEA
          • 8.5.6.4.1. Key market trends, growth factors and opportunities
          • 8.5.6.4.2. Market size and forecast, by Product Type
          • 8.5.6.4.3. Market size and forecast, by Condition
          • 8.5.6.4.4. Market size and forecast, by Age group
          • 8.5.6.4.5. Market size and forecast, by End User
  • CHAPTER 9: COMPETITIVE LANDSCAPE

    • 9.1. Introduction

    • 9.2. Top winning strategies

    • 9.3. Product Mapping of Top 10 Player

    • 9.4. Competitive Dashboard

    • 9.5. Competitive Heatmap

    • 9.6. Top player positioning, 2021

  • CHAPTER 10: COMPANY PROFILES

    • 10.1. Integra LifeSciences Holdings

      • 10.1.1. Company overview

      • 10.1.2. Key Executives

      • 10.1.3. Company snapshot

      • 10.1.4. Operating business segments

      • 10.1.5. Product portfolio

      • 10.1.6. Business performance

      • 10.1.7. Key strategic moves and developments

    • 10.2. B.Braun SE

      • 10.2.1. Company overview

      • 10.2.2. Key Executives

      • 10.2.3. Company snapshot

      • 10.2.4. Operating business segments

      • 10.2.5. Product portfolio

      • 10.2.6. Business performance

    • 10.3. Medtronic plc

      • 10.3.1. Company overview

      • 10.3.2. Key Executives

      • 10.3.3. Company snapshot

      • 10.3.4. Operating business segments

      • 10.3.5. Product portfolio

      • 10.3.6. Business performance

      • 10.3.7. Key strategic moves and developments

    • 10.4. Natus Medical Incorporated

      • 10.4.1. Company overview

      • 10.4.2. Key Executives

      • 10.4.3. Company snapshot

      • 10.4.4. Operating business segments

      • 10.4.5. Product portfolio

      • 10.4.6. Business performance

      • 10.4.7. Key strategic moves and developments

    • 10.5. Stryker Corporation

      • 10.5.1. Company overview

      • 10.5.2. Key Executives

      • 10.5.3. Company snapshot

      • 10.5.4. Operating business segments

      • 10.5.5. Product portfolio

      • 10.5.6. Business performance

    • 10.6. Boston Scientific Corporation

      • 10.6.1. Company overview

      • 10.6.2. Key Executives

      • 10.6.3. Company snapshot

      • 10.6.4. Operating business segments

      • 10.6.5. Product portfolio

      • 10.6.6. Business performance

    • 10.7. Abbott Laboratories

      • 10.7.1. Company overview

      • 10.7.2. Key Executives

      • 10.7.3. Company snapshot

      • 10.7.4. Operating business segments

      • 10.7.5. Product portfolio

      • 10.7.6. Business performance

      • 10.7.7. Key strategic moves and developments

    • 10.8. LivaNova PLC

      • 10.8.1. Company overview

      • 10.8.2. Key Executives

      • 10.8.3. Company snapshot

      • 10.8.4. Operating business segments

      • 10.8.5. Product portfolio

      • 10.8.6. Business performance

      • 10.8.7. Key strategic moves and developments

    • 10.9. Zimmer Biomet Holding Inc.

      • 10.9.1. Company overview

      • 10.9.2. Key Executives

      • 10.9.3. Company snapshot

      • 10.9.4. Operating business segments

      • 10.9.5. Product portfolio

      • 10.9.6. Business performance

      • 10.9.7. Key strategic moves and developments

    • 10.10. KARL STORZ SE & Co. KG

      • 10.10.1. Company overview

      • 10.10.2. Key Executives

      • 10.10.3. Company snapshot

      • 10.10.4. Operating business segments

      • 10.10.5. Product portfolio

  • LIST OF TABLES

  • TABLE 01. GLOBAL PEDIATRIC NEUROLOGY DEVICE MARKET, BY PRODUCT TYPE, 2021-2031 (REVENUE, $MILLION)
    TABLE 02. PEDIATRIC NEUROLOGY DEVICE MARKET FOR NEUROSTIMULATION DEVICES, BY REGION, 2021-2031 (REVENUE, $MILLION)
    TABLE 03. PEDIATRIC NEUROLOGY DEVICE MARKET FOR NEUROSURGERY DEVICES, BY REGION, 2021-2031 (REVENUE, $MILLION)
    TABLE 04. PEDIATRIC NEUROLOGY DEVICE MARKET FOR INTERVENTIONAL NEUROLOGY DEVICES, BY REGION, 2021-2031 (REVENUE, $MILLION)
    TABLE 05. PEDIATRIC NEUROLOGY DEVICE MARKET FOR CEREBROSPINAL FLUID MANAGEMENT DEVICES, BY REGION, 2021-2031 (REVENUE, $MILLION)
    TABLE 06. PEDIATRIC NEUROLOGY DEVICE MARKET FOR OTHERS, BY REGION, 2021-2031 (REVENUE, $MILLION)
    TABLE 07. GLOBAL PEDIATRIC NEUROLOGY DEVICE MARKET, BY CONDITION, 2021-2031 (REVENUE, $MILLION)
    TABLE 08. PEDIATRIC NEUROLOGY DEVICE MARKET FOR STROKE, BY REGION, 2021-2031 (REVENUE, $MILLION)
    TABLE 09. PEDIATRIC NEUROLOGY DEVICE MARKET FOR SEIZURES, BY REGION, 2021-2031 (REVENUE, $MILLION)
    TABLE 10. PEDIATRIC NEUROLOGY DEVICE MARKET FOR HYDROCEPHALUS, BY REGION, 2021-2031 (REVENUE, $MILLION)
    TABLE 11. PEDIATRIC NEUROLOGY DEVICE MARKET FOR ONCOLOGY, BY REGION, 2021-2031 (REVENUE, $MILLION)
    TABLE 12. PEDIATRIC NEUROLOGY DEVICE MARKET FOR OTHERS, BY REGION, 2021-2031 (REVENUE, $MILLION)
    TABLE 13. GLOBAL PEDIATRIC NEUROLOGY DEVICE MARKET, BY AGE GROUP, 2021-2031 (REVENUE, $MILLION)
    TABLE 14. PEDIATRIC NEUROLOGY DEVICE MARKET FOR 0-5 YEARS, BY REGION, 2021-2031 (REVENUE, $MILLION)
    TABLE 15. PEDIATRIC NEUROLOGY DEVICE MARKET FOR 5-10 YEARS, BY REGION, 2021-2031 (REVENUE, $MILLION)
    TABLE 16. PEDIATRIC NEUROLOGY DEVICE MARKET FOR 10-15 YEARS, BY REGION, 2021-2031 (REVENUE, $MILLION)
    TABLE 17. GLOBAL PEDIATRIC NEUROLOGY DEVICE MARKET, BY END USER, 2021-2031 (REVENUE, $MILLION)
    TABLE 18. PEDIATRIC NEUROLOGY DEVICE MARKET FOR HOSPITALS, BY REGION, 2021-2031 (REVENUE, $MILLION)
    TABLE 19. PEDIATRIC NEUROLOGY DEVICE MARKET FOR AMBULATORY SURGERY CENTERS, BY REGION, 2021-2031 (REVENUE, $MILLION)
    TABLE 20. PEDIATRIC NEUROLOGY DEVICE MARKET FOR OTHERS, BY REGION, 2021-2031 (REVENUE, $MILLION)
    TABLE 21. PEDIATRIC NEUROLOGY DEVICE MARKET, BY REGION, 2021-2031 (REVENUE, $MILLION)
    TABLE 22. NORTH AMERICA PEDIATRIC NEUROLOGY DEVICE MARKET, BY PRODUCT TYPE, 2021-2031 (REVENUE, $MILLION)
    TABLE 23. NORTH AMERICA PEDIATRIC NEUROLOGY DEVICE MARKET, BY CONDITION, 2021-2031 (REVENUE, $MILLION)
    TABLE 24. NORTH AMERICA PEDIATRIC NEUROLOGY DEVICE MARKET, BY AGE GROUP, 2021-2031 (REVENUE, $MILLION)
    TABLE 25. NORTH AMERICA PEDIATRIC NEUROLOGY DEVICE MARKET, BY END USER, 2021-2031 (REVENUE, $MILLION)
    TABLE 26. NORTH AMERICA PEDIATRIC NEUROLOGY DEVICE MARKET, BY COUNTRY, 2021-2031 (REVENUE, $MILLION)
    TABLE 27. U.S. PEDIATRIC NEUROLOGY DEVICE MARKET, BY PRODUCT TYPE, 2021-2031 (REVENUE, $MILLION)
    TABLE 28. U.S. PEDIATRIC NEUROLOGY DEVICE MARKET, BY CONDITION, 2021-2031 (REVENUE, $MILLION)
    TABLE 29. U.S. PEDIATRIC NEUROLOGY DEVICE MARKET, BY AGE GROUP, 2021-2031 (REVENUE, $MILLION)
    TABLE 30. U.S. PEDIATRIC NEUROLOGY DEVICE MARKET, BY END USER, 2021-2031 (REVENUE, $MILLION)
    TABLE 31. CANADA PEDIATRIC NEUROLOGY DEVICE MARKET, BY PRODUCT TYPE, 2021-2031 (REVENUE, $MILLION)
    TABLE 32. CANADA PEDIATRIC NEUROLOGY DEVICE MARKET, BY CONDITION, 2021-2031 (REVENUE, $MILLION)
    TABLE 33. CANADA PEDIATRIC NEUROLOGY DEVICE MARKET, BY AGE GROUP, 2021-2031 (REVENUE, $MILLION)
    TABLE 34. CANADA PEDIATRIC NEUROLOGY DEVICE MARKET, BY END USER, 2021-2031 (REVENUE, $MILLION)
    TABLE 35. MEXICO PEDIATRIC NEUROLOGY DEVICE MARKET, BY PRODUCT TYPE, 2021-2031 (REVENUE, $MILLION)
    TABLE 36. MEXICO PEDIATRIC NEUROLOGY DEVICE MARKET, BY CONDITION, 2021-2031 (REVENUE, $MILLION)
    TABLE 37. MEXICO PEDIATRIC NEUROLOGY DEVICE MARKET, BY AGE GROUP, 2021-2031 (REVENUE, $MILLION)
    TABLE 38. MEXICO PEDIATRIC NEUROLOGY DEVICE MARKET, BY END USER, 2021-2031 (REVENUE, $MILLION)
    TABLE 39. EUROPE PEDIATRIC NEUROLOGY DEVICE MARKET, BY PRODUCT TYPE, 2021-2031 (REVENUE, $MILLION)
    TABLE 40. EUROPE PEDIATRIC NEUROLOGY DEVICE MARKET, BY CONDITION, 2021-2031 (REVENUE, $MILLION)
    TABLE 41. EUROPE PEDIATRIC NEUROLOGY DEVICE MARKET, BY AGE GROUP, 2021-2031 (REVENUE, $MILLION)
    TABLE 42. EUROPE PEDIATRIC NEUROLOGY DEVICE MARKET, BY END USER, 2021-2031 (REVENUE, $MILLION)
    TABLE 43. EUROPE PEDIATRIC NEUROLOGY DEVICE MARKET, BY COUNTRY, 2021-2031 (REVENUE, $MILLION)
    TABLE 44. GERMANY PEDIATRIC NEUROLOGY DEVICE MARKET, BY PRODUCT TYPE, 2021-2031 (REVENUE, $MILLION)
    TABLE 45. GERMANY PEDIATRIC NEUROLOGY DEVICE MARKET, BY CONDITION, 2021-2031 (REVENUE, $MILLION)
    TABLE 46. GERMANY PEDIATRIC NEUROLOGY DEVICE MARKET, BY AGE GROUP, 2021-2031 (REVENUE, $MILLION)
    TABLE 47. GERMANY PEDIATRIC NEUROLOGY DEVICE MARKET, BY END USER, 2021-2031 (REVENUE, $MILLION)
    TABLE 48. FRANCE PEDIATRIC NEUROLOGY DEVICE MARKET, BY PRODUCT TYPE, 2021-2031 (REVENUE, $MILLION)
    TABLE 49. FRANCE PEDIATRIC NEUROLOGY DEVICE MARKET, BY CONDITION, 2021-2031 (REVENUE, $MILLION)
    TABLE 50. FRANCE PEDIATRIC NEUROLOGY DEVICE MARKET, BY AGE GROUP, 2021-2031 (REVENUE, $MILLION)
    TABLE 51. FRANCE PEDIATRIC NEUROLOGY DEVICE MARKET, BY END USER, 2021-2031 (REVENUE, $MILLION)
    TABLE 52. UK PEDIATRIC NEUROLOGY DEVICE MARKET, BY PRODUCT TYPE, 2021-2031 (REVENUE, $MILLION)
    TABLE 53. UK PEDIATRIC NEUROLOGY DEVICE MARKET, BY CONDITION, 2021-2031 (REVENUE, $MILLION)
    TABLE 54. UK PEDIATRIC NEUROLOGY DEVICE MARKET, BY AGE GROUP, 2021-2031 (REVENUE, $MILLION)
    TABLE 55. UK PEDIATRIC NEUROLOGY DEVICE MARKET, BY END USER, 2021-2031 (REVENUE, $MILLION)
    TABLE 56. ITALY PEDIATRIC NEUROLOGY DEVICE MARKET, BY PRODUCT TYPE, 2021-2031 (REVENUE, $MILLION)
    TABLE 57. ITALY PEDIATRIC NEUROLOGY DEVICE MARKET, BY CONDITION, 2021-2031 (REVENUE, $MILLION)
    TABLE 58. ITALY PEDIATRIC NEUROLOGY DEVICE MARKET, BY AGE GROUP, 2021-2031 (REVENUE, $MILLION)
    TABLE 59. ITALY PEDIATRIC NEUROLOGY DEVICE MARKET, BY END USER, 2021-2031 (REVENUE, $MILLION)
    TABLE 60. SPAIN PEDIATRIC NEUROLOGY DEVICE MARKET, BY PRODUCT TYPE, 2021-2031 (REVENUE, $MILLION)
    TABLE 61. SPAIN PEDIATRIC NEUROLOGY DEVICE MARKET, BY CONDITION, 2021-2031 (REVENUE, $MILLION)
    TABLE 62. SPAIN PEDIATRIC NEUROLOGY DEVICE MARKET, BY AGE GROUP, 2021-2031 (REVENUE, $MILLION)
    TABLE 63. SPAIN PEDIATRIC NEUROLOGY DEVICE MARKET, BY END USER, 2021-2031 (REVENUE, $MILLION)
    TABLE 64. REST OF EUROPE PEDIATRIC NEUROLOGY DEVICE MARKET, BY PRODUCT TYPE, 2021-2031 (REVENUE, $MILLION)
    TABLE 65. REST OF EUROPE PEDIATRIC NEUROLOGY DEVICE MARKET, BY CONDITION, 2021-2031 (REVENUE, $MILLION)
    TABLE 66. REST OF EUROPE PEDIATRIC NEUROLOGY DEVICE MARKET, BY AGE GROUP, 2021-2031 (REVENUE, $MILLION)
    TABLE 67. REST OF EUROPE PEDIATRIC NEUROLOGY DEVICE MARKET, BY END USER, 2021-2031 (REVENUE, $MILLION)
    TABLE 68. ASIA-PACIFIC PEDIATRIC NEUROLOGY DEVICE MARKET, BY PRODUCT TYPE, 2021-2031 (REVENUE, $MILLION)
    TABLE 69. ASIA-PACIFIC PEDIATRIC NEUROLOGY DEVICE MARKET, BY CONDITION, 2021-2031 (REVENUE, $MILLION)
    TABLE 70. ASIA-PACIFIC PEDIATRIC NEUROLOGY DEVICE MARKET, BY AGE GROUP, 2021-2031 (REVENUE, $MILLION)
    TABLE 71. ASIA-PACIFIC PEDIATRIC NEUROLOGY DEVICE MARKET, BY END USER, 2021-2031 (REVENUE, $MILLION)
    TABLE 72. ASIA-PACIFIC PEDIATRIC NEUROLOGY DEVICE MARKET, BY COUNTRY, 2021-2031 (REVENUE, $MILLION)
    TABLE 73. CHINA PEDIATRIC NEUROLOGY DEVICE MARKET, BY PRODUCT TYPE, 2021-2031 (REVENUE, $MILLION)
    TABLE 74. CHINA PEDIATRIC NEUROLOGY DEVICE MARKET, BY CONDITION, 2021-2031 (REVENUE, $MILLION)
    TABLE 75. CHINA PEDIATRIC NEUROLOGY DEVICE MARKET, BY AGE GROUP, 2021-2031 (REVENUE, $MILLION)
    TABLE 76. CHINA PEDIATRIC NEUROLOGY DEVICE MARKET, BY END USER, 2021-2031 (REVENUE, $MILLION)
    TABLE 77. JAPAN PEDIATRIC NEUROLOGY DEVICE MARKET, BY PRODUCT TYPE, 2021-2031 (REVENUE, $MILLION)
    TABLE 78. JAPAN PEDIATRIC NEUROLOGY DEVICE MARKET, BY CONDITION, 2021-2031 (REVENUE, $MILLION)
    TABLE 79. JAPAN PEDIATRIC NEUROLOGY DEVICE MARKET, BY AGE GROUP, 2021-2031 (REVENUE, $MILLION)
    TABLE 80. JAPAN PEDIATRIC NEUROLOGY DEVICE MARKET, BY END USER, 2021-2031 (REVENUE, $MILLION)
    TABLE 81. INDIA PEDIATRIC NEUROLOGY DEVICE MARKET, BY PRODUCT TYPE, 2021-2031 (REVENUE, $MILLION)
    TABLE 82. INDIA PEDIATRIC NEUROLOGY DEVICE MARKET, BY CONDITION, 2021-2031 (REVENUE, $MILLION)
    TABLE 83. INDIA PEDIATRIC NEUROLOGY DEVICE MARKET, BY AGE GROUP, 2021-2031 (REVENUE, $MILLION)
    TABLE 84. INDIA PEDIATRIC NEUROLOGY DEVICE MARKET, BY END USER, 2021-2031 (REVENUE, $MILLION)
    TABLE 85. AUSTRALIA PEDIATRIC NEUROLOGY DEVICE MARKET, BY PRODUCT TYPE, 2021-2031 (REVENUE, $MILLION)
    TABLE 86. AUSTRALIA PEDIATRIC NEUROLOGY DEVICE MARKET, BY CONDITION, 2021-2031 (REVENUE, $MILLION)
    TABLE 87. AUSTRALIA PEDIATRIC NEUROLOGY DEVICE MARKET, BY AGE GROUP, 2021-2031 (REVENUE, $MILLION)
    TABLE 88. AUSTRALIA PEDIATRIC NEUROLOGY DEVICE MARKET, BY END USER, 2021-2031 (REVENUE, $MILLION)
    TABLE 89. SOUTH KOREA PEDIATRIC NEUROLOGY DEVICE MARKET, BY PRODUCT TYPE, 2021-2031 (REVENUE, $MILLION)
    TABLE 90. SOUTH KOREA PEDIATRIC NEUROLOGY DEVICE MARKET, BY CONDITION, 2021-2031 (REVENUE, $MILLION)
    TABLE 91. SOUTH KOREA PEDIATRIC NEUROLOGY DEVICE MARKET, BY AGE GROUP, 2021-2031 (REVENUE, $MILLION)
    TABLE 92. SOUTH KOREA PEDIATRIC NEUROLOGY DEVICE MARKET, BY END USER, 2021-2031 (REVENUE, $MILLION)
    TABLE 93. REST OF ASIA-PACIFIC PEDIATRIC NEUROLOGY DEVICE MARKET, BY PRODUCT TYPE, 2021-2031 (REVENUE, $MILLION)
    TABLE 94. REST OF ASIA-PACIFIC PEDIATRIC NEUROLOGY DEVICE MARKET, BY CONDITION, 2021-2031 (REVENUE, $MILLION)
    TABLE 95. REST OF ASIA-PACIFIC PEDIATRIC NEUROLOGY DEVICE MARKET, BY AGE GROUP, 2021-2031 (REVENUE, $MILLION)
    TABLE 96. REST OF ASIA-PACIFIC PEDIATRIC NEUROLOGY DEVICE MARKET, BY END USER, 2021-2031 (REVENUE, $MILLION)
    TABLE 97. LAMEA PEDIATRIC NEUROLOGY DEVICE MARKET, BY PRODUCT TYPE, 2021-2031 (REVENUE, $MILLION)
    TABLE 98. LAMEA PEDIATRIC NEUROLOGY DEVICE MARKET, BY CONDITION, 2021-2031 (REVENUE, $MILLION)
    TABLE 99. LAMEA PEDIATRIC NEUROLOGY DEVICE MARKET, BY AGE GROUP, 2021-2031 (REVENUE, $MILLION)
    TABLE 100. LAMEA PEDIATRIC NEUROLOGY DEVICE MARKET, BY END USER, 2021-2031 (REVENUE, $MILLION)
    TABLE 101. LAMEA PEDIATRIC NEUROLOGY DEVICE MARKET, BY COUNTRY, 2021-2031 (REVENUE, $MILLION)
    TABLE 102. BRAZIL PEDIATRIC NEUROLOGY DEVICE MARKET, BY PRODUCT TYPE, 2021-2031 (REVENUE, $MILLION)
    TABLE 103. BRAZIL PEDIATRIC NEUROLOGY DEVICE MARKET, BY CONDITION, 2021-2031 (REVENUE, $MILLION)
    TABLE 104. BRAZIL PEDIATRIC NEUROLOGY DEVICE MARKET, BY AGE GROUP, 2021-2031 (REVENUE, $MILLION)
    TABLE 105. BRAZIL PEDIATRIC NEUROLOGY DEVICE MARKET, BY END USER, 2021-2031 (REVENUE, $MILLION)
    TABLE 106. SAUDI ARABIA PEDIATRIC NEUROLOGY DEVICE MARKET, BY PRODUCT TYPE, 2021-2031 (REVENUE, $MILLION)
    TABLE 107. SAUDI ARABIA PEDIATRIC NEUROLOGY DEVICE MARKET, BY CONDITION, 2021-2031 (REVENUE, $MILLION)
    TABLE 108. SAUDI ARABIA PEDIATRIC NEUROLOGY DEVICE MARKET, BY AGE GROUP, 2021-2031 (REVENUE, $MILLION)
    TABLE 109. SAUDI ARABIA PEDIATRIC NEUROLOGY DEVICE MARKET, BY END USER, 2021-2031 (REVENUE, $MILLION)
    TABLE 110. SOUTH AFRICA PEDIATRIC NEUROLOGY DEVICE MARKET, BY PRODUCT TYPE, 2021-2031 (REVENUE, $MILLION)
    TABLE 111. SOUTH AFRICA PEDIATRIC NEUROLOGY DEVICE MARKET, BY CONDITION, 2021-2031 (REVENUE, $MILLION)
    TABLE 112. SOUTH AFRICA PEDIATRIC NEUROLOGY DEVICE MARKET, BY AGE GROUP, 2021-2031 (REVENUE, $MILLION)
    TABLE 113. SOUTH AFRICA PEDIATRIC NEUROLOGY DEVICE MARKET, BY END USER, 2021-2031 (REVENUE, $MILLION)
    TABLE 114. REST OF LAMEA PEDIATRIC NEUROLOGY DEVICE MARKET, BY PRODUCT TYPE, 2021-2031 (REVENUE, $MILLION)
    TABLE 115. REST OF LAMEA PEDIATRIC NEUROLOGY DEVICE MARKET, BY CONDITION, 2021-2031 (REVENUE, $MILLION)
    TABLE 116. REST OF LAMEA PEDIATRIC NEUROLOGY DEVICE MARKET, BY AGE GROUP, 2021-2031 (REVENUE, $MILLION)
    TABLE 117. REST OF LAMEA PEDIATRIC NEUROLOGY DEVICE MARKET, BY END USER, 2021-2031 (REVENUE, $MILLION)
    TABLE 118. INTEGRA LIFESCIENCES HOLDINGS: KEY EXECUTIVES
    TABLE 119. INTEGRA LIFESCIENCES HOLDINGS: COMPANY SNAPSHOT
    TABLE 120. INTEGRA LIFESCIENCES HOLDINGS: PRODUCT SEGMENTS
    TABLE 121. INTEGRA LIFESCIENCES HOLDINGS: PRODUCT PORTFOLIO
    TABLE 122. INTEGRA LIFESCIENCES HOLDINGS: KEY STRATERGIES
    TABLE 123. B.BRAUN SE: KEY EXECUTIVES
    TABLE 124. B.BRAUN SE: COMPANY SNAPSHOT
    TABLE 125. B.BRAUN SE: PRODUCT SEGMENTS
    TABLE 126. B.BRAUN SE: PRODUCT PORTFOLIO
    TABLE 127. MEDTRONIC PLC: KEY EXECUTIVES
    TABLE 128. MEDTRONIC PLC: COMPANY SNAPSHOT
    TABLE 129. MEDTRONIC PLC: PRODUCT SEGMENTS
    TABLE 130. MEDTRONIC PLC: PRODUCT PORTFOLIO
    TABLE 131. MEDTRONIC PLC: KEY STRATERGIES
    TABLE 132. NATUS MEDICAL INCORPORATED: KEY EXECUTIVES
    TABLE 133. NATUS MEDICAL INCORPORATED: COMPANY SNAPSHOT
    TABLE 134. NATUS MEDICAL INCORPORATED: PRODUCT SEGMENTS
    TABLE 135. NATUS MEDICAL INCORPORATED: PRODUCT PORTFOLIO
    TABLE 136. NATUS MEDICAL INCORPORATED: KEY STRATERGIES
    TABLE 137. STRYKER CORPORATION: KEY EXECUTIVES
    TABLE 138. STRYKER CORPORATION: COMPANY SNAPSHOT
    TABLE 139. STRYKER CORPORATION: PRODUCT SEGMENTS
    TABLE 140. STRYKER CORPORATION: PRODUCT PORTFOLIO
    TABLE 141. BOSTON SCIENTIFIC CORPORATION: KEY EXECUTIVES
    TABLE 142. BOSTON SCIENTIFIC CORPORATION: COMPANY SNAPSHOT
    TABLE 143. BOSTON SCIENTIFIC CORPORATION: PRODUCT SEGMENTS
    TABLE 144. BOSTON SCIENTIFIC CORPORATION: PRODUCT PORTFOLIO
    TABLE 145. ABBOTT LABORATORIES: KEY EXECUTIVES
    TABLE 146. ABBOTT LABORATORIES: COMPANY SNAPSHOT
    TABLE 147. ABBOTT LABORATORIES: PRODUCT SEGMENTS
    TABLE 148. ABBOTT LABORATORIES: PRODUCT PORTFOLIO
    TABLE 149. ABBOTT LABORATORIES: KEY STRATERGIES
    TABLE 150. LIVANOVA PLC: KEY EXECUTIVES
    TABLE 151. LIVANOVA PLC: COMPANY SNAPSHOT
    TABLE 152. LIVANOVA PLC: PRODUCT SEGMENTS
    TABLE 153. LIVANOVA PLC: PRODUCT PORTFOLIO
    TABLE 154. LIVANOVA PLC: KEY STRATERGIES
    TABLE 155. ZIMMER BIOMET HOLDING INC.: KEY EXECUTIVES
    TABLE 156. ZIMMER BIOMET HOLDING INC.: COMPANY SNAPSHOT
    TABLE 157. ZIMMER BIOMET HOLDING INC.: PRODUCT SEGMENTS
    TABLE 158. ZIMMER BIOMET HOLDING INC.: PRODUCT PORTFOLIO
    TABLE 159. ZIMMER BIOMET HOLDING INC.: KEY STRATERGIES
    TABLE 160. KARL STORZ SE & CO. KG: KEY EXECUTIVES
    TABLE 161. KARL STORZ SE & CO. KG: COMPANY SNAPSHOT
    TABLE 162. KARL STORZ SE & CO. KG: PRODUCT SEGMENTS
    TABLE 163. KARL STORZ SE & CO. KG: PRODUCT PORTFOLIO
  • LIST OF FIGURES

  • FIGURE 01. PEDIATRIC NEUROLOGY DEVICE MARKET, 2021-2031
    FIGURE 02. SEGMENTATION OF PEDIATRIC NEUROLOGY DEVICE MARKET, 2021-2031
    FIGURE 03. TOP INVESTMENT POCKETS IN PEDIATRIC NEUROLOGY DEVICE MARKET (2022-2031)
    FIGURE 04. MODERATE BARGAINING POWER OF SUPPLIERS
    FIGURE 05. MODERATE BARGAINING POWER OF BUYERS
    FIGURE 06. MODERATE THREAT OF SUBSTITUTES
    FIGURE 07. MODERATE THREAT OF NEW ENTRANTS
    FIGURE 08. MODERATE INTENSITY OF RIVALRY
    FIGURE 09. DRIVERS, RESTRAINTS AND OPPORTUNITIES: GLOBALPEDIATRIC NEUROLOGY DEVICE MARKET
    FIGURE 10. PEDIATRIC NEUROLOGY DEVICE MARKET, BY PRODUCT TYPE, 2021(%)
    FIGURE 11. COMPARATIVE SHARE ANALYSIS OF PEDIATRIC NEUROLOGY DEVICE MARKET FOR NEUROSTIMULATION DEVICES, BY COUNTRY 2021-2031(%)
    FIGURE 12. COMPARATIVE SHARE ANALYSIS OF PEDIATRIC NEUROLOGY DEVICE MARKET FOR NEUROSURGERY DEVICES, BY COUNTRY 2021-2031(%)
    FIGURE 13. COMPARATIVE SHARE ANALYSIS OF PEDIATRIC NEUROLOGY DEVICE MARKET FOR INTERVENTIONAL NEUROLOGY DEVICES, BY COUNTRY 2021-2031(%)
    FIGURE 14. COMPARATIVE SHARE ANALYSIS OF PEDIATRIC NEUROLOGY DEVICE MARKET FOR CEREBROSPINAL FLUID MANAGEMENT DEVICES, BY COUNTRY 2021-2031(%)
    FIGURE 15. COMPARATIVE SHARE ANALYSIS OF PEDIATRIC NEUROLOGY DEVICE MARKET FOR OTHERS, BY COUNTRY 2021-2031(%)
    FIGURE 16. PEDIATRIC NEUROLOGY DEVICE MARKET, BY CONDITION, 2021(%)
    FIGURE 17. COMPARATIVE SHARE ANALYSIS OF PEDIATRIC NEUROLOGY DEVICE MARKET FOR STROKE, BY COUNTRY 2021-2031(%)
    FIGURE 18. COMPARATIVE SHARE ANALYSIS OF PEDIATRIC NEUROLOGY DEVICE MARKET FOR SEIZURES, BY COUNTRY 2021-2031(%)
    FIGURE 19. COMPARATIVE SHARE ANALYSIS OF PEDIATRIC NEUROLOGY DEVICE MARKET FOR HYDROCEPHALUS, BY COUNTRY 2021-2031(%)
    FIGURE 20. COMPARATIVE SHARE ANALYSIS OF PEDIATRIC NEUROLOGY DEVICE MARKET FOR ONCOLOGY, BY COUNTRY 2021-2031(%)
    FIGURE 21. COMPARATIVE SHARE ANALYSIS OF PEDIATRIC NEUROLOGY DEVICE MARKET FOR OTHERS, BY COUNTRY 2021-2031(%)
    FIGURE 22. PEDIATRIC NEUROLOGY DEVICE MARKET, BY AGE GROUP, 2021(%)
    FIGURE 23. COMPARATIVE SHARE ANALYSIS OF PEDIATRIC NEUROLOGY DEVICE MARKET FOR 0-5 YEARS, BY COUNTRY 2021-2031(%)
    FIGURE 24. COMPARATIVE SHARE ANALYSIS OF PEDIATRIC NEUROLOGY DEVICE MARKET FOR 5-10 YEARS, BY COUNTRY 2021-2031(%)
    FIGURE 25. COMPARATIVE SHARE ANALYSIS OF PEDIATRIC NEUROLOGY DEVICE MARKET FOR 10-15 YEARS, BY COUNTRY 2021-2031(%)
    FIGURE 26. PEDIATRIC NEUROLOGY DEVICE MARKET, BY END USER, 2021(%)
    FIGURE 27. COMPARATIVE SHARE ANALYSIS OF PEDIATRIC NEUROLOGY DEVICE MARKET FOR HOSPITALS, BY COUNTRY 2021-2031(%)
    FIGURE 28. COMPARATIVE SHARE ANALYSIS OF PEDIATRIC NEUROLOGY DEVICE MARKET FOR AMBULATORY SURGERY CENTERS, BY COUNTRY 2021-2031(%)
    FIGURE 29. COMPARATIVE SHARE ANALYSIS OF PEDIATRIC NEUROLOGY DEVICE MARKET FOR OTHERS, BY COUNTRY 2021-2031(%)
    FIGURE 30. PEDIATRIC NEUROLOGY DEVICE MARKET BY REGION, 2021
    FIGURE 31. U.S. PEDIATRIC NEUROLOGY DEVICE MARKET, 2021-2031 ($MILLION)
    FIGURE 32. CANADA PEDIATRIC NEUROLOGY DEVICE MARKET, 2021-2031 ($MILLION)
    FIGURE 33. MEXICO PEDIATRIC NEUROLOGY DEVICE MARKET, 2021-2031 ($MILLION)
    FIGURE 34. GERMANY PEDIATRIC NEUROLOGY DEVICE MARKET, 2021-2031 ($MILLION)
    FIGURE 35. FRANCE PEDIATRIC NEUROLOGY DEVICE MARKET, 2021-2031 ($MILLION)
    FIGURE 36. UK PEDIATRIC NEUROLOGY DEVICE MARKET, 2021-2031 ($MILLION)
    FIGURE 37. ITALY PEDIATRIC NEUROLOGY DEVICE MARKET, 2021-2031 ($MILLION)
    FIGURE 38. SPAIN PEDIATRIC NEUROLOGY DEVICE MARKET, 2021-2031 ($MILLION)
    FIGURE 39. REST OF EUROPE PEDIATRIC NEUROLOGY DEVICE MARKET, 2021-2031 ($MILLION)
    FIGURE 40. CHINA PEDIATRIC NEUROLOGY DEVICE MARKET, 2021-2031 ($MILLION)
    FIGURE 41. JAPAN PEDIATRIC NEUROLOGY DEVICE MARKET, 2021-2031 ($MILLION)
    FIGURE 42. INDIA PEDIATRIC NEUROLOGY DEVICE MARKET, 2021-2031 ($MILLION)
    FIGURE 43. AUSTRALIA PEDIATRIC NEUROLOGY DEVICE MARKET, 2021-2031 ($MILLION)
    FIGURE 44. SOUTH KOREA PEDIATRIC NEUROLOGY DEVICE MARKET, 2021-2031 ($MILLION)
    FIGURE 45. REST OF ASIA-PACIFIC PEDIATRIC NEUROLOGY DEVICE MARKET, 2021-2031 ($MILLION)
    FIGURE 46. BRAZIL PEDIATRIC NEUROLOGY DEVICE MARKET, 2021-2031 ($MILLION)
    FIGURE 47. SAUDI ARABIA PEDIATRIC NEUROLOGY DEVICE MARKET, 2021-2031 ($MILLION)
    FIGURE 48. SOUTH AFRICA PEDIATRIC NEUROLOGY DEVICE MARKET, 2021-2031 ($MILLION)
    FIGURE 49. REST OF LAMEA PEDIATRIC NEUROLOGY DEVICE MARKET, 2021-2031 ($MILLION)
    FIGURE 50. TOP WINNING STRATEGIES, BY YEAR
    FIGURE 51. TOP WINNING STRATEGIES, BY DEVELOPMENT
    FIGURE 52. TOP WINNING STRATEGIES, BY COMPANY
    FIGURE 53. PRODUCT MAPPING OF TOP 10 PLAYERS
    FIGURE 54. COMPETITIVE DASHBOARD
    FIGURE 55. COMPETITIVE HEATMAP: PEDIATRIC NEUROLOGY DEVICE MARKET
    FIGURE 56. TOP PLAYER POSITIONING, 2021
    FIGURE 57. INTEGRA LIFESCIENCES HOLDINGS: NET REVENUE, 2019-2021 ($MILLION)
    FIGURE 58. INTEGRA LIFESCIENCES HOLDINGS: RESEARCH & DEVELOPMENT EXPENDITURE, 2019-2021
    FIGURE 59. INTEGRA LIFESCIENCES HOLDINGS: REVENUE SHARE BY REGION, 2021 (%)
    FIGURE 60. INTEGRA LIFESCIENCES HOLDINGS: REVENUE SHARE BY SEGMENT, 2021 (%)
    FIGURE 61. B.BRAUN SE: NET SALES, 2019-2021 ($MILLION)
    FIGURE 62. B.BRAUN SE: REVENUE SHARE BY SEGMENT, 2021 (%)
    FIGURE 63. B.BRAUN SE: REVENUE SHARE BY REGION, 2021 (%)
    FIGURE 64. MEDTRONIC PLC: NET SALES, 2020-2022 ($MILLION)
    FIGURE 65. MEDTRONIC PLC: REVENUE SHARE BY SEGMENT, 2022 (%)
    FIGURE 66. MEDTRONIC PLC: REVENUE SHARE BY REGION, 2022 (%)
    FIGURE 67. NATUS MEDICAL INCORPORATED: NET REVENUE, 2019-2021 ($MILLION)
    FIGURE 68. NATUS MEDICAL INCORPORATED: REVENUE SHARE BY SEGMENT, 2021 (%)
    FIGURE 69. NATUS MEDICAL INCORPORATED: REVENUE SHARE BY REGION, 2021 (%)
    FIGURE 70. STRYKER CORPORATION: NET REVENUE, 2019-2021 ($MILLION)
    FIGURE 71. STRYKER CORPORATION: REVENUE SHARE BY SEGMENT, 2021 (%)
    FIGURE 72. STRYKER CORPORATION: REVENUE SHARE BY REGION, 2021 (%)
    FIGURE 73. BOSTON SCIENTIFIC CORPORATION: NET SALES, 2019-2021 ($MILLION)
    FIGURE 74. BOSTON SCIENTIFIC CORPORATION: REVENUE SHARE BY SEGMENT, 2021 (%)
    FIGURE 75. BOSTON SCIENTIFIC CORPORATION: REVENUE SHARE BY REGION, 2021 (%)
    FIGURE 76. ABBOTT LABORATORIES: NET SALES, 2019-2021 ($MILLION)
    FIGURE 77. ABBOTT LABORATORIES: REVENUE SHARE BY SEGMENT, 2021 (%)
    FIGURE 78. ABBOTT LABORATORIES: REVENUE SHARE BY REGION, 2021 (%)
    FIGURE 79. LIVANOVA PLC: NET REVENUE, 2019-2021 ($MILLION)
    FIGURE 80. LIVANOVA PLC: REVENUE SHARE BY SEGMENT, 2021 (%)
    FIGURE 81. LIVANOVA PLC: REVENUE SHARE BY REGION, 2021 (%)
    FIGURE 82. ZIMMER BIOMET HOLDING INC.: NET SALES, 2019-2021 ($MILLION)
    FIGURE 83. ZIMMER BIOMET HOLDING INC.: REVENUE SHARE BY REGION, 2021 (%)
    FIGURE 84. ZIMMER BIOMET HOLDING INC.: REVENUE SHARE BY SEGMENT, 2021 (%)


In accordance to several interviews conducted, the process of diagnosing and treating a child with a neurological condition may be stressful task. Neurological disorders in children occur owing to abnormality in the brain, the nervous system or the muscle cells. These disorders vary from epilepsy to migraine headaches to tic or movement disorders and many more. The pediatric population may be born with the disorder, such as spina bifida or hydrocephalus, or they may acquire the disorder later in life. The medical devices approved by the regulating bodies such as U.S. Food and Drug Administration (FDA) may help in the treatment and proper management of the neurological diseases in pediatric patients.  

Asia-Pacific is expected to witness the highest CAGR during the analysis period, owing to the increase in the research and development expenditure for the development of the new products that increases the adoption rate of pediatric neurology device, increase in awareness about the neurological diseases among the adolescents and newborn, increase in the number of hospital admissions of the pediatric patients and increase in government support on research activities and other related trends adopted by the market players

PURCHASE OPTIONS

Call or Email us

U.S.-Canada Toll-free: +1-800-792-5285
Int'l : +1-503-894-6022
Europe : +44-845-528-1300
Email : help@alliedmarketresearch.com
 
FREQUENTLY ASKED QUESTIONS?

A. The total market value of the Pediatric Neurology Device Market is $2764.9 million in 2021.

A. The forecast period in the report is from 2022 to 2031.

A. North America the largest regional market for Pediatric Neurology Device

A. The market value of the Pediatric Neurology Device Market in 2022 was $2969.5 million.

A. The top companies to hold the market share in Pediatric Neurology Device are Abbott Laboratories, B. Braun Melsungen AG, Boston Scientific Corporation, Integra LifeSciences Holdings KARL STORZ SE & Co. KG., LivaNova PLC, Medtronic plc, Natus Medical Incorporated (ArchiMed), Stryker Corporation, Zimmer Biomet.

A. Yes, Pediatric Neurology Device companies are profiled in the report.

A. The key trends in the Pediatric Neurology Device Market are increasing incidence of hydrocephalus in children, and a surge in technological advancement in Pediatric Neurology Devices.

Looking for Customization?

 Customization Request

Have a Question?

 Speak with Analyst

Any Confusion?

 Inquire Before Buying

Have a glance of the Report

  Request Sample
RELATED TAGS

Purchase Full Report of
Pediatric Neurology Device Market

Start reading instantly.
This Report and over 66,905+ more Reports, Available with Avenue Library. T&C*.

  • Online Only
  • $3,570
  • Online cloud access only
  • Restricted print, copy, paste & download
  • Read only
  • Free industry update
    (Within 180 days)
  • Free report update in next update cycle
    (Jan 2024 - Jan 2025)
  • Data Pack
  • $3,840
  • Restricted to one authorized user
  • One print only
  • Available in
    Excel
  • Free industry update
    (Within 180 days)
  •   Free report update in next update cycle
    (Jan 2024 - Jan 2025)
  • Single User
  • $5,730
  • Restricted to one authorized user
  • One print only
  • Available in
    PDF
  • Free industry update
    (Within 180 days)
  •   Free report update in next update cycle
    (Jan 2024 - Jan 2025)
  • Five Users
  • $6,450
  • Limited to five authorized users
  • Print upto five copies
  • Available in
    PDF
  • Free industry update
    (Within 180 days)
  •   Free report update in next update cycle
    (Jan 2024 - Jan 2025)
  • Enterprise
    License/PDF

  • $9,600
  • Unlimited
    within
    company/enterprise
  • Available in Excel & PDF
  • Free industry update
    (Within 180 days)
  •   Free report update in next update cycle
    (Jan 2024 - Jan 2025)
  • Library
    Membership

  • $999 $ 1,175
    Per User/ Per month/ Billed annually
  • Published Content
    E-access
  • Company Profiles
    E-access
  • Newly Added Content Access
  • 10 PDF
    Downloads
  • 5 Excel Data
    Pack Downloads
  • 250 Company Profiles PDF Downloads
  • Buy Now

*Taxes/Fees, if applicable will be added during checkout. All prices in USD

RELATED REPORTS
 

Why Allied Market Research?


Infallible Methodology

To ensure high-level data integrity, accurate analysis, and impeccable forecasts

Analyst Support

For complete satisfaction

Customization

On-demand customization of scope of the report to exactly meet your needs

TARGETED MARKET VIEW

Targeted market view to provide pertinent information and save time of readers

Get fresh content delivered

Get insights on topics that are crucial for your business. Stay abreast of your interest areas.

Get Industry Data Alerts

Why Allied Market Research?

Infallible Methodology

To ensure high-level data integrity, accurate analysis, and impeccable forecasts

Analyst Support

For complete satisfaction

Customization

On-demand customization of scope of the report to exactly meet your needs

TARGETED MARKET VIEW

Targeted market view to provide pertinent information and save time of readers