Report Code: A00473 | Jan 2015 | Pages: 145 | ||
Tables: 44 | Charts: 37 |
|
Pandemic disrupted the entire world and affected many industries.
Get detailed COVID-19 impact analysis on the Permanent Magnet Motor Market
Request Now !
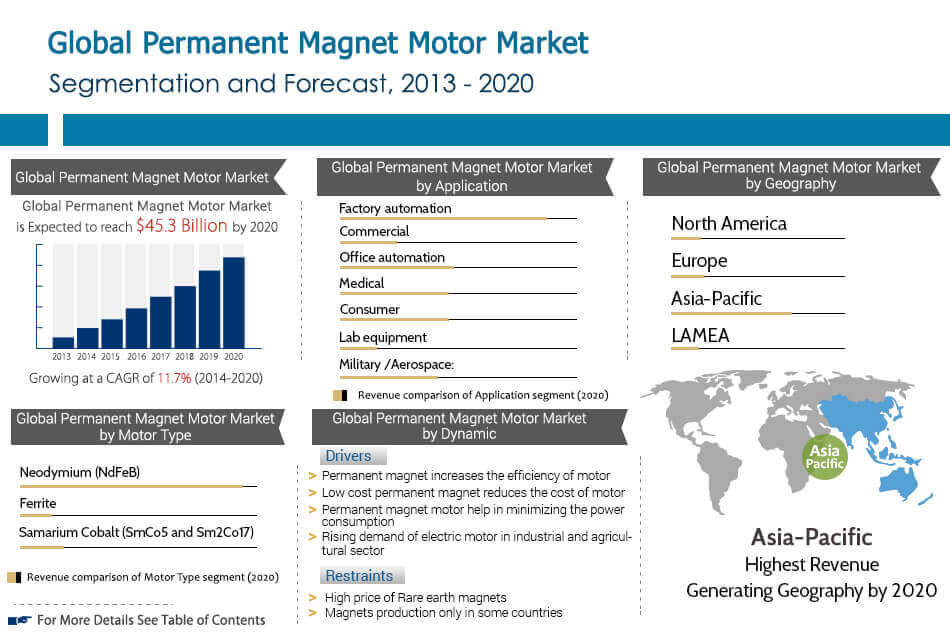
Global Permanent Magnet Motor Market is expected to garner $45.3 billion by 2020, registering a CAGR of 11.7% during the forecast period 2014-2020. Permanent magnet is an object made up of ferromagnetic material, which has magnetic properties and creates its own magnetic field. Permanent magnet motors are manufactured using permanent magnets in the rotors.
Rare earth magnets, made from rare earth metals, are powerful magnets used in PM motors. Unlike electromagnets, permanent magnets do not require continuous electrical energy to maintain their electric field, due to which PM motors are preferred over electromagnetic motors. One of the recent innovations in permanent magnets are the nanocomposite permanent magnets. The use of permanent magnets reduces the size of motors and improves performance, which can be done using nanocomposite permanent magnets. Currently, these magnets are used in magnetic storage media, biomedicine, sensors, pigments and catalysts.Â
Most permanent magnet motors are used in combination with AC or DC electric motors. These type of motors require less power, possess excellent heat dissipation property and performs with higher efficiencies as compared to other electric motors. Permanent magnet motors are used in various industrial applications, in order to improve the efficiencies of the machines. Forklifts, Robots, Blower drives, Railroad (switchers, track, crossing gates), Marine Pumps and Amusement rides, are some of the prime examples where permanent magnet motors are used. Presently, various advantages of permanent magnets such as operating capabilities at higher temperatures, (due to less rotor losses) and less bearing currents (due to larger air gaps) are driving the permanent magnet motors market. Additionally, permanent magnet synchronous motors have a 30% to 60% higher torque capacity with faster acceleration and deceleration, as compared to asynchronous type motors. On the other hand, high cost of these motors due to limited raw material sources of magnets and complex construction circuitries for some applications limits the use of these motors across various applications. Â Market players are launching highly efficient and low power consuming devices, to meet the rising demands of consumers. The market is witnessing growing trend of energy efficient motors in all applications. For instance, in 2012, Hitachi launched an 11kW, high efficiency permanent magnet synchronous motor, without the use of conventional materials. This motor is compact in size, offers an operational efficiency of approximately 93% and delivers improved performance of the motor. The efficiency of motors is divided in various efficiency classes namely IE1, IE2, IE3, IE4, where IE4 being highest efficiency and IE1 being lowest.Â
The global permanent magnet motors market is segmented based on motor type, magnet type, power range, applications and geography. Permanent magnet AC motors (PMAC) are efficient, render precise speed control, has higher power density, and longer bearing & insulation life over AC induction motors. These advantages drive the PMAC motors. Further, Neodymium (NdFeB), Samarium Cobalt (SmCo5 and Sm2Co17) and Ferrite are some major magnet types, discussed in this report. These magnets are used in the motor drives, magnetic pump couplings, generators, sensors, starter motors etc. Amongst all type of permanent magnet, Neodymium is popularly used magnet due to its operating ability at high temperatures and moderate cost. Further, permanent magnet motors, which are used in varied applications with application specific power range, is elaborated. Factory Automation, Consumer, Office automation, commercial, medical, lab equipment and military are some applications where application specific varied range of permanent magnet motors are used. Additionally, the global market is closely examined across North America, Europe, Asia Pacific and LAMEA.Â
Key Benefits
Permanent Magnet Motor Market Report Highlights
Aspects | Details |
---|---|
By MOTOR TYPE |
|
By MAGNET TYPE |
|
By POWER RANGE |
|
By APPLICATION |
|
By GEOGRAPHY |
|
Key Market Players | Autotrol Corporation, Siemens AG, Danaher Corporation, Toshiba Corporation, Baldor Electric Company, Inc., Allied Motion Technologies, Inc., Franklin Electric Co., Inc., Rockwell Automation, Inc., Ametek Inc., Johnson Electric Holdings Ltd. |
CHAPTER 1 INTRODUCTION
1.1 Report description
1.2 Key benefits
1.3 Key market segments
1.4 Research methodology
1.4.1 Secondary research
1.4.2 Primary research
1.4.3 Analyst tools and models
CHAPTER 2 EXECUTIVE SUMMARY
2.1 CXO perspective
2.2 Market beyond: what to expect by 2025
2.2.1 Base case scenario
2.2.2 Rapid growth scenario
2.2.3 Critical growth scenario
CHAPTER 3 MARKET OVERVIEW
3.1 Market definition and scope
3.2 Single-phase motors
3.3 Key findings
3.3.1 Top factors impacting the market
3.3.2 Top investment pockets
3.3.3 Top winning strategies
3.4 Porter’s Five Forces analysis
3.4.1 Low concentration of buyers and differentiated products lower the bargaining power of buyer
3.4.2 Less price-sensitive buyers maximize the bargaining power of supplier
3.4.3 Unavailability of substitute for PMMs leads to low threat of substitute
3.4.4 Fragmented buyers and brand loyalty balance the competitive rivalry
3.4.5 High initial investment lowers the threat of new entrants
3.5 Value chain analysis
3.6 Market share analysis, 2013
3.7 Case studies
3.8 Drivers
3.8.1 Permanent magnet increases the motor efficiency
3.8.2 Low cost of permanent magnet reduces the cost of motor
3.8.3 Minimized power consumption
3.8.4 Rise in demand in industrial and agricultural sectors
3.8.5 Widespread awareness of green vehicles among customers
3.9 Restraints
3.9.1 High price of rare earth magnets
3.9.2 Magnet production limited to few countries
3.10 Opportunities
3.10.1 Oil & gas industry
3.10.2 Invention of the rare earth magnets
CHAPTER 4 PERMANENT MAGNET MOTOR MARKET, BY MOTOR TYPE
4.1 Alternating current (AC) motors
4.1.1 Key market trends
4.1.2 Competitive scenario
4.1.3 Key growth factors and opportunities
4.1.4 Market size and forecast
4.1.5 U.S.
4.1.6 Canada
4.1.7 Mexico
4.1.8 Rest of North America
4.1.9 Synchronous AC motor
4.2 Direct current (DC) motor
4.2.1 Key market trends
4.2.2 Competitive scenario
4.2.3 Key growth factors and opportunities
4.2.4 Market size and forecast
4.2.5 U.S.
4.2.6 Canada
4.2.7 Rest of North America
4.2.8 Brushed DC motor
4.2.9 Brushless DC motor
4.3 Hermetic motors
4.3.1 Key market trends
4.3.2 Competitive scenario
4.3.3 Key growth factors and opportunities
4.3.4 Market size and forecast
4.3.5 U.S.
4.3.6 Canada
4.3.7 Rest of North America
CHAPTER 5 PERMANENT MAGNET MOTOR MARKET, BY MAGNET TYPE
5.1 Neodymium (NdFeB)
5.1.1 Key market trends
5.1.2 Competitive scenario
5.1.3 Key growth factors and opportunities
5.1.4 Market size and forecast
5.1.5 Alternating current (AC) motor
5.1.6 Direct current (DC) motor
5.1.7 Hermetic motors
5.2 Samarium cobalt (SmCo5 and Sm2Co17)
5.2.1 Key market trends
5.2.2 Competitive scenario
5.2.3 Key growth factors and opportunities
5.2.4 Market size and forecast
5.2.5 Alternating current (AC) motor
5.2.6 Direct current (DC) motor
5.2.7 Hermetic motors
5.3 Ferrite
5.3.1 Key market trends
5.3.2 Competitive scenario
5.3.3 Key growth factors and opportunities
5.3.4 Market size and forecast
5.3.5 Alternating current (AC) motor
5.3.6 Direct current (DC) motor
5.3.7 Hermetic motors
CHAPTER 6 GLOBAL PERMANENT MAGNET MOTOR MARKET, BY POWER RANGE
6.1 4.0 KW and Below
6.1.1 Market size and forecast
6.2 Between 4.0 and 22.0 kW
6.2.1 Market size and forecast
6.3 Between 22.0 and 75.0 kW
6.3.1 Market size and forecast
6.4 75.0 KW and above
6.4.1 Market size and forecast
CHAPTER 7 GLOBAL PERMANENT MAGNET MOTOR MARKET, BY APPLICATION
7.1 Factory automation
7.1.1 Market size and forecast
7.1.2 Machine tool
7.1.3 Motor vehicles
7.1.4 Robotics
7.1.5 Material handling
7.2 Consumer
7.2.1 Market size and forecast
7.3 Office automation
7.3.1 Market size and forecast
7.4 Commercial
7.4.1 Market size and forecast
7.5 Lab equipment
7.5.1 Market size and forecast
7.6 Medical
7.6.1 Market size and forecast
7.7 Military /Aerospace
7.7.1 Market size and forecast
CHAPTER 8 GLOBAL PERMANENT MAGNET MOTOR MARKET BY GEOGRAPHY
8.1 North America
8.1.1 Key market tends
8.1.2 Competitive scenario
8.1.3 Key growth factors and opportunities
8.1.4 Market size and forecast
8.2 Europe
8.2.1 Key market trends
8.2.2 Competitive scenario
8.2.3 Key growth factors and opportunity
8.2.4 Market size and forecast
8.3 Asia-Pacific
8.3.1 Key market trends
8.3.2 Competitive scenario
8.3.3 Key growth factors and opportunities
8.3.4 Market size and forecast
8.4 LAMEA
8.4.1 Key market trends
8.4.2 Competitive scenario
8.4.3 Key growth factors and opportunities
8.4.4 Market size and forecast
CHAPTER 9 COMPANY PROFILES
9.1 Baldor Electric Company, Inc.
9.1.1 Company overview
9.1.2 Business performance
9.1.3 Key Strategic moves and development
9.1.4 SWOT analysis and strategic conclusion of Baldor Electric
9.2 Siemens AG
9.2.1 Company overview
9.2.2 Business performance
9.2.3 SWOT analysis and strategic conclusion of Siemens AG
9.3 Rockwell Automation, Inc.
9.3.1 Company overview
9.3.2 Business performance
9.3.3 Strategic moves and development
9.3.4 SWOT analysis and strategic conclusion of Rockwell Automation
9.4 Franklin Electric Co., Inc.
9.4.1 Company overview
9.4.2 Business performance
9.4.3 Strategic moves and development
9.4.4 SWOT analysis and strategic conclusion of Franklin Electric Co. ltd.
9.5 Johnson Electric Holdings Ltd.
9.5.1 Company overview
9.5.2 Business performance
9.5.3 Strategic moves and development
9.5.4 SWOT analysis and strategic conclusion of Johnson Electric
9.6 Ametek Inc.
9.6.1 Company overview
9.6.2 Business performance
9.6.3 SWOT analysis and strategic conclusion of Ametek, Inc.
9.7 Allied Motion Technologies, Inc.
9.7.1 Company overview
9.7.2 Business performance
9.7.3 SWOT analysis and strategic conclusion of Allied Motion Technologies
9.8 Toshiba Corporation
9.8.1 Company overview
9.8.2 Business performance
9.8.3 Strategic moves and developments
9.8.4 SWOT analysis and strategic conclusion of Toshiba Corp.
9.9 Danaher Corporation
9.9.1 Company overview
9.9.2 Business performance
9.9.3 Strategic moves and developments
9.9.4 SWOT analysis and strategic conclusion of Danaher Corp.
9.10 Autotrol Corporation
9.10.1 Company overview
9.10.2 Strategic moves and developments
9.10.3 SWOT analysis and strategic conclusion of Autotrol Corp.
LIST OF TABLES
TABLE 1  GLOBAL PERMANENT MAGNET MOTORS MARKET REVENUE BY GEOGRAPHY, 2013 – 2020($ MILLION)Â
TABLE 2  GLOBAL PERMANENT MAGNET MOTOR MARKET REVENUE MODERATE GROWTH SCENARIO, 2020 – 2025 ($MILLION)Â
TABLE 3  GLOBAL PERMANENT MAGNET MOTOR MARKET REVENUE RAPID GROWTH SCENARIO, 2020 – 2025 ($MILLION)Â
TABLE 4  GLOBAL PERMANENT MAGNET MOTOR MARKET REVENUE CRITICAL GROWTH SCENARIO, 2020 – 2025 ($MILLION)Â
TABLE 5 Â FY 2011 ECO-FRIENDLY VEHICLE DOMESTIC SHIPMENTS (IN UNITS) & COMPARISON AND CHANGE (%) WITH 2010Â
TABLE 6  GLOBAL PERMANENT MAGENT MOTOR MARKET REVENUE BY MOTOR TYPE, 2013–2020 ($MILLION)Â
TABLE 7  GLOBAL ALTERNATING CURRENT TYPE PERMANENT MAGENT MOTOR MARKET REVENUE BY GEOGRAPHY, 2013–2020 ($MILLION)Â
TABLE 8  GLOBAL DIRECT CURRENT TYPE PERMANENT MAGNET MOTOR MARKET REVENUE BY GEOGRAPHY, 2013–2020 ($MILLION)Â
TABLE 9  GLOBAL HERMETIC TYPE PERMANENT MAGENT MOTOR MARKET REVENUE BY GEOGRAPHY, 2013–2020 ($MILLION)Â
TABLE 10  GLOBAL PERMANENT MAGENT MOTOR MARKET REVENUE BY MAGENT TYPE, 2013–2020 ($MILLION)Â
TABLE 11 Â NEODYMIUM MAGNET APPLICATIONS IN MOTORSÂ
TABLE 12  GLOBAL NEODYMIUM PERMANENT MAGENT MOTOR MARKET REVENUE BY GEOGRAPHY, 2013–2020 ($MILLION)Â
TABLE 13 Â PRICE RANGE OF 2:7 SAMARIUM-COBALT MATERIALÂ
TABLE 14  GLOBAL SAMARIUM COBALT PERMANENT MAGENT MOTOR MARKET REVENUE BY GEOGRAPHY, 2013–2020 ($MILLION)Â
TABLE 15 Â COMPARISON OF DIFFERENT MAGNET MATERIALSÂ
TABLE 16  GLOBAL FERRITE PERMANENT MAGENT MOTOR MARKET REVENUE BY GEOGRAPHY, 2013–2020 ($MILLION)Â
TABLE 17  GLOBAL PERMANENT MAGENT MOTOR MARKET REVENUE BY POWER RANGE, 2013–2020 ($MILLION)Â
TABLE 18  GLOBAL PERMANENT MAGENT MOTOR MARKET BY POWER RANGE (KW), 2013–2020 (MILLION UNITS)Â
TABLE 19  GLOBAL 4.0 KW AND BELOW POWER RANGE PERMANENT MAGENT MOTOR MARKET REVENUE BY GEOGRAPHY, 2013–2020 ($MILLION)Â
TABLE 20  GLOBAL BETWEEN 4.0 KW - 22.0KW POWER RANGE PERMANENT MAGENT MOTOR MARKET REVENUE BY GEOGRAPHY, 2013–2020 ($MILLION)Â
TABLE 21  GLOBAL BETWEEN 22.0 KW - 75.0KW POWER RANGE PERMANENT MAGENT MOTOR MARKET REVENUE BY GEOGRAPHY, 2013–2020 ($MILLION)Â
TABLE 22  GLOBAL 75.0 KW AND ABOVE POWER RANGE PERMANENT MAGENT MOTOR MARKET REVENUE BY GEOGRAPHY, 2013–2020 ($MILLION)Â
TABLE 23  GLOBAL PERMANENT MAGENT MOTOR MARKET REVENUE BY APPLICATION, 2013–2020 ($MILLION)Â
TABLE 24  GLOBAL FACTORY AUTOMATION APPLICATION PERMANENT MAGENT MOTOR MARKET REVENUE BY GEOGRAPHY, 2013–2020 ($MILLION)Â
TABLE 25  GLOBAL CONSUMER APPLICATION PERMANENT MAGENT MOTOR MARKET REVENUE BY GEOGRAPHY, 2013–2020 ($MILLION)Â
TABLE 26  GLOBAL OFFICE AUTOMATION APPLICATION PERMANENT MAGENT MOTOR MARKET REVENUE BY GEOGRAPHY, 2013–2020 ($MILLION)Â
TABLE 27  GLOBAL COMMERCIAL APPLICATION PERMANENT MAGENT MOTOR MARKET REVENUE BY GEOGRAPHY, 2013–2020 ($MILLION)Â
TABLE 28  GLOBAL LAB EQUIPMENT APPLICATION PERMANENT MAGENT MOTOR MARKET REVENUE BY GEOGRAPHY, 2013–2020 ($MILLION)Â
TABLE 29  GLOBAL LAB EQUIPMENT APPLICATION PERMANENT MAGENT MOTOR MARKET REVENUE BY GEOGRAPHY, 2013–2020 ($MILLION)Â
TABLE 30  GLOBAL MILITARY/AEROSPACE APPLICATION PERMANENT MAGENT MOTOR MARKET REVENUE BY GEOGRAPHY, 2013–2020 ($MILLION)Â
TABLE 31  NORTH AMERICAN PERMANENT MAGENT MOTOR MARKET REVENUE BY MAGNET TYPE, 2013–2020 ($MILLION)Â
TABLE 32  EUROPEAN PERMANENT MAGENT MOTOR MARKET REVENUE BY MAGNET TYPE, 2013–2020 ($MILLION)Â
TABLE 33  ASIA PACIFIC PERMANENT MAGENT MOTOR MARKET REVENUE BY MAGNET TYPE, 2013–2020 ($MILLION)
TABLE 34  LAMEA PERMANENT MAGENT MOTOR MARKET REVENUE BY MAGNET TYPE, 2013–2020 ($MILLION)Â
TABLE 35 Â BALDOR ELECTRIC SNAPSHOTÂ
TABLE 36 Â SIEMENS AG SNAPSHOTÂ
TABLE 37 Â COMPANY SNAPSHOT OF ROCKWELL AUTOMATIONÂ
TABLE 38 Â FRANKLIN ELECTRIC CO. SNAPSHOTÂ
TABLE 39 Â JOHNSON ELECTRIC HOLDING LTD. SNAPSHOTÂ
TABLE 40 Â AMETEK, INC, COMPANY SNAPSHOTÂ
TABLE 41 Â ALLIED MOTION TECHNOLOGIES SNAP SHOTÂ
TABLE 42 Â TOSHIBA CORP. SNAPSHOTÂ
TABLE 43 Â DANAHER CORP. SNAPSHOTÂ
TABLE 44 Â AUTOTROL CORPORATION SNAPSHOTÂ
LIST OF FIGURES
FIG. 1 Â TOP IMPACTING FACTORS, BASE CASE SCENARIO (2020-2025)Â
FIG. 2 Â TOP IMPACTING FACTORS,RAPID CASE SCENARIO (2020-2025)Â
FIG. 3 Â TOP IMPACTING FACTORS, CRITICALCASE SCENARIO (2020-2025)Â
FIG. 4 Â TOP IMPACTING FACTORSÂ
FIG. 5 Â TOP INVESTMENT POCKETSÂ
FIG. 6 Â TOP WINNING STRATEGIESÂ
FIG. 7 Â TOP WINNING STRATEGIESÂ
FIG. 8 Â PORTERS FIVE FORCE ANALYSISÂ
FIG. 9 Â VALUE CHAIN ANALYSISÂ
FIG. 10 Â MARKET SHARE ANALYSISÂ
FIG. 11 Â COMPARISON OF EFFICIENCIES OF IPM AND INDUCTION MOTORSÂ
FIG. 12 Â COMPARISON BETWEEN AGING TIME OF COBALT FREE AND TRADITIONAL ALLOYÂ
FIG. 13 Â ELECTRICITY CONSUMPTION BY INDUSTRIES IN U.S (2013)Â
FIG. 14 Â RARE EARTH MAGNET BY APPLICATION, 2012Â
FIG. 15 Â COMAPRISION OF THE OPERATING TEMPERATURE OF SAMARIUM-COBALT MAGNETSÂ
FIG. 16 Â BALDOR ELECTRIC COMPANY REVENUE INC ($MILLION)Â
FIG. 17 Â SWOT ANALYSIS BALDOR ELECTRICÂ
FIG. 18 Â SIEMENS COMPANY REVENUE INC ($MILLION)Â
FIG. 19 Â SWOT ANALYSIS SIEMENS AGÂ
FIG. 20 Â ROCKWELL AUTOMATION COMPANY REVENUE INC ($MILLION)Â
FIG. 21 Â SWOT ANALYSIS ROCKWELL AUTOMATIONÂ
FIG. 22 Â FRANKLIN ELECTRIC COMPANY REVENUE INC ($MILLION)Â
FIG. 23 Â SWOT ANALYSIS FRANKLIN ELECTRIC CO LTD.Â
FIG. 24 Â JOHNSON ELECTRIC HOLDINGS LTD. COMPANY REVENUE INC ($MILLION)Â
FIG. 25 Â SWOT ANALYSIS JOHNSON ELECTRICÂ
FIG. 26  AMETEK’S REVENUE 2011-2013 ($ MILLION)Â
FIG. 27 Â ALLIED MOTION TECHNOLOGIES REVENUE INC ($MILLION)Â
FIG. 28 Â SWOT ANALYSIS OF ALLIED MOTION TECHNOLOGIESÂ
FIG. 29 Â KEY FINANCIALS OF TOSHIBA CORP. BY NET SALES, 2013-2011, $ MILLIONÂ
FIG. 30 Â KEY FINANCIALS OF TOSHIBA CORP. NET SALES BY PRODUCTS AND SERVICES, 2013, $ MILLIONÂ
FIG. 31 Â KEY FINANCIALS OF TOSHIBA CORP. SALES BY GEOGRAPHY, 2014, $ MILLIONÂ
FIG. 32 Â SWOT ANALYSIS OF TOSHIBA CORP.Â
FIG. 33 Â KEY FINANCIALS OF DANAHER CORP. BY SALES, 2013-2011, $ MILLION 138
FIG. 34 Â KEY FINANCIALS OF DANAHER CORP. SALES BY PRODUCTS AND SERVICES, 2013, $ MILLION
FIG. 35 Â KEY FINANCIALS OF DANAHER CORP. SALES BY GEOGRAPHY, 2013, $ MILLIONÂ
FIG. 36 Â SWOT ANALYSIS OF DANAHER CORP.Â
FIG. 37 Â SWOT ANALYSIS OF AUTOTROL CORP.Â
Start reading instantly.
This Report and over 68,075+ more Reports, Available with Avenue Library. T&C*.
Enterprise
License/PDF
Library
Membership
*Taxes/Fees, if applicable will be added during checkout. All prices in USD
To ensure high-level data integrity, accurate analysis, and impeccable forecasts
For complete satisfaction
On-demand customization of scope of the report to exactly meet your needs
Targeted market view to provide pertinent information and save time of readers
Get insights on topics that are crucial for your business. Stay abreast of your interest areas.
Get Industry Data AlertsTo ensure high-level data integrity, accurate analysis, and impeccable forecasts
For complete satisfaction
On-demand customization of scope of the report to exactly meet your needs
Targeted market view to provide pertinent information and save time of readers