0
New
New
2023
Personalized Cancer Medicine Market

Personalized Cancer Medicine Market

by Product (Personalized Medicine Therapeutics, Personalized Medicine Diagnostics), by End User (Hospitals and clinics, Others): Global Opportunity Analysis and Industry Forecast, 2023-2032

Report Code: A13364
Jun 2023 | Pages: 209
Tables: 94
Charts: 60
  • Formats*:

  • pdf

    Single User License, Five User
    License & Enterprise User License

  • xls

    Data Pack Excel License

  • ppt

    It comes with the additional cost
    of $2500.00 contact sales.


Personalized Cancer Medicine Market Research, 2032

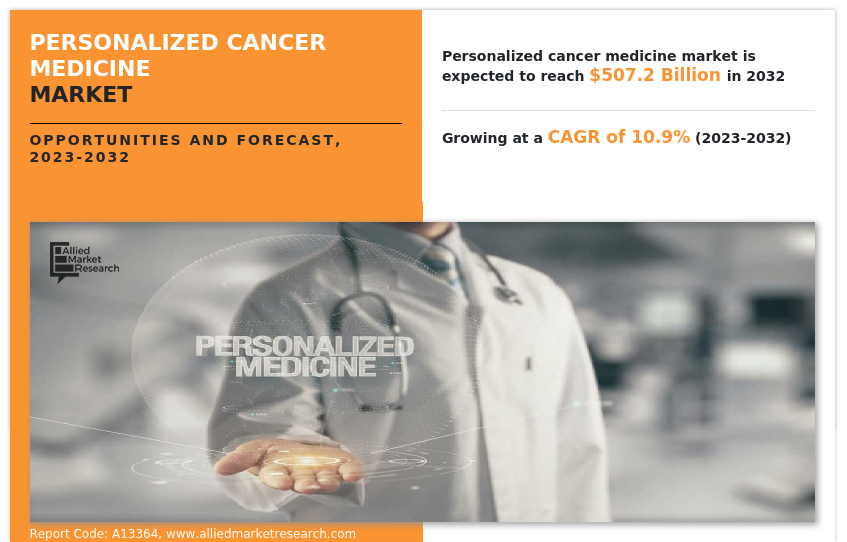
The global personalized cancer medicine market size was valued at $180 billion in 2022, and is projected to reach $507.2 billion by 2032, growing at a CAGR of 10.9% from 2023 to 2032. Personalized medicine, also referred to as precision medicine, is an approach to healthcare that revolves around customizing medical treatment based on the individual characteristics of each patient. This approach acknowledges the uniqueness of each patient and recognizes that treatments effective for one person may not be suitable for another.

Personalized cancer medicine focuses on utilizing an individual's distinct genetic makeup, lifestyle, and medical history to develop targeted and more efficient treatments. Through advanced diagnostic tests and tools, healthcare providers identify genetic variations or other biomarkers associated with specific diseases, enabling them to create personalized treatment plans that cater to the specific needs of each patient. Furthermore, personalized medicine is a rapidly advancing field with the potential to revolutionize healthcare by enhancing the accuracy and effectiveness of medical treatments, reducing healthcare expenses, and improving patient outcomes. 
The personalized cancer medicine market was negatively impacted during the lockdown period owing to a disrupted global supply chain, and decrease in hospital visits of patients. However, post COVID-19 prevailing cases of cancer has highlighted the need for innovation in the healthcare sector and thus shown positive impact on the growth of the market.

Personalized Cancer Medicine Market

Market Dynamics 

Growth of the personalized cancer medicine market size is mainly attributed to the rise in the prevalence of cancer patients thus, increases the demand for personalized diagnostic and personalized therapeutics solutions. In addition, advancements in genomics and proteomics are further boosting the market growth. The rapid progress in genomics and proteomics has allowed for the identification of disease biomarkers, which are specific molecules or characteristics that indicate the presence of cancer or a predisposition to developing cancer. By identifying these biomarkers, researchers and medical professionals can gain insights into the underlying mechanisms of the disease, as well as develop targeted therapies that are tailored to the individual patient's genetic makeup and specific biomarker profile. 

Additionally, companion diagnostics, an important component of personalized medicine, allows for the identification of patients who are likely to benefit from a particular treatment, and also helps to monitor the patient's response to that treatment over time. By using companion diagnostics, physicians can make more informed decisions about which treatments are most appropriate for the patients, and adjust those treatments as necessary based on the patient's individual response. Thereby driving the personalized cancer medicine market growth. 

Furthermore, presence of large number of key players in the market is further expanding the market growth. Aadi Bioscience, Inc., Abbott laboratories, ARIEL Precision Medicine, Inc., Illumina, Inc. and Qiagen are few of the key players offering personalized cancer medicine solutions. These key players are adopting various growth strategies to expand its business and remain in competition with other key players. For instance, in April 2021, F. Hoffmann-La Roche Ltd., receives FDA approval for first companion diagnostic to identify endometrial cancer patients eligible for anti-PD1 immunotherapy. More such product offering , approvals and strategies adopted by the key players is boosting the growth during personalized cancer medicine market forecast.  

Although various factors are driving the growth of the market, factor such as lack of awareness about personalized medicines among the population in underdeveloped countries is causing hindrance to the market growth. In addition, the high cost of the therapies makes it inaccessible for people in poor countries, which further acts as a restraint to the market growth.  

The COVID-19 pandemic's effects have a severe negative influence on personalized cancer medicine industry. Cancer diagnoses, treatments, and research activities have all been delayed as a result of the outbreak's interference with the healthcare system. The advancement of innovative therapies had been hampered by the suspension or slowing of clinical trials for personalized cancer treatments. Additionally, the pandemic-related economic downturn has put financial strain on both patients and healthcare providers, adding to the burden of the expensive personalized cancer treatments. Thus, pandemic has a detrimental effect on the market for personalized cancer treatments.  

However, the COVID-19 pandemic has highlighted the shortcomings of present therapeutic strategies, emphasizing the need for customized treatments and a greater comprehension of each patient's genetic profile. Additionally, the market for personalized cancer medications is expanding due to the cancer incidence's continued high rate and the increased emphasis on research and development activities. Key market companies have the chance to recoup momentum and deal with the backlog of postponed or delayed cancer cases as healthcare systems stabilize and resume normal operations. Furthermore, governments and healthcare organizations have recognized the importance of enhancing infrastructure, resources, and capacity to provide optimal cancer care, including improving the availability and accessibility of precision medicines. These investments contribute to the favorable prospects and advancement of personalized cancer medicine which drive the growth of the personalized cancer medicine industry during forecast period. 

Segmental Overview 

The global Personalized cancer medicine market is segmented based on product, end user and region. By product, the market is categorized into personalized medicine diagnostics and personalized medicine therapeutics. Based on end user, the market is segmented into hospitals & clinics, and others. Region wise, the market is analyzed across North America (the U.S., Canada), Europe (Germany, France, the UK, and rest of Europe), Asia-Pacific (Japan, China and rest of Asia-Pacific), and LAMEA (Latin America, Middle East & Africa). 

By Product Type  

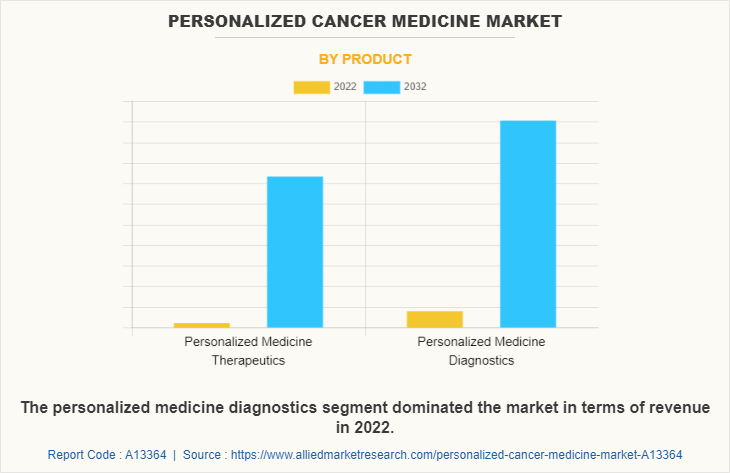
The personalized medicine diagnostics segment was the largest revenue personalized cancer medicine market share in 2022, and is anticipated to grow at the fastest rate during the forecast period, owing to advancements in genomic technologies, increased collaborations between diagnostic companies, pharmaceutical companies, and academic institutions, regulatory support, and the rising demand for personalized treatment approaches. These factors have collectively stimulated the development and adoption of personalized medicine diagnostics, driving its rapid expansion. In addition, the growing burden of the cancer-affected population is further attributed to the demand of personalized diagnostics. 
Personalized Cancer Medicine Market

By End User

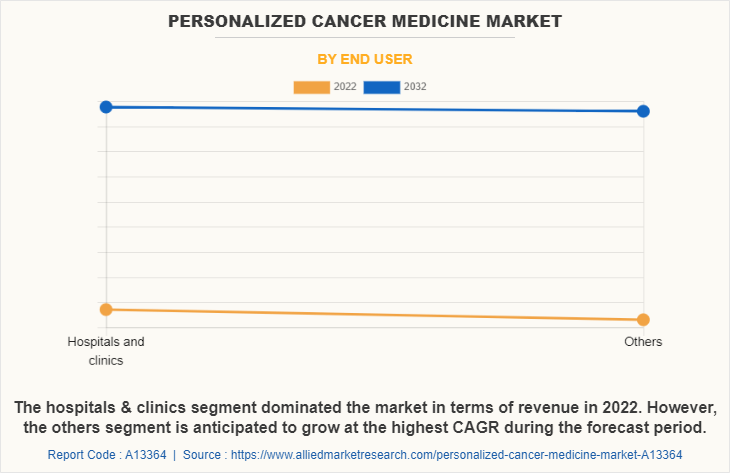
On the basis of end user, the hospitals & clinics segments was the largest revenue contributor to the market in 2022. This is attributable to an increase in the number of patients receiving individualized care in hospitals, which are home to cutting-edge genomic and proteomic technology required for patient data analysis and illness biomarker identification. On the other hand, the others segment is anticipated to see the highest CAGR during the projection period due to the breakthroughs made in personalized cancer medicine by CROs, research institutes, bio and health informatics firms, pharma & biotech companies, and diagnostic tool companies. 
Personalized Cancer Medicine Market

By Region

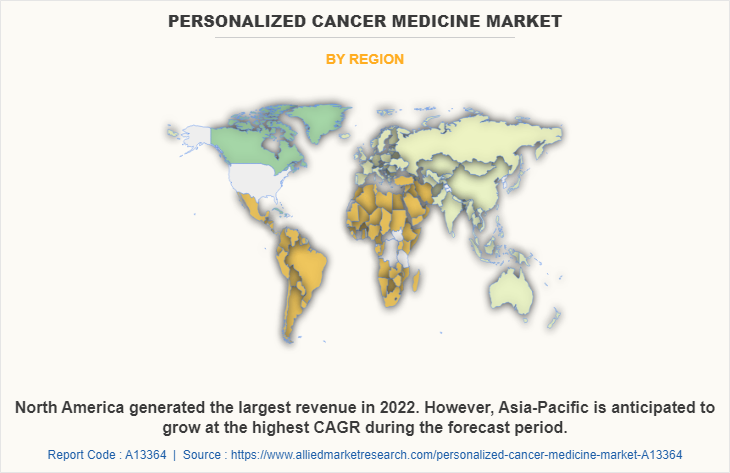
The personalized medicines market is analyzed across North America, Europe, Asia-Pacific, and LAMEA. North America accounted for a major personalized cancer medicine market share in 2022, and is expected to maintain its dominance during the forecast period owing to presence of several major players, such as F. Hoffmann-La Roche Ltd., ARIEL Precision Medicine, Inc, Abbott Laboratories, and Bristol Meyer Squibb is the prime factor boosting the growth of personalized medicines market in this region. In addition, the high prevalence of cancer in North America, is increasing the demand for personalized medicines solutions that can provide more targeted and effective treatments.

Asia-Pacific expected to grow at the highest rate during the forecast period. The market growth in this region is attributable to presence of pharmaceutical companies in the region as well as growth in the purchasing power of populated countries, such as China and India. Moreover, rise in personalized medicine expenditure and adoption of high-tech processing to improve the production of personalized solutions, is anticipated to drive the growth of the market.  

Furthermore, Asia-Pacific region has a large and growing population, which is driving demand for more personalized healthcare solutions, including personalized cancer medicines. Also, the prevalence of cancer with the ageing population in the Asia-Pacific region, which is driving demand for more effective and targeted treatments. Advances in genomics, bioinformatics, and other technologies are enabling the development of new personalized medicine solutions in this region.    
Personalized Cancer Medicine Market

COMPETITION ANALYSIS 

Competitive analysis and profiles of the major players in the personalized cancer medicines market, such as Abbott Laboratories, ARIEL Precision Medicine, Inc., F. Hoffmann-La Roche Ltd., GE Healthcare, Inc, Aadi Bioscience, Inc., Illumina, Inc., Qiagen, Novartis AG, Thermo Fisher Scientific Inc., Bristol-Myers Squibb Company. Major players have adopted product launch, product approval, partnership, acquisition, collaboration, branding, expansion and agreement as key developmental strategies to improve the product portfolio of personalized cancer medicines.  

Recent Approvals in the Personalized Cancer Medicines Market

  • In December 2022, Qiagen received the U.S. Food and Drug Administration (FDA) approval for its therascreen KRAS RGQ PCR kit as a companion diagnostic test to Mirati Therapeutic’s drug KRAZATI (adagrasib) for diagnosis and treatment of non-small cell lung cancer. 

Recent Product Launches in the Personalized Cancer Medicines Market 

  • In March 2022, Illumina, Inc. announced the launch of TruSight Oncology (TSO) Comprehensive (EU), a single test that assesses multiple tumor genes and biomarkers to reveal the specific molecular profile of a patient's cancer.‐¯ 
  • In December 2021, F. Hoffmann-La Roche Ltd., announced today the launch of NAVIFY‐¯Oncology Hub, its latest digital solution to further enhance clinical decision support and workflow optimization for oncologists and oncology care teams. 

Recent Partnership in the Personalized Cancer Medicines Market 

  • In January 2020, Illumina, Inc., announced a multi-year partnership with Agendia N.V., a world leader in precision oncology for breast cancer, to co-develop‐¯in vitro‐¯diagnostic (IVD) tests for oncology testing. The partnership is intended to advance the use of next-generation sequencing (NGS) for decentralized oncology testing and aligns with Illumina's approach to IVD partnerships in oncology. 

Recent Collaboration in the Personalized Cancer Medicines Market 

  • In November 2021, GE Healthcare, a global leader in medical imaging solutions and Optellum, leader in AI decision support for the early diagnosis,  announced that they have signed a letter of intent to collaborate to advance precision diagnosis and treatment of lung cancer. 
  • In July 2021, Qiagen announced a strategic alliance with Sysmex Corporation for the development and commercialization of cancer companion diagnostics, thereby expand its leadership in this field. 

Key Benefits For Stakeholders

  • This report provides a quantitative analysis of the market segments, current trends, estimations, and dynamics of the personalized cancer medicine market analysis from 2022 to 2032 to identify the prevailing personalized cancer medicine market opportunity.
  • The market research is offered along with information related to key drivers, restraints, and opportunities.
  • Porter's five forces analysis highlights the potency of buyers and suppliers to enable stakeholders make profit-oriented business decisions and strengthen their supplier-buyer network.
  • In-depth analysis of the personalized cancer medicine market segmentation assists to determine the prevailing market opportunities.
  • Major countries in each region are mapped according to their revenue contribution to the global market.
  • Market player positioning facilitates benchmarking and provides a clear understanding of the present position of the market players.
  • The report includes the analysis of the regional as well as global personalized cancer medicine market trends, key players, market segments, application areas, and market growth strategies.

Personalized Cancer Medicine Market Report Highlights

Aspects Details
Market Size By 2032 USD 507.2 billion
Growth Rate CAGR of 10.9%
Forecast period 2022 - 2032
Report Pages 209
By Product
  • Personalized Medicine Diagnostics
  • Personalized Medicine Therapeutics
By End User
  • Hospitals and clinics
  • Others
By Region
  • North America  (U.S., Canada, Mexico)
  • Europe  (Germany, France, UK, Italy, Spain, Rest of Europe)
  • Asia-Pacific  (Japan, China, Australia, Rest of Asia-Pacific)
  • LAMEA  (Latin America, Middle East And Africa)
Key Market Players Illumina, Inc., Abbott Laboratories, Aadi Bioscience, Inc., ARIEL Precision Medicine, Inc., Qiagen NV., Novartis AG, Bristol-Myers Squibb Company, F. Hoffmann-La Roche Ltd., Thermo Fisher Scientific Inc., General Electric

Analyst Review

The increase in demand for novel therapeutics and rise in investments globally are expected to offer profitable opportunities for the expansion of the market. In addition, favorable government initiatives and a rise in awareness about early diagnosis and treatment of cancer through precision medicine is driving the market growth.
Rapidly expanding clinical trial activities, recent commercialization of personalized therapeutic products, increasing focus of key players in adopting strategies to increase accessibility, and utilization of precision medicine are expected to fuel the market growth during the forecast period. Further, geriatric people are at high risk of cancer due to weekend immunity. Thus, a rise in the number of geriatric population results in rise in demand for effective targeted medications, thereby driving the growth of the market. 
Furthermore, North America accounted for the largest share in terms of revenue in 2022. This growth is attributed to a rise in prevalence of cancer cases and well-established research & commercialization base. However, Asia-Pacific is expected to witness highest growth during the forecast period, owing to rise in geriatric population, unmet medical demands, initiatives by government & non-governmental organizations (NGOs) to promote awareness regarding precision medicine in cancer treatment, and increase in public–private investments in the healthcare sector. 


  • CHAPTER 1: INTRODUCTION

    • 1.1. Report description

    • 1.2. Key market segments

    • 1.3. Key benefits to the stakeholders

    • 1.4. Research Methodology

      • 1.4.1. Primary research

      • 1.4.2. Secondary research

      • 1.4.3. Analyst tools and models

  • CHAPTER 2: EXECUTIVE SUMMARY

    • 2.1. CXO Perspective

  • CHAPTER 3: MARKET OVERVIEW

    • 3.1. Market definition and scope

    • 3.2. Key findings

      • 3.2.1. Top impacting factors

      • 3.2.2. Top investment pockets

    • 3.3. Porter’s five forces analysis

      • 3.3.1. High bargaining power of suppliers

      • 3.3.2. Low threat of new entrants

      • 3.3.3. Low threat of substitutes

      • 3.3.4. Moderate intensity of rivalry

      • 3.3.5. Moderate bargaining power of buyers

    • 3.4. Market dynamics

      • 3.4.1. Drivers

        • 3.4.1.1. Rise in prevalence of cancer
        • 3.4.1.2. Increase in demand for ideal therapeutics for treatment
        • 3.4.1.3. Rise in adoption of Artificial Intelligence (AI) based diagnosis

      • 3.4.2. Restraints

        • 3.4.2.1. High cost of personalized medicine
        • 3.4.2.2. Limited Reimbursement and coverage

      • 3.4.3. Opportunities

        • 3.4.3.1. Increase in R&D activities in personalized cancer medicine

    • 3.5. COVID-19 Impact Analysis on the market

  • CHAPTER 4: PERSONALIZED CANCER MEDICINE MARKET, BY PRODUCT

    • 4.1. Overview

      • 4.1.1. Market size and forecast

    • 4.2. Personalized Medicine Therapeutics

      • 4.2.1. Key market trends, growth factors and opportunities

      • 4.2.2. Market size and forecast, by region

      • 4.2.3. Market share analysis by country

    • 4.3. Personalized Medicine Diagnostics

      • 4.3.1. Key market trends, growth factors and opportunities

      • 4.3.2. Market size and forecast, by region

      • 4.3.3. Market share analysis by country

  • CHAPTER 5: PERSONALIZED CANCER MEDICINE MARKET, BY END USER

    • 5.1. Overview

      • 5.1.1. Market size and forecast

    • 5.2. Hospitals and clinics

      • 5.2.1. Key market trends, growth factors and opportunities

      • 5.2.2. Market size and forecast, by region

      • 5.2.3. Market share analysis by country

    • 5.3. Others

      • 5.3.1. Key market trends, growth factors and opportunities

      • 5.3.2. Market size and forecast, by region

      • 5.3.3. Market share analysis by country

  • CHAPTER 6: PERSONALIZED CANCER MEDICINE MARKET, BY REGION

    • 6.1. Overview

      • 6.1.1. Market size and forecast By Region

    • 6.2. North America

      • 6.2.1. Key trends and opportunities

      • 6.2.2. Market size and forecast, by Product

      • 6.2.3. Market size and forecast, by End User

      • 6.2.4. Market size and forecast, by country

        • 6.2.4.1. U.S.
          • 6.2.4.1.1. Key market trends, growth factors and opportunities
          • 6.2.4.1.2. Market size and forecast, by Product
          • 6.2.4.1.3. Market size and forecast, by End User
        • 6.2.4.2. Canada
          • 6.2.4.2.1. Key market trends, growth factors and opportunities
          • 6.2.4.2.2. Market size and forecast, by Product
          • 6.2.4.2.3. Market size and forecast, by End User
        • 6.2.4.3. Mexico
          • 6.2.4.3.1. Key market trends, growth factors and opportunities
          • 6.2.4.3.2. Market size and forecast, by Product
          • 6.2.4.3.3. Market size and forecast, by End User
    • 6.3. Europe

      • 6.3.1. Key trends and opportunities

      • 6.3.2. Market size and forecast, by Product

      • 6.3.3. Market size and forecast, by End User

      • 6.3.4. Market size and forecast, by country

        • 6.3.4.1. Germany
          • 6.3.4.1.1. Key market trends, growth factors and opportunities
          • 6.3.4.1.2. Market size and forecast, by Product
          • 6.3.4.1.3. Market size and forecast, by End User
        • 6.3.4.2. France
          • 6.3.4.2.1. Key market trends, growth factors and opportunities
          • 6.3.4.2.2. Market size and forecast, by Product
          • 6.3.4.2.3. Market size and forecast, by End User
        • 6.3.4.3. UK
          • 6.3.4.3.1. Key market trends, growth factors and opportunities
          • 6.3.4.3.2. Market size and forecast, by Product
          • 6.3.4.3.3. Market size and forecast, by End User
        • 6.3.4.4. Italy
          • 6.3.4.4.1. Key market trends, growth factors and opportunities
          • 6.3.4.4.2. Market size and forecast, by Product
          • 6.3.4.4.3. Market size and forecast, by End User
        • 6.3.4.5. Spain
          • 6.3.4.5.1. Key market trends, growth factors and opportunities
          • 6.3.4.5.2. Market size and forecast, by Product
          • 6.3.4.5.3. Market size and forecast, by End User
        • 6.3.4.6. Rest of Europe
          • 6.3.4.6.1. Key market trends, growth factors and opportunities
          • 6.3.4.6.2. Market size and forecast, by Product
          • 6.3.4.6.3. Market size and forecast, by End User
    • 6.4. Asia-Pacific

      • 6.4.1. Key trends and opportunities

      • 6.4.2. Market size and forecast, by Product

      • 6.4.3. Market size and forecast, by End User

      • 6.4.4. Market size and forecast, by country

        • 6.4.4.1. Japan
          • 6.4.4.1.1. Key market trends, growth factors and opportunities
          • 6.4.4.1.2. Market size and forecast, by Product
          • 6.4.4.1.3. Market size and forecast, by End User
        • 6.4.4.2. China
          • 6.4.4.2.1. Key market trends, growth factors and opportunities
          • 6.4.4.2.2. Market size and forecast, by Product
          • 6.4.4.2.3. Market size and forecast, by End User
        • 6.4.4.3. Australia
          • 6.4.4.3.1. Key market trends, growth factors and opportunities
          • 6.4.4.3.2. Market size and forecast, by Product
          • 6.4.4.3.3. Market size and forecast, by End User
        • 6.4.4.4. Rest of Asia-Pacific
          • 6.4.4.4.1. Key market trends, growth factors and opportunities
          • 6.4.4.4.2. Market size and forecast, by Product
          • 6.4.4.4.3. Market size and forecast, by End User
    • 6.5. LAMEA

      • 6.5.1. Key trends and opportunities

      • 6.5.2. Market size and forecast, by Product

      • 6.5.3. Market size and forecast, by End User

      • 6.5.4. Market size and forecast, by country

        • 6.5.4.1. Latin America
          • 6.5.4.1.1. Key market trends, growth factors and opportunities
          • 6.5.4.1.2. Market size and forecast, by Product
          • 6.5.4.1.3. Market size and forecast, by End User
        • 6.5.4.2. Middle East And Africa
          • 6.5.4.2.1. Key market trends, growth factors and opportunities
          • 6.5.4.2.2. Market size and forecast, by Product
          • 6.5.4.2.3. Market size and forecast, by End User
  • CHAPTER 7: COMPETITIVE LANDSCAPE

    • 7.1. Introduction

    • 7.2. Top winning strategies

    • 7.3. Product Mapping of Top 10 Player

    • 7.4. Competitive Dashboard

    • 7.5. Competitive Heatmap

    • 7.6. Top player positioning, 2022

  • CHAPTER 8: COMPANY PROFILES

    • 8.1. Abbott Laboratories

      • 8.1.1. Company overview

      • 8.1.2. Key Executives

      • 8.1.3. Company snapshot

      • 8.1.4. Operating business segments

      • 8.1.5. Product portfolio

      • 8.1.6. Business performance

    • 8.2. ARIEL Precision Medicine, Inc.

      • 8.2.1. Company overview

      • 8.2.2. Key Executives

      • 8.2.3. Company snapshot

      • 8.2.4. Operating business segments

      • 8.2.5. Product portfolio

    • 8.3. F. Hoffmann-La Roche Ltd.

      • 8.3.1. Company overview

      • 8.3.2. Key Executives

      • 8.3.3. Company snapshot

      • 8.3.4. Operating business segments

      • 8.3.5. Product portfolio

      • 8.3.6. Business performance

      • 8.3.7. Key strategic moves and developments

    • 8.4. General Electric

      • 8.4.1. Company overview

      • 8.4.2. Key Executives

      • 8.4.3. Company snapshot

      • 8.4.4. Operating business segments

      • 8.4.5. Product portfolio

      • 8.4.6. Business performance

      • 8.4.7. Key strategic moves and developments

    • 8.5. Aadi Bioscience, Inc.

      • 8.5.1. Company overview

      • 8.5.2. Key Executives

      • 8.5.3. Company snapshot

      • 8.5.4. Operating business segments

      • 8.5.5. Product portfolio

      • 8.5.6. Business performance

      • 8.5.7. Key strategic moves and developments

    • 8.6. Illumina, Inc.

      • 8.6.1. Company overview

      • 8.6.2. Key Executives

      • 8.6.3. Company snapshot

      • 8.6.4. Operating business segments

      • 8.6.5. Product portfolio

      • 8.6.6. Business performance

      • 8.6.7. Key strategic moves and developments

    • 8.7. Qiagen NV.

      • 8.7.1. Company overview

      • 8.7.2. Key Executives

      • 8.7.3. Company snapshot

      • 8.7.4. Operating business segments

      • 8.7.5. Product portfolio

      • 8.7.6. Business performance

      • 8.7.7. Key strategic moves and developments

    • 8.8. Novartis AG

      • 8.8.1. Company overview

      • 8.8.2. Key Executives

      • 8.8.3. Company snapshot

      • 8.8.4. Operating business segments

      • 8.8.5. Product portfolio

      • 8.8.6. Business performance

    • 8.9. Thermo Fisher Scientific Inc.

      • 8.9.1. Company overview

      • 8.9.2. Key Executives

      • 8.9.3. Company snapshot

      • 8.9.4. Operating business segments

      • 8.9.5. Product portfolio

      • 8.9.6. Business performance

    • 8.10. Bristol-Myers Squibb Company

      • 8.10.1. Company overview

      • 8.10.2. Key Executives

      • 8.10.3. Company snapshot

      • 8.10.4. Operating business segments

      • 8.10.5. Product portfolio

      • 8.10.6. Business performance

  • LIST OF TABLES

  • TABLE 01. GLOBAL PERSONALIZED CANCER MEDICINE MARKET, BY PRODUCT, 2022-2032 ($BILLION)
    TABLE 02. PERSONALIZED CANCER MEDICINE MARKET FOR PERSONALIZED MEDICINE THERAPEUTICS, BY REGION, 2022-2032 ($BILLION)
    TABLE 03. PERSONALIZED CANCER MEDICINE MARKET FOR PERSONALIZED MEDICINE DIAGNOSTICS, BY REGION, 2022-2032 ($BILLION)
    TABLE 04. GLOBAL PERSONALIZED CANCER MEDICINE MARKET, BY END USER, 2022-2032 ($BILLION)
    TABLE 05. PERSONALIZED CANCER MEDICINE MARKET FOR HOSPITALS AND CLINICS, BY REGION, 2022-2032 ($BILLION)
    TABLE 06. PERSONALIZED CANCER MEDICINE MARKET FOR OTHERS, BY REGION, 2022-2032 ($BILLION)
    TABLE 07. PERSONALIZED CANCER MEDICINE MARKET, BY REGION, 2022-2032 ($BILLION)
    TABLE 08. NORTH AMERICA PERSONALIZED CANCER MEDICINE MARKET, BY PRODUCT, 2022-2032 ($BILLION)
    TABLE 09. NORTH AMERICA PERSONALIZED CANCER MEDICINE MARKET, BY END USER, 2022-2032 ($BILLION)
    TABLE 10. NORTH AMERICA PERSONALIZED CANCER MEDICINE MARKET, BY COUNTRY, 2022-2032 ($BILLION)
    TABLE 11. U.S. PERSONALIZED CANCER MEDICINE MARKET, BY PRODUCT, 2022-2032 ($BILLION)
    TABLE 12. U.S. PERSONALIZED CANCER MEDICINE MARKET, BY END USER, 2022-2032 ($BILLION)
    TABLE 13. CANADA PERSONALIZED CANCER MEDICINE MARKET, BY PRODUCT, 2022-2032 ($BILLION)
    TABLE 14. CANADA PERSONALIZED CANCER MEDICINE MARKET, BY END USER, 2022-2032 ($BILLION)
    TABLE 15. MEXICO PERSONALIZED CANCER MEDICINE MARKET, BY PRODUCT, 2022-2032 ($BILLION)
    TABLE 16. MEXICO PERSONALIZED CANCER MEDICINE MARKET, BY END USER, 2022-2032 ($BILLION)
    TABLE 17. EUROPE PERSONALIZED CANCER MEDICINE MARKET, BY PRODUCT, 2022-2032 ($BILLION)
    TABLE 18. EUROPE PERSONALIZED CANCER MEDICINE MARKET, BY END USER, 2022-2032 ($BILLION)
    TABLE 19. EUROPE PERSONALIZED CANCER MEDICINE MARKET, BY COUNTRY, 2022-2032 ($BILLION)
    TABLE 20. GERMANY PERSONALIZED CANCER MEDICINE MARKET, BY PRODUCT, 2022-2032 ($BILLION)
    TABLE 21. GERMANY PERSONALIZED CANCER MEDICINE MARKET, BY END USER, 2022-2032 ($BILLION)
    TABLE 22. FRANCE PERSONALIZED CANCER MEDICINE MARKET, BY PRODUCT, 2022-2032 ($BILLION)
    TABLE 23. FRANCE PERSONALIZED CANCER MEDICINE MARKET, BY END USER, 2022-2032 ($BILLION)
    TABLE 24. UK PERSONALIZED CANCER MEDICINE MARKET, BY PRODUCT, 2022-2032 ($BILLION)
    TABLE 25. UK PERSONALIZED CANCER MEDICINE MARKET, BY END USER, 2022-2032 ($BILLION)
    TABLE 26. ITALY PERSONALIZED CANCER MEDICINE MARKET, BY PRODUCT, 2022-2032 ($BILLION)
    TABLE 27. ITALY PERSONALIZED CANCER MEDICINE MARKET, BY END USER, 2022-2032 ($BILLION)
    TABLE 28. SPAIN PERSONALIZED CANCER MEDICINE MARKET, BY PRODUCT, 2022-2032 ($BILLION)
    TABLE 29. SPAIN PERSONALIZED CANCER MEDICINE MARKET, BY END USER, 2022-2032 ($BILLION)
    TABLE 30. REST OF EUROPE PERSONALIZED CANCER MEDICINE MARKET, BY PRODUCT, 2022-2032 ($BILLION)
    TABLE 31. REST OF EUROPE PERSONALIZED CANCER MEDICINE MARKET, BY END USER, 2022-2032 ($BILLION)
    TABLE 32. ASIA-PACIFIC PERSONALIZED CANCER MEDICINE MARKET, BY PRODUCT, 2022-2032 ($BILLION)
    TABLE 33. ASIA-PACIFIC PERSONALIZED CANCER MEDICINE MARKET, BY END USER, 2022-2032 ($BILLION)
    TABLE 34. ASIA-PACIFIC PERSONALIZED CANCER MEDICINE MARKET, BY COUNTRY, 2022-2032 ($BILLION)
    TABLE 35. JAPAN PERSONALIZED CANCER MEDICINE MARKET, BY PRODUCT, 2022-2032 ($BILLION)
    TABLE 36. JAPAN PERSONALIZED CANCER MEDICINE MARKET, BY END USER, 2022-2032 ($BILLION)
    TABLE 37. CHINA PERSONALIZED CANCER MEDICINE MARKET, BY PRODUCT, 2022-2032 ($BILLION)
    TABLE 38. CHINA PERSONALIZED CANCER MEDICINE MARKET, BY END USER, 2022-2032 ($BILLION)
    TABLE 39. AUSTRALIA PERSONALIZED CANCER MEDICINE MARKET, BY PRODUCT, 2022-2032 ($BILLION)
    TABLE 40. AUSTRALIA PERSONALIZED CANCER MEDICINE MARKET, BY END USER, 2022-2032 ($BILLION)
    TABLE 41. REST OF ASIA-PACIFIC PERSONALIZED CANCER MEDICINE MARKET, BY PRODUCT, 2022-2032 ($BILLION)
    TABLE 42. REST OF ASIA-PACIFIC PERSONALIZED CANCER MEDICINE MARKET, BY END USER, 2022-2032 ($BILLION)
    TABLE 43. LAMEA PERSONALIZED CANCER MEDICINE MARKET, BY PRODUCT, 2022-2032 ($BILLION)
    TABLE 44. LAMEA PERSONALIZED CANCER MEDICINE MARKET, BY END USER, 2022-2032 ($BILLION)
    TABLE 45. LAMEA PERSONALIZED CANCER MEDICINE MARKET, BY COUNTRY, 2022-2032 ($BILLION)
    TABLE 46. LATIN AMERICA PERSONALIZED CANCER MEDICINE MARKET, BY PRODUCT, 2022-2032 ($BILLION)
    TABLE 47. LATIN AMERICA PERSONALIZED CANCER MEDICINE MARKET, BY END USER, 2022-2032 ($BILLION)
    TABLE 48. MIDDLE EAST AND AFRICA PERSONALIZED CANCER MEDICINE MARKET, BY PRODUCT, 2022-2032 ($BILLION)
    TABLE 49. MIDDLE EAST AND AFRICA PERSONALIZED CANCER MEDICINE MARKET, BY END USER, 2022-2032 ($BILLION)
    TABLE 50. ABBOTT LABORATORIES: KEY EXECUTIVES
    TABLE 51. ABBOTT LABORATORIES: COMPANY SNAPSHOT
    TABLE 52. ABBOTT LABORATORIES: PRODUCT SEGMENTS
    TABLE 53. ABBOTT LABORATORIES: PRODUCT PORTFOLIO
    TABLE 54. ARIEL PRECISION MEDICINE, INC.: KEY EXECUTIVES
    TABLE 55. ARIEL PRECISION MEDICINE, INC.: COMPANY SNAPSHOT
    TABLE 56. ARIEL PRECISION MEDICINE, INC.: PRODUCT SEGMENTS
    TABLE 57. ARIEL PRECISION MEDICINE, INC.: PRODUCT PORTFOLIO
    TABLE 58. F. HOFFMANN-LA ROCHE LTD.: KEY EXECUTIVES
    TABLE 59. F. HOFFMANN-LA ROCHE LTD.: COMPANY SNAPSHOT
    TABLE 60. F. HOFFMANN-LA ROCHE LTD.: PRODUCT SEGMENTS
    TABLE 61. F. HOFFMANN-LA ROCHE LTD.: PRODUCT PORTFOLIO
    TABLE 62. F. HOFFMANN-LA ROCHE LTD.: KEY STRATERGIES
    TABLE 63. GENERAL ELECTRIC: KEY EXECUTIVES
    TABLE 64. GENERAL ELECTRIC: COMPANY SNAPSHOT
    TABLE 65. GENERAL ELECTRIC: SERVICE SEGMENTS
    TABLE 66. GENERAL ELECTRIC: PRODUCT PORTFOLIO
    TABLE 67. GENERAL ELECTRIC: KEY STRATERGIES
    TABLE 68. AADI BIOSCIENCE, INC.: KEY EXECUTIVES
    TABLE 69. AADI BIOSCIENCE, INC.: COMPANY SNAPSHOT
    TABLE 70. AADI BIOSCIENCE, INC.: PRODUCT SEGMENTS
    TABLE 71. AADI BIOSCIENCE, INC.: PRODUCT PORTFOLIO
    TABLE 72. AADI BIOSCIENCE, INC.: KEY STRATERGIES
    TABLE 73. ILLUMINA, INC.: KEY EXECUTIVES
    TABLE 74. ILLUMINA, INC.: COMPANY SNAPSHOT
    TABLE 75. ILLUMINA, INC.: PRODUCT SEGMENTS
    TABLE 76. ILLUMINA, INC.: PRODUCT PORTFOLIO
    TABLE 77. ILLUMINA, INC.: KEY STRATERGIES
    TABLE 78. QIAGEN NV.: KEY EXECUTIVES
    TABLE 79. QIAGEN NV.: COMPANY SNAPSHOT
    TABLE 80. QIAGEN NV.: PRODUCT SEGMENTS
    TABLE 81. QIAGEN NV.: PRODUCT PORTFOLIO
    TABLE 82. QIAGEN NV.: KEY STRATERGIES
    TABLE 83. NOVARTIS AG: KEY EXECUTIVES
    TABLE 84. NOVARTIS AG: COMPANY SNAPSHOT
    TABLE 85. NOVARTIS AG: PRODUCT SEGMENTS
    TABLE 86. NOVARTIS AG: PRODUCT PORTFOLIO
    TABLE 87. THERMO FISHER SCIENTIFIC INC.: KEY EXECUTIVES
    TABLE 88. THERMO FISHER SCIENTIFIC INC.: COMPANY SNAPSHOT
    TABLE 89. THERMO FISHER SCIENTIFIC INC.: PRODUCT SEGMENTS
    TABLE 90. THERMO FISHER SCIENTIFIC INC.: PRODUCT PORTFOLIO
    TABLE 91. BRISTOL-MYERS SQUIBB COMPANY: KEY EXECUTIVES
    TABLE 92. BRISTOL-MYERS SQUIBB COMPANY: COMPANY SNAPSHOT
    TABLE 93. BRISTOL-MYERS SQUIBB COMPANY: PRODUCT SEGMENTS
    TABLE 94. BRISTOL-MYERS SQUIBB COMPANY: PRODUCT PORTFOLIO
  • LIST OF FIGURES

  • FIGURE 01. PERSONALIZED CANCER MEDICINE MARKET, 2022-2032
    FIGURE 02. SEGMENTATION OF PERSONALIZED CANCER MEDICINE MARKET, 2022-2032
    FIGURE 03. TOP INVESTMENT POCKETS IN PERSONALIZED CANCER MEDICINE MARKET (2023-2032)
    FIGURE 04. HIGH BARGAINING POWER OF SUPPLIERS
    FIGURE 05. LOW THREAT OF NEW ENTRANTS
    FIGURE 06. LOW THREAT OF SUBSTITUTES
    FIGURE 07. MODERATE INTENSITY OF RIVALRY
    FIGURE 08. MODERATE BARGAINING POWER OF BUYERS
    FIGURE 09. DRIVERS, RESTRAINTS AND OPPORTUNITIES: GLOBALPERSONALIZED CANCER MEDICINE MARKET
    FIGURE 09. PERSONALIZED CANCER MEDICINE MARKET, BY PRODUCT, 2022(%)
    FIGURE 10. COMPARATIVE SHARE ANALYSIS OF PERSONALIZED CANCER MEDICINE MARKET FOR PERSONALIZED MEDICINE THERAPEUTICS, BY COUNTRY 2022 AND 2032(%)
    FIGURE 11. COMPARATIVE SHARE ANALYSIS OF PERSONALIZED CANCER MEDICINE MARKET FOR PERSONALIZED MEDICINE DIAGNOSTICS, BY COUNTRY 2022 AND 2032(%)
    FIGURE 12. PERSONALIZED CANCER MEDICINE MARKET, BY END USER, 2022(%)
    FIGURE 13. COMPARATIVE SHARE ANALYSIS OF PERSONALIZED CANCER MEDICINE MARKET FOR HOSPITALS AND CLINICS, BY COUNTRY 2022 AND 2032(%)
    FIGURE 14. COMPARATIVE SHARE ANALYSIS OF PERSONALIZED CANCER MEDICINE MARKET FOR OTHERS, BY COUNTRY 2022 AND 2032(%)
    FIGURE 15. PERSONALIZED CANCER MEDICINE MARKET BY REGION, 2022
    FIGURE 16. U.S. PERSONALIZED CANCER MEDICINE MARKET, 2022-2032 ($BILLION)
    FIGURE 17. CANADA PERSONALIZED CANCER MEDICINE MARKET, 2022-2032 ($BILLION)
    FIGURE 18. MEXICO PERSONALIZED CANCER MEDICINE MARKET, 2022-2032 ($BILLION)
    FIGURE 19. GERMANY PERSONALIZED CANCER MEDICINE MARKET, 2022-2032 ($BILLION)
    FIGURE 20. FRANCE PERSONALIZED CANCER MEDICINE MARKET, 2022-2032 ($BILLION)
    FIGURE 21. UK PERSONALIZED CANCER MEDICINE MARKET, 2022-2032 ($BILLION)
    FIGURE 22. ITALY PERSONALIZED CANCER MEDICINE MARKET, 2022-2032 ($BILLION)
    FIGURE 23. SPAIN PERSONALIZED CANCER MEDICINE MARKET, 2022-2032 ($BILLION)
    FIGURE 24. REST OF EUROPE PERSONALIZED CANCER MEDICINE MARKET, 2022-2032 ($BILLION)
    FIGURE 25. JAPAN PERSONALIZED CANCER MEDICINE MARKET, 2022-2032 ($BILLION)
    FIGURE 26. CHINA PERSONALIZED CANCER MEDICINE MARKET, 2022-2032 ($BILLION)
    FIGURE 27. AUSTRALIA PERSONALIZED CANCER MEDICINE MARKET, 2022-2032 ($BILLION)
    FIGURE 28. REST OF ASIA-PACIFIC PERSONALIZED CANCER MEDICINE MARKET, 2022-2032 ($BILLION)
    FIGURE 29. LATIN AMERICA PERSONALIZED CANCER MEDICINE MARKET, 2022-2032 ($BILLION)
    FIGURE 30. MIDDLE EAST AND AFRICA PERSONALIZED CANCER MEDICINE MARKET, 2022-2032 ($BILLION)
    FIGURE 31. TOP WINNING STRATEGIES, BY YEAR
    FIGURE 32. TOP WINNING STRATEGIES, BY DEVELOPMENT
    FIGURE 33. TOP WINNING STRATEGIES, BY COMPANY
    FIGURE 34. PRODUCT MAPPING OF TOP 10 PLAYERS
    FIGURE 35. COMPETITIVE DASHBOARD
    FIGURE 36. COMPETITIVE HEATMAP: PERSONALIZED CANCER MEDICINE MARKET
    FIGURE 37. TOP PLAYER POSITIONING, 2022
    FIGURE 38. ABBOTT LABORATORIES: NET SALES, 2020-2022 ($MILLION)
    FIGURE 39. ABBOTT LABORATORIES: REVENUE SHARE BY SEGMENT, 2022 (%)
    FIGURE 40. ABBOTT LABORATORIES: REVENUE SHARE BY REGION, 2022 (%)
    FIGURE 41. F. HOFFMANN-LA ROCHE LTD.: SALES REVENUE, 2020-2022 ($MILLION)
    FIGURE 42. F. HOFFMANN-LA ROCHE LTD.: REVENUE SHARE BY SEGMENT, 2022 (%)
    FIGURE 43. GENERAL ELECTRIC: NET REVENUE, 2020-2022 ($MILLION)
    FIGURE 44. GENERAL ELECTRIC: REVENUE SHARE BY SEGMENT, 2022 (%)
    FIGURE 45. GENERAL ELECTRIC: REVENUE SHARE BY REGION, 2022 (%)
    FIGURE 46. AADI BIOSCIENCE, INC.: NET REVENUE, 2020-2022 ($MILLION)
    FIGURE 47. ILLUMINA, INC.: NET REVENUE, 2020-2022 ($MILLION)
    FIGURE 48. ILLUMINA, INC.: REVENUE SHARE BY SEGMENT, 2022 (%)
    FIGURE 49. ILLUMINA, INC.: REVENUE SHARE BY REGION, 2022 (%)
    FIGURE 50. QIAGEN NV.: NET REVENUE, 2020-2022 ($MILLION)
    FIGURE 51. QIAGEN NV.: REVENUE SHARE BY REGION, 2022 (%)
    FIGURE 52. QIAGEN NV.: REVENUE SHARE BY SEGMENT, 2022 (%)
    FIGURE 53. NOVARTIS AG: NET SALES, 2020-2022 ($MILLION)
    FIGURE 54. NOVARTIS AG: REVENUE SHARE BY SEGMENT, 2022 (%)
    FIGURE 55. NOVARTIS AG: REVENUE SHARE BY REGION, 2022 (%)
    FIGURE 56. THERMO FISHER SCIENTIFIC INC.: NET REVENUE, 2020-2022 ($MILLION)
    FIGURE 57. THERMO FISHER SCIENTIFIC INC.: REVENUE SHARE BY SEGMENT, 2022 (%)
    FIGURE 58. THERMO FISHER SCIENTIFIC INC.: REVENUE SHARE BY REGION, 2021 (%)
    FIGURE 59. BRISTOL-MYERS SQUIBB COMPANY: NET REVENUE, 2020-2022 ($MILLION)
    FIGURE 60. BRISTOL-MYERS SQUIBB COMPANY: REVENUE SHARE BY REGION, 2022 (%)


PURCHASE OPTIONS

Call or Email us

U.S.-Canada Toll-free: +1-800-792-5285
Int'l : +1-503-894-6022
Europe : +44-845-528-1300
Email : help@alliedmarketresearch.com
 
FREQUENTLY ASKED QUESTIONS?

A. Personalized cancer medicine refers to an approach in oncology that utilizes individualized information about a patient's tumor characteristics, genetic makeup, and biomarkers to guide the selection of treatment strategies. It involves tailoring cancer therapies to the specific needs of each patient, with the aim of maximizing treatment effectiveness while minimizing adverse effects.

A. The major factor that fuels the growth of the personalized cancer medicine market are rise in prevalence of cancer, increase in demand for ideal therapeutics for treatment and rise in adoption of Artificial Intelligence (AI) based diagnosis drive the growth of the global personalized cancer medicine market.

A. The personalized Medicine Diagnostics segment is the most influencing segment in personalized cancer medicine market owing to advancements in genomic technologies, growing collaborations between diagnostic companies, pharmaceutical companies, and academic institutions, regulatory support, and the increasing demand for personalized treatment approaches.

A. Top companies such as F. Hoffmann-la Roche Ltd, Illumina, Inc. , Qiagen NV. and General Electric held a high market position in 2022. These key players held a high market postion owing to the strong geographical foothold in North America, Europe, Asia-Pacific, and LAMEA.

A. The market value of personalized cancer medicine market in 2032 is $507.23 billion

A. The base year is 2022 in personalized cancer medicine market.

A. The total market value of personalized cancer medicine market is $179.99 billion in 2022.

A. The forecast period for personalized cancer medicine market is 2023 to 2032

Looking for Customization?

 Customization Request

Have a Question?

 Speak with Analyst

Any Confusion?

 Inquire Before Buying

Have a glance of the Report

  Request Sample
RELATED TAGS

Purchase Full Report of
Personalized Cancer Medicine Market

Start reading instantly.
This Report and over 66,905+ more Reports, Available with Avenue Library. T&C*.

  • Online Only
  • $3,570
  • Online cloud access only
  • Restricted print, copy, paste & download
  • Read only
  • Free industry update
    (Within 180 days)
  • Free report update in next update cycle
    (Jun 2024 - Jun 2025)
  • Data Pack
  • $3,840
  • Restricted to one authorized user
  • One print only
  • Available in
    Excel
  • Free industry update
    (Within 180 days)
  •   Free report update in next update cycle
    (Jun 2024 - Jun 2025)
  • Single User
  • $5,730
  • Restricted to one authorized user
  • One print only
  • Available in
    PDF
  • Free industry update
    (Within 180 days)
  •   Free report update in next update cycle
    (Jun 2024 - Jun 2025)
  • Five Users
  • $6,450
  • Limited to five authorized users
  • Print upto five copies
  • Available in
    PDF
  • Free industry update
    (Within 180 days)
  •   Free report update in next update cycle
    (Jun 2024 - Jun 2025)
  • Enterprise
    License/PDF

  • $9,600
  • Unlimited
    within
    company/enterprise
  • Available in Excel & PDF
  • Free industry update
    (Within 180 days)
  •   Free report update in next update cycle
    (Jun 2024 - Jun 2025)
  • Library
    Membership

  • $999 $ 1,175
    Per User/ Per month/ Billed annually
  • Published Content
    E-access
  • Company Profiles
    E-access
  • Newly Added Content Access
  • 10 PDF
    Downloads
  • 5 Excel Data
    Pack Downloads
  • 250 Company Profiles PDF Downloads
  • Buy Now

*Taxes/Fees, if applicable will be added during checkout. All prices in USD

RELATED REPORTS
 

Why Allied Market Research?


Infallible Methodology

To ensure high-level data integrity, accurate analysis, and impeccable forecasts

Analyst Support

For complete satisfaction

Customization

On-demand customization of scope of the report to exactly meet your needs

TARGETED MARKET VIEW

Targeted market view to provide pertinent information and save time of readers

Get fresh content delivered

Get insights on topics that are crucial for your business. Stay abreast of your interest areas.

Get Industry Data Alerts

Why Allied Market Research?

Infallible Methodology

To ensure high-level data integrity, accurate analysis, and impeccable forecasts

Analyst Support

For complete satisfaction

Customization

On-demand customization of scope of the report to exactly meet your needs

TARGETED MARKET VIEW

Targeted market view to provide pertinent information and save time of readers