
Pharmaceutical Suppositories Market Research, 2035
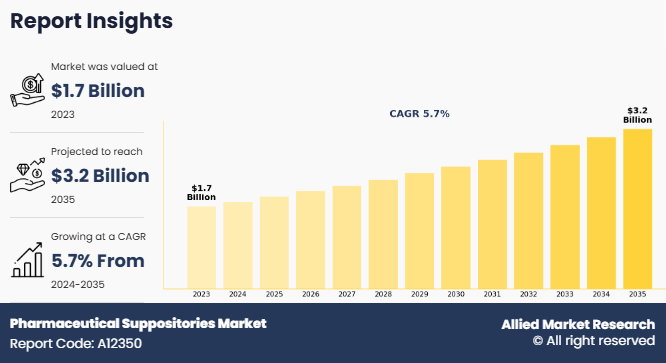
The global pharmaceutical suppositories market size was valued at $1.7 billion in 2023, and is projected to reach $3.2 billion by 2035, growing at a CAGR of 5.7% from 2024 to 2035. Rise in prevalence of acute and chronic disorders, increase in the geriatric population, increase in initiatives for awareness and education for use of suppositories drive the growth of the pharmaceutical suppositories market. According to an article published by National Library of Medicine, in September 2023, the rising incidence of IBD is propelled by pediatric-onset IBD, which is rising by 1.23% per year from 15.6 per 100,000 in 2023 to 18.0 per 100,000 in 2035. This rising trend presents significant growth opportunities for pharmaceutical companies, encouraging the development of new suppository formulations to meet the needs of individuals with chronic diseases.
Pharmaceutical suppositories are solid dosage forms designed for insertion into body cavities, where they dissolve or melt to release active ingredients. They are commonly formulated using a base material such as cocoa butter, glycerinated gelatin, or polyethylene glycol (PEG) and others, which provides stability and enables controlled drug release. The manufacturing process involves melting the base, mixing it with the active pharmaceutical ingredient (API) and any necessary excipients, and then molding the mixture into the desired shape. Once cooled, the suppositories solidify and are packaged for use. Suppositories are designed to deliver medication via mucosal absorption.
Key Takeaways
- On the basis of type, the rectal suppositories segment dominated the market in terms of revenue in 2023. However, the vaginal suppositories segment is anticipated to grow at the fastest CAGR during the forecast period.
- As per base, the emulsifying bases segment held largest market share in 2023 and is expected to remain dominant throughout the forecast period.
- Depending on prescription type, the prescribed suppositories segment held the largest market share in 2023. However, the OTC segment is anticipated to grow at the fastest CAGR during the forecast period.
- On the basis of therapeutic application, the analgesics and anti-inflammatory drugs segment held the largest market share in 2023. However, the hormonal therapies segment is anticipated to grow at the fastest CAGR during the forecast period.
- On the basis of fill volume categories, the medium fill volumes segment held the largest market share in 2023. However, the small fill volumes segment is anticipated to grow at the fastest CAGR during the forecast period.
- According to age group, the adult use segment held the largest market share in 2023. However, the pediatric use segment is anticipated to grow at the fastest CAGR during the forecast period.
- On the basis of distribution channel, the hospital pharmacies segment dominated the market in terms of revenue in 2023. However, the online providers segment is anticipated to grow at the fastest CAGR during the forecast period.
- On the basis of end user, the hospitals & clinics segment held the largest market share in 2023. However, the home care segment is anticipated to grow at the fastest CAGR during the forecast period.
- Region wise, North America generated the largest revenue in 2023. However, Asia-Pacific is anticipated to grow at the highest CAGR during the forecast period.
Market Dynamics
The growing geriatric population is a major driver for the increased demand for pharmaceutical suppositories which further drive the pharmaceutical suppositories market growth. As people age, they commonly experience a decline in muscle function, including weakened digestive tract muscles, leading to conditions such as constipation, inflammatory bowel disease (IBD), and hemorrhoids. These issues often make it difficult for elderly individuals to rely on oral medications, as swallowing pills becomes challenging, and digestive systems may not efficiently absorb drugs. Suppositories offer an effective alternative by delivering medications directly through mucosal absorption, bypassing the gastrointestinal tract. This is particularly beneficial for seniors, ensuring proper drug administration and absorption without the complications associated with oral medications.
Moreover, suppositories are well-suited for localized treatments, which are frequently required for managing conditions common in the elderly, such as chronic constipation, hemorrhoids, and localized pain. The targeted nature of suppository-based treatments allows for precise dosage delivery, reducing the risk of side effects and ensuring optimal therapeutic effects which increases its adoption and drive the gowth of pharmaceutical suppositories market size.
The aging global population, as highlighted by the WHO, which projects that 1 in 6 people will be aged 60 or older by 2030, further underscores the growing demand for suppository-based treatments. Pharmaceutical companies are increasingly focusing on developing products tailored to meet the specific needs of elderly patients.
Additionally, government initiatives and healthcare guidelines that promote early diagnosis and treatment of conditions benefiting from localized drug delivery, such as gastrointestinal disorders and infections, are driving the adoption of suppositories and drive pharmaceutical suppositories market growth. These efforts streamline treatment options, making suppositories a preferred choice when oral medications are ineffective or less feasible.
Segmental Overview
The pharmaceutical suppositories industry is segmented into type, base, prescription type, therapeutic application, fill volume categories, age group, distribution channel, end user, and region. On the basis of type, the market is divided into rectal suppositories, vaginal suppositories and urethral suppositories. According to base, it is classified into fatty base, water miscible bases, and emulsifying bases. The water miscible bases are further segmented into glycero gelatin base, soap glycerin suppositories, and polyethylene glycol bases. The emulsifying bases are further segmented into witepsol, massa esterium, and massuppol. On the basis of prescription type, it is bifurcated into OTC and prescribed suppositories.
Depending on therapeutic application, it is categorized into analgesics and anti-inflammatory drugs, antiemetics, laxatives, hormonal therapies, antifungals and antibacterials, and others. As per fill volume categories, it is divided into small fill volumes, medium fill volumes, and large fill volumes. On the basis of age group, it is bifurcated into pediatric use and adult use. On the basis of distribution channel, the market is divided into hospital pharmacies, retail pharmacies and online sales. On the basis of end user, the market is categorized into hospitals and clinics, home care, and others. Region wise, the market is analyzed across North America, Europe, Asia-Pacific, and LAMEA.
By Type
On the basis of type, the rectal suppository segment was the largest revenue contributor to the market in 2023. This is attributed to its versatility, efficacy, and the broad spectrum of medical conditions it addresses. In addition, ongoing research and healthcare provider recommendations contribute to its sustained growth during pharmaceutical suppositories market forecast.
The vaginal suppositories segment is expected to register the fastest growth during the forecast period. This is attributed to the increase in adoption of gynecological and health applications for women. Vaginal suppositories offer localized drug delivery for conditions such as vaginal infections and hormone therapy, resulting in quick, effective treatment while minimizing systemic side effects.

By Base
By base, the emulsifying bases segment was the highest revenue contributor to the market in 2023 and is expected to remain dominant during the forecast period. This is attributed to its versatility in formulating various suppository types. Emulsifying bases are well-suited for a wide range of drug compatibility and release profiles, making them the preferred choice for pharmaceutical suppository formulations.

By Prescription Type
On the basis of prescription type, the prescribed suppositories segment was the highest revenue contributor to the market in 2023. This is attributed to the rising prevalence of chronic diseases and the demand for targeted drug delivery solutions. Additionally, advancements in pharmaceutical formulations and precision medicine allow for personalized prescriptions tailored to individual patient needs, further driving growth in this segment.
The OTC segment is expected to register the fastest growth during the forecast period owing to a growing consumer inclination toward self-care and convenience. OTC products are readily available without a prescription, providing an accessible and cost-effective option for managing common health issue.

By Therapeutic Application
On the basis of therapeutic application, the analgesics and anti-inflammatory drugs segment was the largest revenue contributor to the market in 2023. This growth is attributed to the increasing prevalence of pain management needs, particularly among
patients with conditions like hemorrhoids and cancer, where localized delivery offers effective relief and minimizes systemic side effects.
The hormonal therapies segment is expected to register the fastest growth during the forecast period owing to rising cases of hormonal imbalances and related disorders, such as menopause and fertility issues. In addition, increased awareness and acceptance of hormone replacement therapy are further driving the segment growth.

By Fill Volume Category
By Fill Volume Category, the medium fill volumes segment was the largest revenue contributor to the market in 2023 and is expected to register the fastest growth during the forecast period. Medium fill volume suppositories are neither too small nor too large, making them easy to handle and administer. This size is particularly advantageous for patients, as it enhances comfort and compliance. Additionally, the availability of multiple formulations within this size range caters to various therapeutic needs, further driving segment growth as healthcare providers and patients increasingly opt for these versatile options.

By Age Group
By Age Group, the adult use segment was the largest revenue contributor to the market in 2023. This growth is attributed to the growing acceptance of suppositories for addressing various health conditions, particularly pain management and gastrointestinal disorders. Moreover, advancements in formulation technology and the availability of a wider range of effective products specifically designed for adults have increased their appeal, leading to greater market penetration and sales.
The pediatric use segment is expected to register the fastest growth during the forecasted period owing to several key factors. Increasing awareness among healthcare providers and parents about the benefits of suppositories for children, especially for those who struggle with oral medication, is driving this trend.

By Distribution Channel
By distribution channel, the hospital pharmacies segment held largest pharmaceutical suppositories market share in 2023 owing to several factors. Hospitals commonly employ suppositories for targeted drug delivery, ensuring precise dosing and minimizing systemic side effects. This growing demand for suppositories within the hospital setting, is driven by diverse medical conditions and treatment needs.
However, the online providers segment is expected to register the fastest growth during the forecast period owing to its convenience and accessibility. It offers discreet purchasing options, which appeal to consumers seeking privacy for sensitive products like suppositories.

By End User
By end user, the hospitals and clinics segment was the largest revenue contributor to the market in 2023. Hospitals & clinics have increasingly showed an inclination toward pharmaceutical suppositories products. Moreover, a rise in number of government initiatives to ensure a high degree chronic disease treatment measure, and surge in number of hospitals with increased use of suppository therapy boost the growth of the hospitals & clinics segment.
However, the home care segment is expected to register the fastest growth during the forecast period. Patients increasingly prefer home-based healthcare, driving demand for user-friendly drug delivery methods like suppositories. In addition, the growing aging population and the trend toward self-administration boost the growth of the segment. Cosmetic suppositories, offering skin-nourishing benefits, further contribute to the popularity of home care treatments, enhancing convenience and accessibility.

By Region
Region wise, North America held largest pharmaceutical suppositories market share in 2023, owing to increase in well-developed healthcare industry, presence of leading manufacturers in the region, and high adoption rate of suppositories in this region.
However, Asia-Pacific is anticipated to register the highest CAGR during the forecast period owing to increase in number of geriatric populations, rise in people suffering from constipation and hemorrhoids, and improving healthcare infrastructure in the region.

Competition Analysis
Competitive analysis and profiles of the major players in the pharmaceutical suppositories industry include Zydus Group, Bayer AG, Church & Dwight Co. Inc, Cosette Pharmaceuticals, Inc., Intas Pharmaceuticals Ltd., Novartis AG, Pfizer Inc., Sanofi S.A, Bliss GVS Pharma Ltd, and Bausch Health Companies Inc. The key players have adopted strategies such as product approval to expand their product portfolio.
Recent Developments in the Pharmaceutical Suppository Industry
- In August 2023, Zydus Lifesciences Limited announced that it has received final approval from the United States Food and Drug Administration (USFDA) to manufacture and market Indomethacin suppositories, 50mg. Zydus' Indomethacin suppositories, 50 mg is the generic version of the Reference Listed Drug (RLD) Indocin suppositories. It has been granted a CGT designation by the USFDA for its Indomethacin suppositories.
Key Benefits For Stakeholders
- This report provides a quantitative analysis of the market segments, current trends, estimations, and dynamics of the pharmaceutical suppositories market analysis from 2023 to 2035 to identify the prevailing pharmaceutical suppositories market opportunity.
- The market research is offered along with information related to key drivers, restraints, and opportunities.
- Porter's five forces analysis highlights the potency of buyers and suppliers to enable stakeholders make profit-oriented business decisions and strengthen their supplier-buyer network.
- In-depth analysis of the pharmaceutical suppositories market segmentation assists to determine the prevailing market opportunities.
- Major countries in each region are mapped according to their revenue contribution to the global market.
- Market player positioning facilitates benchmarking and provides a clear understanding of the present position of the market players.
- The report includes the analysis of the regional as well as global pharmaceutical suppositories market trends, key players, market segments, application areas, and market growth strategies.
Pharmaceutical Suppositories Market Report Highlights
| Aspects | Details |
| Market Size By 2035 | USD 3.2 billion |
| Growth Rate | CAGR of 5.7% |
| Forecast period | 2023 - 2035 |
| Report Pages | 423 |
| By Prescription Type |
|
| By Therapeutic Application |
|
| By Fill Volume Categories |
|
| By Type |
|
| By Age Group |
|
| By Base |
|
| By Distribution Channel |
|
| By End User |
|
| By Region |
|
| Key Market Players | Bausch Health Companies Inc., Bayer AG, Sanofi S.A., Bliss GVS Pharma Ltd, Zydus Lifesciences Limited, Novartis AG, Pfizer Inc., Intas Pharmaceuticals Ltd., Cosette Pharmaceuticals, Inc., Church & Dwight Co. Inc. |
Analyst Review
Pharmaceutical suppositories offer an effective alternative for drug delivery, particularly in cases where patients are unconscious or when direct, localized treatment is required. They emphasize that suppositories provide a practical solution for patients who cannot take oral medications or need immediate, on-site therapeutic action.
Several key factors are expected to drive the market’s growth. The increasing geriatric population, who often face challenges with oral medication intake, coupled with the rising incidence of gastrointestinal diseases globally, is boosting the demand for suppositories. Additionally, the rise in intrauterine diseases and various chronic conditions are contributing to the growing need for this alternative drug delivery method. The increasing use of rectal suppositories and ongoing technological advancements in drug formulations and manufacturing processes are further expected to propel market expansion.
In addition, North America is projected to experience the highest revenue growth due to advanced technological developments, a well-established healthcare infrastructure, and the growing acceptance of suppositories by both patients and healthcare providers. Meanwhile, Asia-Pacific is anticipated to see significant growth due to a rising elderly population and initiatives to enhance healthcare infrastructure in the region, driving the market forward during the forecast period. This regional growth is supported by the expanding healthcare facilities and an increased focus on improving access to pharmaceutical treatments.
Top companies holding the market share in pharmaceutical suppositories include Zydus group, Bayer AG, Church & Dwight Co. Inc, Cosette Pharmaceuticals, Inc., Intas Pharmaceuticals Ltd., Novartis AG, Pfizer Inc., Sanofi S.A, and Bausch Health Companies Inc.
The pharmaceutical suppositories market was valued for $1,668.09 million in 2023 and is estimated to reach $3,239.32 million by 2035, exhibiting a CAGR of 5.7% from 2024 to 2035.
North America is the largest regional market for pharmaceutical suppositories. The region's dominance is attributed to the high prevalence of chronic conditions requiring rectal or vaginal drug delivery, well-established healthcare infrastructure, and strong pharmaceutical research and development activities.
The leading application of the pharmaceutical suppositories market is in analgesics and anti-inflammatory treatments. Suppositories in this segment are widely used to manage pain and inflammation, offering targeted and efficient drug delivery, particularly in cases where oral administration is not feasible due to nausea, vomiting, or gastrointestinal conditions.
The global pharmaceutical suppositories market is witnessing growth driven by advancements in drug delivery technologies, increased prevalence of chronic diseases, and growing demand for pediatric and geriatric-friendly formulations. Trends include the development of heat-stable formulations, enhanced bioavailability, and expanding applications in emerging markets.
Loading Table Of Content...
Loading Research Methodology...

