0
Upcoming Allied Market Research
2023
Photobiostimulation Devices Market

Photobiostimulation Devices Market: Global Opportunity Analysis and Industry Forecast, 2023-2030 Market

Report Code: A10364
Nov 2023 | Pages: NA
Tables: NA
Charts: NA
  • Formats*:

  • pdf

    Single User License, Five User
    License & Enterprise User License

  • xls

    Data Pack Excel License

  • ppt

    It comes with the additional cost
    of $2500.00 contact sales.


COVID-19

Pandemic disrupted the entire world and affected many industries.

Get detailed COVID-19 impact analysis on the Photobiostimulation Devices Market

Request Now !

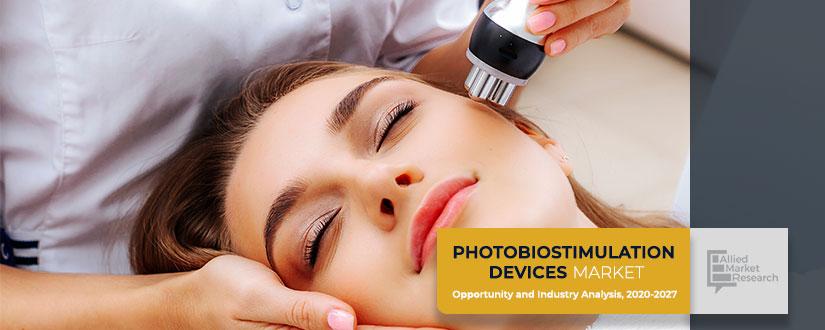
Photobiostimulation Devices Market Outlook - 2027

Photobiostimulation is a low-level light therapy (LLLT) widely used for minimizing inflammation, edema, and pain. This technique uses LEDs to emit light at different wavelengths such as infrared and red light. With help of this light it helps to heal wounds, nerves and deeper tissues and prevents tissue damage. Photobiostimulation devices emit light that stimulates vascularization and internal heat, ensuing in the faster recovery of wounds. The light from the photobiostimulation device affects a protein in the mitochondria of a cell, stimulates ATP production and reduces oxidative stress. As a result, it minimizing inflammation and improving tissue repair. There are various types of photobiostimulation devices are available in the photobiostimulation devices market such as infrared and red light which is categorized on the basis of wavelength they emit. Out of which the Infrared light photobiostimulation devices gain more popularity as compared to red light due to the various advantages of using such as they have shown positive results for increasing vascularization, increases deep thermal, increase in oxygenation, stimulation of the synthesis of new collagen, and improvement in skin elasticity.

Photobiostimulation-Devices-Market

Photobiostimulation devices that emit infrared light are commonly used in some of the pain management clinics and in wound healing. The main objective of manufacturing and develop the market of photobiostimulation devices is to speed up wound healing and reduce the incidences of infection in diabetic foot ulcers, specifically since there is no particular treatment for diabetic foot ulcers. There are various advantages of using photobiostimulation devices includes they are non-invasive in nature and easy to use. Recently this technique is widely used in hair transplantation therapy, where various company provide laser light treatment for hair. The company like “iRestore Laser Corporation” has launched the “iRestore” is a laser used as a hair restoration system intended to treat hereditary hair loss. Photobiostimulation device manufacturers are focusing on developing a mid-600nm red light wavelength, in line with its ability to eliminate 99% contents of a cell within minutes which develop the growth of photobiostimulation device market.

COVID-19 Scenario Analysis:

To take care of infected population the demand for medical supplies is increasing. Respiratory support devices such as atomizer, life-support machine, oxygen generator, and monitor are among the majorly used medical devices in primary clinical treatment. Moreover, COVID-19 has led to a huge surge in demand for medical supplies such as personal protective equipment including masks, gloves, and protective eyeglasses. With rise in number of COVID-19 cases worldwide, the need for medical supplies keeps on rising among, both from healthcare professionals and civil population for precautionary measures. Manufacturers of these products have a chance to capitalize this increased demand of medical supplies to ensure adequate and continuous supply of personal protective equipment in the market.

The ongoing outbreak of COVID-19 pandemic impacted the photobiostimulation market. It impacted on the Since the Coronavirus outbreak reached the pandemic status, the entire global supply chain has been impacted, leading the disruption in logistic capabilities and production capacity. Market player and end user losses their business due to the temporarily shutting down of industries in various region. In this situation photobiostimulation associated treatment is stopped.

Top impacting factors: Market Scenario Analysis, Trends, Drivers and Impact Analysis:

Globally, North America is considered as a largest market share and dominate overall photobiostimulation devices market. This is attributed to presence of major market player, increasing awareness among the people regarding advanced technology and surgical procedure. However, Asia Pacific is considered as a second largest market share due to low cost of manufacturing photobiostimulation devices, and there are a number of researches being undertaken.

The factors that drive the growth of photobiostimulation device market such as increasing geriatric population, increasing incidence of chronic diseases, growing trend of non-invasive treatment alternatives, availability of low cost of treatment, are driving the growth of the photobiostimulation devices market. However, the factor that restrain the growth of photobiostimulation device market such as presence of fake products available in the market and stringent government for manufacturing of photobiostimulation devices are relatively lenient, therefore the lesser number of quality products available in the market 

New Product launch to flourish the market:

Major Key market manufacturer have been focusing on increasing research and development activities and producing new product solution for specific applications as there are varying demands based on the utilization. Leading market players have determined how improved accuracy can be influential in many applications. In 2018, “Erchonia Corporation” has received U.S.FDA approval for the “FX 635 Laser” for treating chronic low back pain of musculoskeletal origin. The FX 635 Laser is the only FDA-approved laser in the market for chronic neck and shoulder pain treatment. In 2018, “iRestore Laser Corporation” has launched the “iRestore” is a laser used as a hair restoration system intended to treat androgenic alopecia means “hereditary hair loss”. In 2018, “Erchonia Corporation”, entered into a collaboration with “InnerScope Hearing Technologies”, and launched the “Erchonia 3LT lasers” which is used for the treatment of hearing disorders. 

Key benefits of the report:

  • This study presents the analytical depiction of the global photobiostimulation devices market along with the current trends and future estimations to determine the imminent investment pockets.
  • The report presents information related to key drivers, restraints, and opportunities along with detailed analysis of the global photobiostimulation devices market share.
  • The current market is quantitatively analyzed to highlight the global photobiostimulation devices market growth scenario.
  • Porter’s five forces analysis illustrates the potency of buyers & suppliers in the market. 
  • The report provides a detailed global photobiostimulation devices market analysis based on competitive intensity and how the competition will take shape in coming years. 

Questions answered in the Photobiostimulation Devices Market research report:

  • Who are the leading market players active in photobiostimulation devices market?
  • What are the current trends will influence the market in the next few years?
  • What are the driving factors, restraints, and opportunities in the market?
  • What are the projections for the future that will help in taking further strategic steps?

Photobiostimulation Devices Market: Global Opportunity Analysis and Industry Forecast, 2020–2027 Report Highlights

Aspects Details
By Type
  • Infrared Light
  • Red Light
  • Others
By Application
  • Pain Management
  • Wound Care
  • Cosmetic Applications
  • Other Applications
By   End User
  • Specialty Clinics
  • Research Institutions
By Region
  • North America  (U.S., Canada, Mexico)
  • Europe  (France, Germany, Italy, Spain, UK, Rest of Europe)
  • Asia-Pacific  (China, Japan, India, South Korea, Australia, Rest of Asia-Pacific)
  • LAMEA  (Brazil, South Africa, Saudi Arabia, Rest of LAMEA)
Key Market Players iRestore Laser, TheraDome Inc., Biolight Technologies, Vielight Inc., Bioflex Laser Therapy, Ingeneus Pty. Ltd., THOR Photomedicine Ltd,, LumiWave, Omega Laser Systems, iGrow Laser
 
  • CHAPTER 1: INTRODUCTION

    • 1.1. Report Description

    • 1.2. Key Market Segments

    • 1.3. Key Benefits

    • 1.4. Research Methodology

      • 1.4.1. Primary Research

      • 1.4.2. Secondary Research

      • 1.4.3. Analyst Tools and Models

  • CHAPTER 2: EXECUTIVE SUMMARY

    • 2.1. CXO Perspective

  • CHAPTER 3: MARKET LANDSCAPE

    • 3.1. Market Definition and Scope

    • 3.2. Key Findings

      • 3.2.1. Top Investment Pockets

      • 3.2.2. Top Winning Strategies

    • 3.3. Porter's Five Forces Analysis

      • 3.3.1. Bargaining Power of Suppliers

      • 3.3.2. Threat of New Entrants

      • 3.3.3. Threat of Substitutes

      • 3.3.4. Competitive Rivalry

      • 3.3.5. Bargaining Power among Buyers

    • 3.5. Market Dynamics

      • 3.5.1. Drivers

      • 3.5.2. Restraints

      • 3.5.3. Opportunities

    • 3.6. COVID-19 Impact Analysis

  • CHAPTER 4: PHOTOBIOSTIMULATION DEVICES MARKET, BY TYPE

    • 4.1. Market Overview

      • 4.1.1 Market Size and Forecast, By Type

    • 4.2. Infrared Light

      • 4.2.1. Key Market Trends, Growth Factors and Opportunities

      • 4.2.2. Market Size and Forecast, By Region

      • 4.2.3. Market Share Analysis, By Country

    • 4.3. Red Light

      • 4.3.1. Key Market Trends, Growth Factors and Opportunities

      • 4.3.2. Market Size and Forecast, By Region

      • 4.3.3. Market Share Analysis, By Country

    • 4.4. Others

      • 4.4.1. Key Market Trends, Growth Factors and Opportunities

      • 4.4.2. Market Size and Forecast, By Region

      • 4.4.3. Market Share Analysis, By Country

  • CHAPTER 5: PHOTOBIOSTIMULATION DEVICES MARKET, BY APPLICATION

    • 5.1. Market Overview

      • 5.1.1 Market Size and Forecast, By Application

    • 5.2. Pain Management

      • 5.2.1. Key Market Trends, Growth Factors and Opportunities

      • 5.2.2. Market Size and Forecast, By Region

      • 5.2.3. Market Share Analysis, By Country

    • 5.3. Wound Care

      • 5.3.1. Key Market Trends, Growth Factors and Opportunities

      • 5.3.2. Market Size and Forecast, By Region

      • 5.3.3. Market Share Analysis, By Country

    • 5.4. Cosmetic Applications

      • 5.4.1. Key Market Trends, Growth Factors and Opportunities

      • 5.4.2. Market Size and Forecast, By Region

      • 5.4.3. Market Share Analysis, By Country

    • 5.5. Other Applications

      • 5.5.1. Key Market Trends, Growth Factors and Opportunities

      • 5.5.2. Market Size and Forecast, By Region

      • 5.5.3. Market Share Analysis, By Country

  • CHAPTER 6: PHOTOBIOSTIMULATION DEVICES MARKET, BY   END USER

    • 6.1. Market Overview

      • 6.1.1 Market Size and Forecast, By   End User

    • 6.2. Specialty Clinics

      • 6.2.1. Key Market Trends, Growth Factors and Opportunities

      • 6.2.2. Market Size and Forecast, By Region

      • 6.2.3. Market Share Analysis, By Country

    • 6.3. Research Institutions

      • 6.3.1. Key Market Trends, Growth Factors and Opportunities

      • 6.3.2. Market Size and Forecast, By Region

      • 6.3.3. Market Share Analysis, By Country

  • CHAPTER 7: PHOTOBIOSTIMULATION DEVICES MARKET, BY REGION

    • 7.1. Market Overview

      • 7.1.1 Market Size and Forecast, By Region

    • 7.2. North America

      • 7.2.1. Key Market Trends and Opportunities

      • 7.2.2. Market Size and Forecast, By Type

      • 7.2.3. Market Size and Forecast, By Application

      • 7.2.4. Market Size and Forecast, By   End User

      • 7.2.5. Market Size and Forecast, By Country

      • 7.2.6. U.S. Photobiostimulation Devices Market

        • 7.2.6.1. Market Size and Forecast, By Type
        • 7.2.6.2. Market Size and Forecast, By Application
        • 7.2.6.3. Market Size and Forecast, By   End User
      • 7.2.7. Canada Photobiostimulation Devices Market

        • 7.2.7.1. Market Size and Forecast, By Type
        • 7.2.7.2. Market Size and Forecast, By Application
        • 7.2.7.3. Market Size and Forecast, By   End User
      • 7.2.8. Mexico Photobiostimulation Devices Market

        • 7.2.8.1. Market Size and Forecast, By Type
        • 7.2.8.2. Market Size and Forecast, By Application
        • 7.2.8.3. Market Size and Forecast, By   End User
    • 7.3. Europe

      • 7.3.1. Key Market Trends and Opportunities

      • 7.3.2. Market Size and Forecast, By Type

      • 7.3.3. Market Size and Forecast, By Application

      • 7.3.4. Market Size and Forecast, By   End User

      • 7.3.5. Market Size and Forecast, By Country

      • 7.3.6. France Photobiostimulation Devices Market

        • 7.3.6.1. Market Size and Forecast, By Type
        • 7.3.6.2. Market Size and Forecast, By Application
        • 7.3.6.3. Market Size and Forecast, By   End User
      • 7.3.7. Germany Photobiostimulation Devices Market

        • 7.3.7.1. Market Size and Forecast, By Type
        • 7.3.7.2. Market Size and Forecast, By Application
        • 7.3.7.3. Market Size and Forecast, By   End User
      • 7.3.8. Italy Photobiostimulation Devices Market

        • 7.3.8.1. Market Size and Forecast, By Type
        • 7.3.8.2. Market Size and Forecast, By Application
        • 7.3.8.3. Market Size and Forecast, By   End User
      • 7.3.9. Spain Photobiostimulation Devices Market

        • 7.3.9.1. Market Size and Forecast, By Type
        • 7.3.9.2. Market Size and Forecast, By Application
        • 7.3.9.3. Market Size and Forecast, By   End User
      • 7.3.10. UK Photobiostimulation Devices Market

        • 7.3.10.1. Market Size and Forecast, By Type
        • 7.3.10.2. Market Size and Forecast, By Application
        • 7.3.10.3. Market Size and Forecast, By   End User
      • 7.3.11. Russia Photobiostimulation Devices Market

        • 7.3.11.1. Market Size and Forecast, By Type
        • 7.3.11.2. Market Size and Forecast, By Application
        • 7.3.11.3. Market Size and Forecast, By   End User
      • 7.3.12. Rest Of Europe Photobiostimulation Devices Market

        • 7.3.12.1. Market Size and Forecast, By Type
        • 7.3.12.2. Market Size and Forecast, By Application
        • 7.3.12.3. Market Size and Forecast, By   End User
    • 7.4. Asia-Pacific

      • 7.4.1. Key Market Trends and Opportunities

      • 7.4.2. Market Size and Forecast, By Type

      • 7.4.3. Market Size and Forecast, By Application

      • 7.4.4. Market Size and Forecast, By   End User

      • 7.4.5. Market Size and Forecast, By Country

      • 7.4.6. China Photobiostimulation Devices Market

        • 7.4.6.1. Market Size and Forecast, By Type
        • 7.4.6.2. Market Size and Forecast, By Application
        • 7.4.6.3. Market Size and Forecast, By   End User
      • 7.4.7. Japan Photobiostimulation Devices Market

        • 7.4.7.1. Market Size and Forecast, By Type
        • 7.4.7.2. Market Size and Forecast, By Application
        • 7.4.7.3. Market Size and Forecast, By   End User
      • 7.4.8. India Photobiostimulation Devices Market

        • 7.4.8.1. Market Size and Forecast, By Type
        • 7.4.8.2. Market Size and Forecast, By Application
        • 7.4.8.3. Market Size and Forecast, By   End User
      • 7.4.9. South Korea Photobiostimulation Devices Market

        • 7.4.9.1. Market Size and Forecast, By Type
        • 7.4.9.2. Market Size and Forecast, By Application
        • 7.4.9.3. Market Size and Forecast, By   End User
      • 7.4.10. Australia Photobiostimulation Devices Market

        • 7.4.10.1. Market Size and Forecast, By Type
        • 7.4.10.2. Market Size and Forecast, By Application
        • 7.4.10.3. Market Size and Forecast, By   End User
      • 7.4.11. Thailand Photobiostimulation Devices Market

        • 7.4.11.1. Market Size and Forecast, By Type
        • 7.4.11.2. Market Size and Forecast, By Application
        • 7.4.11.3. Market Size and Forecast, By   End User
      • 7.4.12. Malaysia Photobiostimulation Devices Market

        • 7.4.12.1. Market Size and Forecast, By Type
        • 7.4.12.2. Market Size and Forecast, By Application
        • 7.4.12.3. Market Size and Forecast, By   End User
      • 7.4.13. Indonesia Photobiostimulation Devices Market

        • 7.4.13.1. Market Size and Forecast, By Type
        • 7.4.13.2. Market Size and Forecast, By Application
        • 7.4.13.3. Market Size and Forecast, By   End User
      • 7.4.14. Rest of Asia Pacific Photobiostimulation Devices Market

        • 7.4.14.1. Market Size and Forecast, By Type
        • 7.4.14.2. Market Size and Forecast, By Application
        • 7.4.14.3. Market Size and Forecast, By   End User
    • 7.5. LAMEA

      • 7.5.1. Key Market Trends and Opportunities

      • 7.5.2. Market Size and Forecast, By Type

      • 7.5.3. Market Size and Forecast, By Application

      • 7.5.4. Market Size and Forecast, By   End User

      • 7.5.5. Market Size and Forecast, By Country

      • 7.5.6. Brazil Photobiostimulation Devices Market

        • 7.5.6.1. Market Size and Forecast, By Type
        • 7.5.6.2. Market Size and Forecast, By Application
        • 7.5.6.3. Market Size and Forecast, By   End User
      • 7.5.7. South Africa Photobiostimulation Devices Market

        • 7.5.7.1. Market Size and Forecast, By Type
        • 7.5.7.2. Market Size and Forecast, By Application
        • 7.5.7.3. Market Size and Forecast, By   End User
      • 7.5.8. Saudi Arabia Photobiostimulation Devices Market

        • 7.5.8.1. Market Size and Forecast, By Type
        • 7.5.8.2. Market Size and Forecast, By Application
        • 7.5.8.3. Market Size and Forecast, By   End User
      • 7.5.9. UAE Photobiostimulation Devices Market

        • 7.5.9.1. Market Size and Forecast, By Type
        • 7.5.9.2. Market Size and Forecast, By Application
        • 7.5.9.3. Market Size and Forecast, By   End User
      • 7.5.10. Argentina Photobiostimulation Devices Market

        • 7.5.10.1. Market Size and Forecast, By Type
        • 7.5.10.2. Market Size and Forecast, By Application
        • 7.5.10.3. Market Size and Forecast, By   End User
      • 7.5.11. Rest of LAMEA Photobiostimulation Devices Market

        • 7.5.11.1. Market Size and Forecast, By Type
        • 7.5.11.2. Market Size and Forecast, By Application
        • 7.5.11.3. Market Size and Forecast, By   End User
  • CHAPTER 8: COMPETITIVE LANDSCAPE

    • 8.1. Introduction

    • 8.2. Top Winning Strategies

    • 8.3. Product Mapping Of Top 10 Player

    • 8.4. Competitive Dashboard

    • 8.5. Competitive Heatmap

    • 8.6. Top Player Positioning,2022

  • CHAPTER 9: COMPANY PROFILES

    • 9.1. THOR Photomedicine Ltd,

      • 9.1.1. Company Overview

      • 9.1.2. Key Executives

      • 9.1.3. Company Snapshot

      • 9.1.4. Operating Business Segments

      • 9.1.5. Product Portfolio

      • 9.1.6. Business Performance

      • 9.1.7. Key Strategic Moves and Developments

    • 9.2. Bioflex Laser Therapy

      • 9.2.1. Company Overview

      • 9.2.2. Key Executives

      • 9.2.3. Company Snapshot

      • 9.2.4. Operating Business Segments

      • 9.2.5. Product Portfolio

      • 9.2.6. Business Performance

      • 9.2.7. Key Strategic Moves and Developments

    • 9.3. Ingeneus Pty. Ltd.

      • 9.3.1. Company Overview

      • 9.3.2. Key Executives

      • 9.3.3. Company Snapshot

      • 9.3.4. Operating Business Segments

      • 9.3.5. Product Portfolio

      • 9.3.6. Business Performance

      • 9.3.7. Key Strategic Moves and Developments

    • 9.4. IRestore Laser

      • 9.4.1. Company Overview

      • 9.4.2. Key Executives

      • 9.4.3. Company Snapshot

      • 9.4.4. Operating Business Segments

      • 9.4.5. Product Portfolio

      • 9.4.6. Business Performance

      • 9.4.7. Key Strategic Moves and Developments

    • 9.5. LumiWave

      • 9.5.1. Company Overview

      • 9.5.2. Key Executives

      • 9.5.3. Company Snapshot

      • 9.5.4. Operating Business Segments

      • 9.5.5. Product Portfolio

      • 9.5.6. Business Performance

      • 9.5.7. Key Strategic Moves and Developments

    • 9.6. Biolight Technologies

      • 9.6.1. Company Overview

      • 9.6.2. Key Executives

      • 9.6.3. Company Snapshot

      • 9.6.4. Operating Business Segments

      • 9.6.5. Product Portfolio

      • 9.6.6. Business Performance

      • 9.6.7. Key Strategic Moves and Developments

    • 9.7. Omega Laser Systems

      • 9.7.1. Company Overview

      • 9.7.2. Key Executives

      • 9.7.3. Company Snapshot

      • 9.7.4. Operating Business Segments

      • 9.7.5. Product Portfolio

      • 9.7.6. Business Performance

      • 9.7.7. Key Strategic Moves and Developments

    • 9.8. TheraDome Inc.

      • 9.8.1. Company Overview

      • 9.8.2. Key Executives

      • 9.8.3. Company Snapshot

      • 9.8.4. Operating Business Segments

      • 9.8.5. Product Portfolio

      • 9.8.6. Business Performance

      • 9.8.7. Key Strategic Moves and Developments

    • 9.9. Vielight Inc.

      • 9.9.1. Company Overview

      • 9.9.2. Key Executives

      • 9.9.3. Company Snapshot

      • 9.9.4. Operating Business Segments

      • 9.9.5. Product Portfolio

      • 9.9.6. Business Performance

      • 9.9.7. Key Strategic Moves and Developments

    • 9.10. IGrow Laser

      • 9.10.1. Company Overview

      • 9.10.2. Key Executives

      • 9.10.3. Company Snapshot

      • 9.10.4. Operating Business Segments

      • 9.10.5. Product Portfolio

      • 9.10.6. Business Performance

      • 9.10.7. Key Strategic Moves and Developments

  • LIST OF TABLES

  • TABLE 1. GLOBAL PHOTOBIOSTIMULATION DEVICES MARKET, BY TYPE, 2022-2032 ($MILLION)
  • TABLE 2. GLOBAL PHOTOBIOSTIMULATION DEVICES MARKET FOR INFRARED LIGHT, BY REGION, 2022-2032 ($MILLION)
  • TABLE 3. GLOBAL PHOTOBIOSTIMULATION DEVICES MARKET FOR RED LIGHT, BY REGION, 2022-2032 ($MILLION)
  • TABLE 4. GLOBAL PHOTOBIOSTIMULATION DEVICES MARKET FOR OTHERS, BY REGION, 2022-2032 ($MILLION)
  • TABLE 5. GLOBAL PHOTOBIOSTIMULATION DEVICES MARKET, BY APPLICATION, 2022-2032 ($MILLION)
  • TABLE 6. GLOBAL PHOTOBIOSTIMULATION DEVICES MARKET FOR PAIN MANAGEMENT, BY REGION, 2022-2032 ($MILLION)
  • TABLE 7. GLOBAL PHOTOBIOSTIMULATION DEVICES MARKET FOR WOUND CARE, BY REGION, 2022-2032 ($MILLION)
  • TABLE 8. GLOBAL PHOTOBIOSTIMULATION DEVICES MARKET FOR COSMETIC APPLICATIONS, BY REGION, 2022-2032 ($MILLION)
  • TABLE 9. GLOBAL PHOTOBIOSTIMULATION DEVICES MARKET FOR OTHER APPLICATIONS, BY REGION, 2022-2032 ($MILLION)
  • TABLE 10. GLOBAL PHOTOBIOSTIMULATION DEVICES MARKET, BY   END USER, 2022-2032 ($MILLION)
  • TABLE 11. GLOBAL PHOTOBIOSTIMULATION DEVICES MARKET FOR SPECIALTY CLINICS, BY REGION, 2022-2032 ($MILLION)
  • TABLE 12. GLOBAL PHOTOBIOSTIMULATION DEVICES MARKET FOR RESEARCH INSTITUTIONS, BY REGION, 2022-2032 ($MILLION)
  • TABLE 13. GLOBAL PHOTOBIOSTIMULATION DEVICES MARKET, BY REGION, 2022-2032 ($MILLION)
  • TABLE 14. NORTH AMERICA PHOTOBIOSTIMULATION DEVICES, BY REGION, 2022-2032 ($MILLION)
  • TABLE 15. NORTH AMERICA PHOTOBIOSTIMULATION DEVICES, BY TYPE, 2022-2032 ($MILLION)
  • TABLE 16. NORTH AMERICA PHOTOBIOSTIMULATION DEVICES, BY APPLICATION, 2022-2032 ($MILLION)
  • TABLE 17. NORTH AMERICA PHOTOBIOSTIMULATION DEVICES, BY   END USER, 2022-2032 ($MILLION)
  • TABLE 18. U.S. PHOTOBIOSTIMULATION DEVICES, BY TYPE, 2022-2032 ($MILLION)
  • TABLE 19. U.S. PHOTOBIOSTIMULATION DEVICES, BY APPLICATION, 2022-2032 ($MILLION)
  • TABLE 20. U.S. PHOTOBIOSTIMULATION DEVICES, BY   END USER, 2022-2032 ($MILLION)
  • TABLE 21. CANADA PHOTOBIOSTIMULATION DEVICES, BY TYPE, 2022-2032 ($MILLION)
  • TABLE 22. CANADA PHOTOBIOSTIMULATION DEVICES, BY APPLICATION, 2022-2032 ($MILLION)
  • TABLE 23. CANADA PHOTOBIOSTIMULATION DEVICES, BY   END USER, 2022-2032 ($MILLION)
  • TABLE 24. MEXICO PHOTOBIOSTIMULATION DEVICES, BY TYPE, 2022-2032 ($MILLION)
  • TABLE 25. MEXICO PHOTOBIOSTIMULATION DEVICES, BY APPLICATION, 2022-2032 ($MILLION)
  • TABLE 26. MEXICO PHOTOBIOSTIMULATION DEVICES, BY   END USER, 2022-2032 ($MILLION)
  • TABLE 27. EUROPE PHOTOBIOSTIMULATION DEVICES, BY REGION, 2022-2032 ($MILLION)
  • TABLE 28. EUROPE PHOTOBIOSTIMULATION DEVICES, BY TYPE, 2022-2032 ($MILLION)
  • TABLE 29. EUROPE PHOTOBIOSTIMULATION DEVICES, BY APPLICATION, 2022-2032 ($MILLION)
  • TABLE 30. EUROPE PHOTOBIOSTIMULATION DEVICES, BY   END USER, 2022-2032 ($MILLION)
  • TABLE 31. FRANCE PHOTOBIOSTIMULATION DEVICES, BY TYPE, 2022-2032 ($MILLION)
  • TABLE 32. FRANCE PHOTOBIOSTIMULATION DEVICES, BY APPLICATION, 2022-2032 ($MILLION)
  • TABLE 33. FRANCE PHOTOBIOSTIMULATION DEVICES, BY   END USER, 2022-2032 ($MILLION)
  • TABLE 34. GERMANY PHOTOBIOSTIMULATION DEVICES, BY TYPE, 2022-2032 ($MILLION)
  • TABLE 35. GERMANY PHOTOBIOSTIMULATION DEVICES, BY APPLICATION, 2022-2032 ($MILLION)
  • TABLE 36. GERMANY PHOTOBIOSTIMULATION DEVICES, BY   END USER, 2022-2032 ($MILLION)
  • TABLE 37. ITALY PHOTOBIOSTIMULATION DEVICES, BY TYPE, 2022-2032 ($MILLION)
  • TABLE 38. ITALY PHOTOBIOSTIMULATION DEVICES, BY APPLICATION, 2022-2032 ($MILLION)
  • TABLE 39. ITALY PHOTOBIOSTIMULATION DEVICES, BY   END USER, 2022-2032 ($MILLION)
  • TABLE 40. SPAIN PHOTOBIOSTIMULATION DEVICES, BY TYPE, 2022-2032 ($MILLION)
  • TABLE 41. SPAIN PHOTOBIOSTIMULATION DEVICES, BY APPLICATION, 2022-2032 ($MILLION)
  • TABLE 42. SPAIN PHOTOBIOSTIMULATION DEVICES, BY   END USER, 2022-2032 ($MILLION)
  • TABLE 43. UK PHOTOBIOSTIMULATION DEVICES, BY TYPE, 2022-2032 ($MILLION)
  • TABLE 44. UK PHOTOBIOSTIMULATION DEVICES, BY APPLICATION, 2022-2032 ($MILLION)
  • TABLE 45. UK PHOTOBIOSTIMULATION DEVICES, BY   END USER, 2022-2032 ($MILLION)
  • TABLE 46. RUSSIA PHOTOBIOSTIMULATION DEVICES, BY TYPE, 2022-2032 ($MILLION)
  • TABLE 47. RUSSIA PHOTOBIOSTIMULATION DEVICES, BY APPLICATION, 2022-2032 ($MILLION)
  • TABLE 48. RUSSIA PHOTOBIOSTIMULATION DEVICES, BY   END USER, 2022-2032 ($MILLION)
  • TABLE 49. REST OF EUROPE PHOTOBIOSTIMULATION DEVICES, BY TYPE, 2022-2032 ($MILLION)
  • TABLE 50. REST OF EUROPE PHOTOBIOSTIMULATION DEVICES, BY APPLICATION, 2022-2032 ($MILLION)
  • TABLE 51. REST OF EUROPE PHOTOBIOSTIMULATION DEVICES, BY   END USER, 2022-2032 ($MILLION)
  • TABLE 52. ASIA-PACIFIC PHOTOBIOSTIMULATION DEVICES, BY REGION, 2022-2032 ($MILLION)
  • TABLE 53. ASIA-PACIFIC PHOTOBIOSTIMULATION DEVICES, BY TYPE, 2022-2032 ($MILLION)
  • TABLE 54. ASIA-PACIFIC PHOTOBIOSTIMULATION DEVICES, BY APPLICATION, 2022-2032 ($MILLION)
  • TABLE 55. ASIA-PACIFIC PHOTOBIOSTIMULATION DEVICES, BY   END USER, 2022-2032 ($MILLION)
  • TABLE 56. CHINA PHOTOBIOSTIMULATION DEVICES, BY TYPE, 2022-2032 ($MILLION)
  • TABLE 57. CHINA PHOTOBIOSTIMULATION DEVICES, BY APPLICATION, 2022-2032 ($MILLION)
  • TABLE 58. CHINA PHOTOBIOSTIMULATION DEVICES, BY   END USER, 2022-2032 ($MILLION)
  • TABLE 59. JAPAN PHOTOBIOSTIMULATION DEVICES, BY TYPE, 2022-2032 ($MILLION)
  • TABLE 60. JAPAN PHOTOBIOSTIMULATION DEVICES, BY APPLICATION, 2022-2032 ($MILLION)
  • TABLE 61. JAPAN PHOTOBIOSTIMULATION DEVICES, BY   END USER, 2022-2032 ($MILLION)
  • TABLE 62. INDIA PHOTOBIOSTIMULATION DEVICES, BY TYPE, 2022-2032 ($MILLION)
  • TABLE 63. INDIA PHOTOBIOSTIMULATION DEVICES, BY APPLICATION, 2022-2032 ($MILLION)
  • TABLE 64. INDIA PHOTOBIOSTIMULATION DEVICES, BY   END USER, 2022-2032 ($MILLION)
  • TABLE 65. SOUTH KOREA PHOTOBIOSTIMULATION DEVICES, BY TYPE, 2022-2032 ($MILLION)
  • TABLE 66. SOUTH KOREA PHOTOBIOSTIMULATION DEVICES, BY APPLICATION, 2022-2032 ($MILLION)
  • TABLE 67. SOUTH KOREA PHOTOBIOSTIMULATION DEVICES, BY   END USER, 2022-2032 ($MILLION)
  • TABLE 68. AUSTRALIA PHOTOBIOSTIMULATION DEVICES, BY TYPE, 2022-2032 ($MILLION)
  • TABLE 69. AUSTRALIA PHOTOBIOSTIMULATION DEVICES, BY APPLICATION, 2022-2032 ($MILLION)
  • TABLE 70. AUSTRALIA PHOTOBIOSTIMULATION DEVICES, BY   END USER, 2022-2032 ($MILLION)
  • TABLE 71. THAILAND PHOTOBIOSTIMULATION DEVICES, BY TYPE, 2022-2032 ($MILLION)
  • TABLE 72. THAILAND PHOTOBIOSTIMULATION DEVICES, BY APPLICATION, 2022-2032 ($MILLION)
  • TABLE 73. THAILAND PHOTOBIOSTIMULATION DEVICES, BY   END USER, 2022-2032 ($MILLION)
  • TABLE 74. MALAYSIA PHOTOBIOSTIMULATION DEVICES, BY TYPE, 2022-2032 ($MILLION)
  • TABLE 75. MALAYSIA PHOTOBIOSTIMULATION DEVICES, BY APPLICATION, 2022-2032 ($MILLION)
  • TABLE 76. MALAYSIA PHOTOBIOSTIMULATION DEVICES, BY   END USER, 2022-2032 ($MILLION)
  • TABLE 77. INDONESIA PHOTOBIOSTIMULATION DEVICES, BY TYPE, 2022-2032 ($MILLION)
  • TABLE 78. INDONESIA PHOTOBIOSTIMULATION DEVICES, BY APPLICATION, 2022-2032 ($MILLION)
  • TABLE 79. INDONESIA PHOTOBIOSTIMULATION DEVICES, BY   END USER, 2022-2032 ($MILLION)
  • TABLE 80. REST OF ASIA PACIFIC PHOTOBIOSTIMULATION DEVICES, BY TYPE, 2022-2032 ($MILLION)
  • TABLE 81. REST OF ASIA PACIFIC PHOTOBIOSTIMULATION DEVICES, BY APPLICATION, 2022-2032 ($MILLION)
  • TABLE 82. REST OF ASIA PACIFIC PHOTOBIOSTIMULATION DEVICES, BY   END USER, 2022-2032 ($MILLION)
  • TABLE 83. LAMEA PHOTOBIOSTIMULATION DEVICES, BY REGION, 2022-2032 ($MILLION)
  • TABLE 84. LAMEA PHOTOBIOSTIMULATION DEVICES, BY TYPE, 2022-2032 ($MILLION)
  • TABLE 85. LAMEA PHOTOBIOSTIMULATION DEVICES, BY APPLICATION, 2022-2032 ($MILLION)
  • TABLE 86. LAMEA PHOTOBIOSTIMULATION DEVICES, BY   END USER, 2022-2032 ($MILLION)
  • TABLE 87. BRAZIL PHOTOBIOSTIMULATION DEVICES, BY TYPE, 2022-2032 ($MILLION)
  • TABLE 88. BRAZIL PHOTOBIOSTIMULATION DEVICES, BY APPLICATION, 2022-2032 ($MILLION)
  • TABLE 89. BRAZIL PHOTOBIOSTIMULATION DEVICES, BY   END USER, 2022-2032 ($MILLION)
  • TABLE 90. SOUTH AFRICA PHOTOBIOSTIMULATION DEVICES, BY TYPE, 2022-2032 ($MILLION)
  • TABLE 91. SOUTH AFRICA PHOTOBIOSTIMULATION DEVICES, BY APPLICATION, 2022-2032 ($MILLION)
  • TABLE 92. SOUTH AFRICA PHOTOBIOSTIMULATION DEVICES, BY   END USER, 2022-2032 ($MILLION)
  • TABLE 93. SAUDI ARABIA PHOTOBIOSTIMULATION DEVICES, BY TYPE, 2022-2032 ($MILLION)
  • TABLE 94. SAUDI ARABIA PHOTOBIOSTIMULATION DEVICES, BY APPLICATION, 2022-2032 ($MILLION)
  • TABLE 95. SAUDI ARABIA PHOTOBIOSTIMULATION DEVICES, BY   END USER, 2022-2032 ($MILLION)
  • TABLE 96. UAE PHOTOBIOSTIMULATION DEVICES, BY TYPE, 2022-2032 ($MILLION)
  • TABLE 97. UAE PHOTOBIOSTIMULATION DEVICES, BY APPLICATION, 2022-2032 ($MILLION)
  • TABLE 98. UAE PHOTOBIOSTIMULATION DEVICES, BY   END USER, 2022-2032 ($MILLION)
  • TABLE 99. ARGENTINA PHOTOBIOSTIMULATION DEVICES, BY TYPE, 2022-2032 ($MILLION)
  • TABLE 100. ARGENTINA PHOTOBIOSTIMULATION DEVICES, BY APPLICATION, 2022-2032 ($MILLION)
  • TABLE 101. ARGENTINA PHOTOBIOSTIMULATION DEVICES, BY   END USER, 2022-2032 ($MILLION)
  • TABLE 102. REST OF LAMEA PHOTOBIOSTIMULATION DEVICES, BY TYPE, 2022-2032 ($MILLION)
  • TABLE 103. REST OF LAMEA PHOTOBIOSTIMULATION DEVICES, BY APPLICATION, 2022-2032 ($MILLION)
  • TABLE 104. REST OF LAMEA PHOTOBIOSTIMULATION DEVICES, BY   END USER, 2022-2032 ($MILLION)
  • TABLE 105. THOR PHOTOMEDICINE LTD,: KEY EXECUTIVES
  • TABLE 106. THOR PHOTOMEDICINE LTD,: COMPANY SNAPSHOT
  • TABLE 107. THOR PHOTOMEDICINE LTD,: OPERATING SEGMENTS
  • TABLE 108. THOR PHOTOMEDICINE LTD,: PRODUCT PORTFOLIO
  • TABLE 109. THOR PHOTOMEDICINE LTD,: KEY STRATEGIC MOVES AND DEVELOPMENTS
  • TABLE 110. BIOFLEX LASER THERAPY: KEY EXECUTIVES
  • TABLE 111. BIOFLEX LASER THERAPY: COMPANY SNAPSHOT
  • TABLE 112. BIOFLEX LASER THERAPY: OPERATING SEGMENTS
  • TABLE 113. BIOFLEX LASER THERAPY: PRODUCT PORTFOLIO
  • TABLE 114. BIOFLEX LASER THERAPY: KEY STRATEGIC MOVES AND DEVELOPMENTS
  • TABLE 115. INGENEUS PTY. LTD.: KEY EXECUTIVES
  • TABLE 116. INGENEUS PTY. LTD.: COMPANY SNAPSHOT
  • TABLE 117. INGENEUS PTY. LTD.: OPERATING SEGMENTS
  • TABLE 118. INGENEUS PTY. LTD.: PRODUCT PORTFOLIO
  • TABLE 119. INGENEUS PTY. LTD.: KEY STRATEGIC MOVES AND DEVELOPMENTS
  • TABLE 120. IRESTORE LASER: KEY EXECUTIVES
  • TABLE 121. IRESTORE LASER: COMPANY SNAPSHOT
  • TABLE 122. IRESTORE LASER: OPERATING SEGMENTS
  • TABLE 123. IRESTORE LASER: PRODUCT PORTFOLIO
  • TABLE 124. IRESTORE LASER: KEY STRATEGIC MOVES AND DEVELOPMENTS
  • TABLE 125. LUMIWAVE: KEY EXECUTIVES
  • TABLE 126. LUMIWAVE: COMPANY SNAPSHOT
  • TABLE 127. LUMIWAVE: OPERATING SEGMENTS
  • TABLE 128. LUMIWAVE: PRODUCT PORTFOLIO
  • TABLE 129. LUMIWAVE: KEY STRATEGIC MOVES AND DEVELOPMENTS
  • TABLE 130. BIOLIGHT TECHNOLOGIES: KEY EXECUTIVES
  • TABLE 131. BIOLIGHT TECHNOLOGIES: COMPANY SNAPSHOT
  • TABLE 132. BIOLIGHT TECHNOLOGIES: OPERATING SEGMENTS
  • TABLE 133. BIOLIGHT TECHNOLOGIES: PRODUCT PORTFOLIO
  • TABLE 134. BIOLIGHT TECHNOLOGIES: KEY STRATEGIC MOVES AND DEVELOPMENTS
  • TABLE 135. OMEGA LASER SYSTEMS: KEY EXECUTIVES
  • TABLE 136. OMEGA LASER SYSTEMS: COMPANY SNAPSHOT
  • TABLE 137. OMEGA LASER SYSTEMS: OPERATING SEGMENTS
  • TABLE 138. OMEGA LASER SYSTEMS: PRODUCT PORTFOLIO
  • TABLE 139. OMEGA LASER SYSTEMS: KEY STRATEGIC MOVES AND DEVELOPMENTS
  • TABLE 140. THERADOME INC.: KEY EXECUTIVES
  • TABLE 141. THERADOME INC.: COMPANY SNAPSHOT
  • TABLE 142. THERADOME INC.: OPERATING SEGMENTS
  • TABLE 143. THERADOME INC.: PRODUCT PORTFOLIO
  • TABLE 144. THERADOME INC.: KEY STRATEGIC MOVES AND DEVELOPMENTS
  • TABLE 145. VIELIGHT INC.: KEY EXECUTIVES
  • TABLE 146. VIELIGHT INC.: COMPANY SNAPSHOT
  • TABLE 147. VIELIGHT INC.: OPERATING SEGMENTS
  • TABLE 148. VIELIGHT INC.: PRODUCT PORTFOLIO
  • TABLE 149. VIELIGHT INC.: KEY STRATEGIC MOVES AND DEVELOPMENTS
  • TABLE 150. IGROW LASER: KEY EXECUTIVES
  • TABLE 151. IGROW LASER: COMPANY SNAPSHOT
  • TABLE 152. IGROW LASER: OPERATING SEGMENTS
  • TABLE 153. IGROW LASER: PRODUCT PORTFOLIO
  • TABLE 154. IGROW LASER: KEY STRATEGIC MOVES AND DEVELOPMENTS
  • LIST OF FIGURES

  • FIGURE 1. GLOBAL PHOTOBIOSTIMULATION DEVICES MARKET SEGMENTATION
  • FIGURE 2. GLOBAL PHOTOBIOSTIMULATION DEVICES MARKET
  • FIGURE 3. SEGMENTATION PHOTOBIOSTIMULATION DEVICES MARKET
  • FIGURE 4. TOP INVESTMENT POCKET IN PHOTOBIOSTIMULATION DEVICES MARKET
  • FIGURE 5. MODERATE BARGAINING POWER OF BUYERS
  • FIGURE 6. MODERATE BARGAINING POWER OF SUPPLIERS
  • FIGURE 7. MODERATE THREAT OF NEW ENTRANTS
  • FIGURE 8. LOW THREAT OF SUBSTITUTION
  • FIGURE 9. HIGH COMPETITIVE RIVALRY
  • FIGURE 10. OPPORTUNITIES, RESTRAINTS AND DRIVERS: GLOBALPHOTOBIOSTIMULATION DEVICES MARKET
  • FIGURE 11. PHOTOBIOSTIMULATION DEVICES MARKET SEGMENTATION, BY BY TYPE
  • FIGURE 12. PHOTOBIOSTIMULATION DEVICES MARKET FOR INFRARED LIGHT, BY COUNTRY, 2022-2032 ($MILLION)
  • FIGURE 13. PHOTOBIOSTIMULATION DEVICES MARKET FOR RED LIGHT, BY COUNTRY, 2022-2032 ($MILLION)
  • FIGURE 14. PHOTOBIOSTIMULATION DEVICES MARKET FOR OTHERS, BY COUNTRY, 2022-2032 ($MILLION)
  • FIGURE 15. PHOTOBIOSTIMULATION DEVICES MARKET SEGMENTATION, BY BY APPLICATION
  • FIGURE 16. PHOTOBIOSTIMULATION DEVICES MARKET FOR PAIN MANAGEMENT, BY COUNTRY, 2022-2032 ($MILLION)
  • FIGURE 17. PHOTOBIOSTIMULATION DEVICES MARKET FOR WOUND CARE, BY COUNTRY, 2022-2032 ($MILLION)
  • FIGURE 18. PHOTOBIOSTIMULATION DEVICES MARKET FOR COSMETIC APPLICATIONS, BY COUNTRY, 2022-2032 ($MILLION)
  • FIGURE 19. PHOTOBIOSTIMULATION DEVICES MARKET FOR OTHER APPLICATIONS, BY COUNTRY, 2022-2032 ($MILLION)
  • FIGURE 20. PHOTOBIOSTIMULATION DEVICES MARKET SEGMENTATION, BY BY   END USER
  • FIGURE 21. PHOTOBIOSTIMULATION DEVICES MARKET FOR SPECIALTY CLINICS, BY COUNTRY, 2022-2032 ($MILLION)
  • FIGURE 22. PHOTOBIOSTIMULATION DEVICES MARKET FOR RESEARCH INSTITUTIONS, BY COUNTRY, 2022-2032 ($MILLION)
  • FIGURE 23. TOP WINNING STRATEGIES, BY YEAR, 2020-2022*
  • FIGURE 24. TOP WINNING STRATEGIES, BY DEVELOPMENT, 2020-2022*
  • FIGURE 25. TOP WINNING STRATEGIES, BY COMPANY, 2020-2022*
  • FIGURE 26. PRODUCT MAPPING OF TOP 10 PLAYERS
  • FIGURE 27. COMPETITIVE DASHBOARD
  • FIGURE 28. COMPETITIVE HEATMAP: PHOTOBIOSTIMULATION DEVICES MARKET
  • FIGURE 29. Top player positioning, 2022
  • FIGURE 30. THOR PHOTOMEDICINE LTD,: NET SALES, 2020-2022 ($MILLION)
  • FIGURE 31. THOR PHOTOMEDICINE LTD,: REVENUE SHARE, BY SEGMENT, 2032 (%)
  • FIGURE 32. THOR PHOTOMEDICINE LTD,: REVENUE SHARE, BY REGION, 2032 (%)
  • FIGURE 33. BIOFLEX LASER THERAPY: NET SALES, 2020-2022 ($MILLION)
  • FIGURE 34. BIOFLEX LASER THERAPY: REVENUE SHARE, BY SEGMENT, 2032 (%)
  • FIGURE 35. BIOFLEX LASER THERAPY: REVENUE SHARE, BY REGION, 2032 (%)
  • FIGURE 36. INGENEUS PTY. LTD.: NET SALES, 2020-2022 ($MILLION)
  • FIGURE 37. INGENEUS PTY. LTD.: REVENUE SHARE, BY SEGMENT, 2032 (%)
  • FIGURE 38. INGENEUS PTY. LTD.: REVENUE SHARE, BY REGION, 2032 (%)
  • FIGURE 39. IRESTORE LASER: NET SALES, 2020-2022 ($MILLION)
  • FIGURE 40. IRESTORE LASER: REVENUE SHARE, BY SEGMENT, 2032 (%)
  • FIGURE 41. IRESTORE LASER: REVENUE SHARE, BY REGION, 2032 (%)
  • FIGURE 42. LUMIWAVE: NET SALES, 2020-2022 ($MILLION)
  • FIGURE 43. LUMIWAVE: REVENUE SHARE, BY SEGMENT, 2032 (%)
  • FIGURE 44. LUMIWAVE: REVENUE SHARE, BY REGION, 2032 (%)
  • FIGURE 45. BIOLIGHT TECHNOLOGIES: NET SALES, 2020-2022 ($MILLION)
  • FIGURE 46. BIOLIGHT TECHNOLOGIES: REVENUE SHARE, BY SEGMENT, 2032 (%)
  • FIGURE 47. BIOLIGHT TECHNOLOGIES: REVENUE SHARE, BY REGION, 2032 (%)
  • FIGURE 48. OMEGA LASER SYSTEMS: NET SALES, 2020-2022 ($MILLION)
  • FIGURE 49. OMEGA LASER SYSTEMS: REVENUE SHARE, BY SEGMENT, 2032 (%)
  • FIGURE 50. OMEGA LASER SYSTEMS: REVENUE SHARE, BY REGION, 2032 (%)
  • FIGURE 51. THERADOME INC.: NET SALES, 2020-2022 ($MILLION)
  • FIGURE 52. THERADOME INC.: REVENUE SHARE, BY SEGMENT, 2032 (%)
  • FIGURE 53. THERADOME INC.: REVENUE SHARE, BY REGION, 2032 (%)
  • FIGURE 54. VIELIGHT INC.: NET SALES, 2020-2022 ($MILLION)
  • FIGURE 55. VIELIGHT INC.: REVENUE SHARE, BY SEGMENT, 2032 (%)
  • FIGURE 56. VIELIGHT INC.: REVENUE SHARE, BY REGION, 2032 (%)
  • FIGURE 57. IGROW LASER: NET SALES, 2020-2022 ($MILLION)
  • FIGURE 58. IGROW LASER: REVENUE SHARE, BY SEGMENT, 2032 (%)
  • FIGURE 59. IGROW LASER: REVENUE SHARE, BY REGION, 2032 (%)


With collective industry experience of about 200 years of its analysts and experts, Allied Market Research (AMR) encompasses most infallible research methodology for its market intelligence and industry analysis. We do not only engrave the deepest levels of markets but also sneak through its slimmest details for the purpose of our market estimates and forecasts. Our approach helps in building greater market consensus view for size, shape and industry trends within each industry segment. We carefully factor in industry trends and real developments for identifying key growth factors and future course of the market. Our research proceeds are the resultant of high quality data, expert views and analysis and high value independent opinions. Our research process is designed to deliver balanced view of the global markets and allow stakeholders to make informed decisions.

We offer our clients exhaustive research and analysis based on wide variety of factual inputs, which largely include interviews with industry participants, reliable statistics and regional intelligence. Our in-house industry experts play instrumental role in designing analytic tools and models, tailored to the requirements of particular industry segment. These analytical tools and models sanitize the data & statistics and enhance the accuracy of our recommendations and advice. With AMR’s calibrated research process and 360` degree data-evaluation methodology, our clients are assured of receiving:

  • Consistent, valuable, robust and actionable data & analysis that can easily be referenced for strategic business planning
  • Technologically sophisticated and reliable insights through well audited and veracious research methodology
  • Sovereign research proceeds that present a tangible depiction of marketplace


With a strong methodology we are, therefore, confident that our research and analysis are most reliable and guarantees sound business planning.

Secondary research
We refer a broad array of industry sources for our secondary, which typically include; however, not limited to: Company SEC filings, annual reports, company websites, broker & financial reports and investor presentations for competitive scenario and shape of the industry

  • Patent and regulatory databases for understanding of technical & legal developments
  • Scientific and technical writings for product information and related preemptions
  • Regional government and statistical databases for macro analysis
  • Authentic new articles, web-casts and other related releases for market evaluation
  • Internal and external proprietary databases, key market indicators and relevant press releases for market estimates and forecast


Primary research
Our primary research efforts include reaching out participants through mail, tele-conversations, referrals, professional networks and face-to-face interactions. We are also in professional corporate relations with various companies that allow us greater flexibility for reaching out industry participants and commentators for interviews and discussions, fulfilling following functions:

  • Validates and improves the data quality and strengthens research proceeds
  • Further develops analyst team’s market understanding and expertise
  • Supplies authentic information about market size, share, growth and forecasts


Our primary research interview and discussion panels are typically composed of most experienced industry members. These participants include; however, not limited to:

  • Chief executives and VPs of leading corporations specific to industry
  • Product and sales managers or country heads; channel partners and top level distributors; banking, investments and valuation experts Key opinion leaders (KOLs)


Analyst tools and models
AMR has developed set of analyst tools and data models to supplement and expedite the analysis process. Corresponding to markets, where there is significant lack of information and estimates, AMR’s team of experts and analyst develop specific analyst tools and industry models to translate qualitative and quantitative industry indicators into exact industry estimates. These models also allow analysts to examine the prospects and opportunities prevailing in the market to accurately forecast the course of the market.

PURCHASE OPTIONS

Call or Email us

U.S.-Canada Toll-free: +1-800-792-5285
Int'l : +1-503-894-6022
Europe : +44-845-528-1300
Email : help@alliedmarketresearch.com

Looking for Customization?

 Customization Request

Have a Question?

 Speak with Analyst

Any Confusion?

 Inquire Before Buying

Have a glance of the Report

  Enquiry Now
RELATED TAGS

Purchase Full Report of
Photobiostimulation Devices Market

Start reading.
This Report and over 66,905+ more Reports, Available with Avenue Library. T&C*.

  • Online Only
  • $3,690
  • Online cloud access only
  • Restricted print, copy, paste & download
  • Read only
  • Free industry update
    (Within 180 days)
  • Free report update in next update cycle
  • Data Pack
  • $3,840
  • Restricted to one authorized user
  • One print only
  • Available in
    Excel
  • Free industry update
    (Within 180 days)
  •   Free report update in next update cycle
  • Single User
  • $5,820
  • Restricted to one authorized user
  • One print only
  • Available in
    PDF
  • Free industry update
    (Within 180 days)
  •   Free report update in next update cycle
  • Five Users
  • $6,540
  • Limited to five authorized users
  • Print upto five copies
  • Available in
    PDF
  • Free industry update
    (Within 180 days)
  •   Free report update in next update cycle
  • Enterprise
    License/PDF

  • $9,870
  • Unlimited
    within
    company/enterprise
  • Available in Excel & PDF
  • Free industry update
    (Within 180 days)
  •   Free report update in next update cycle
  • Library
    Membership

  • $999 $ 1,175
    Per User/ Per month/ Billed annually
  • Published Content
    E-access
  • Company Profiles
    E-access
  • Newly Added Content Access
  • 10 PDF
    Downloads
  • 5 Excel Data
    Pack Downloads
  • 250 Company Profiles PDF Downloads
  • Buy Now

*Taxes/Fees, if applicable will be added during checkout. All prices in USD

RELATED REPORTS
 

Why Allied Market Research?


Infallible Methodology

To ensure high-level data integrity, accurate analysis, and impeccable forecasts

Analyst Support

For complete satisfaction

Customization

On-demand customization of scope of the report to exactly meet your needs

TARGETED MARKET VIEW

Targeted market view to provide pertinent information and save time of readers

Get fresh content delivered

Get insights on topics that are crucial for your business. Stay abreast of your interest areas.

Get Industry Data Alerts

Why Allied Market Research?

Infallible Methodology

To ensure high-level data integrity, accurate analysis, and impeccable forecasts

Analyst Support

For complete satisfaction

Customization

On-demand customization of scope of the report to exactly meet your needs

TARGETED MARKET VIEW

Targeted market view to provide pertinent information and save time of readers