Report Code: A02785 | Feb 2019 | Pages: 99 | ||
Tables: 45 | Charts: 23 |
|
Pandemic disrupted the entire world and affected many industries.
Get detailed COVID-19 impact analysis on the Photosensitive Glass Market
Request Now !The global photosensitive glass market accounted for $6,355.8 in 2017 and is anticipated to reach $10,885.3 by 2025, registering a CAGR of 6.8% from 2018 to 2025.
Photosensitive glass is also known as photo-structurable glass or photo-machinable glass which belongs to lithium silicate family. Colored pictures can be produced by exposing this glass to ultraviolet light. The colored images are formed in the photosensitive glass with the help of mask by microscopic metallic particles, when it is exposed to short wave radiations, such as UV light.
The global photosensitive glass market is still at a nascent stage and is expected to explore considerable growth opportunities during the assessment period (2018-2025). Photosensitive glass is lithium silicate family glass, which is used for decorative purpose in residential application. It is used for decorations owing to its attractive appearance and unique property to capture image. Hence, gradual rise in penetration of photosensitive glass is considered as a key growth factor.
Construction industry is also emerging as a promising consumer of this glass due to its unique appearance. Photosensitive glass is used in ornamental tiles, wall & partition beautification, and in large windowpanes in architectural applications. This in turn drives the growth of the market. Furthermore, developing use of photosensitive glass to produce micro circuits through photosensitive glass in electronic industry also boosts the market growth. Driven by these factors, growth of this market is restrained by high price of photosensitive glass linked with limited presence of photosensitive glass manufacturers. The global photosensitive glass market is expected to witness lucrative growth opportunities due to large-scale usage of the glass in various end use industries, such as automotive and electronics.
The photosensitive glass market is segmented based on application and region. Based on application, the global market is segmented into construction, ornaments, decorative, electronics, and automotive. Based on region, the global market is analyzed across North America, Europe, Asia-Pacific, and LAMEA.
The major key players operating in the photosensitive glass market include Corning Incorporated, Gaffer Glass USA, Schott AG, Hoya Corporation, and IPG Photonics Corporation.
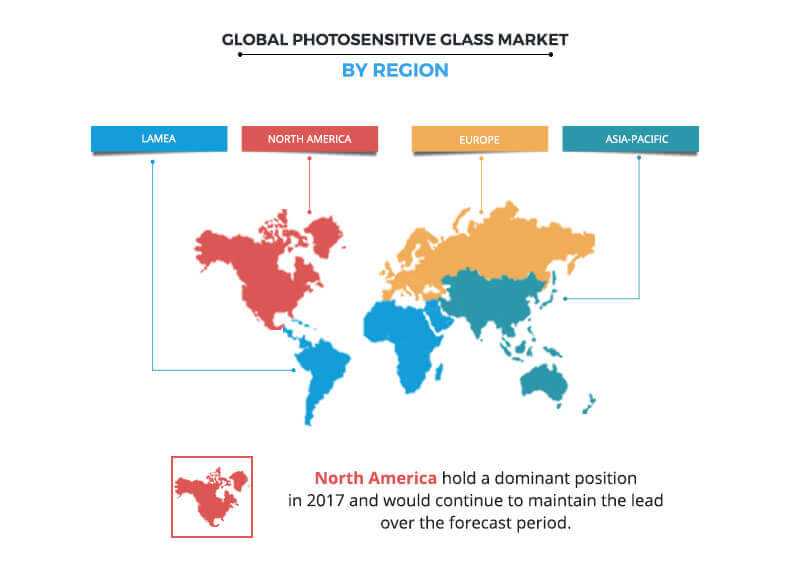
Global Photosensitive Glass market share, by region
Based on region, North America accounts for major share in the global photosensitive glass market, owing to active presence of leading photosensitive glass manufacturers such as Gaffer Glass USA, and Corning Incorporated. In addition, economically strong status of this region and presence of established construction industry has helped in generating additional demand for photosensitive glass.
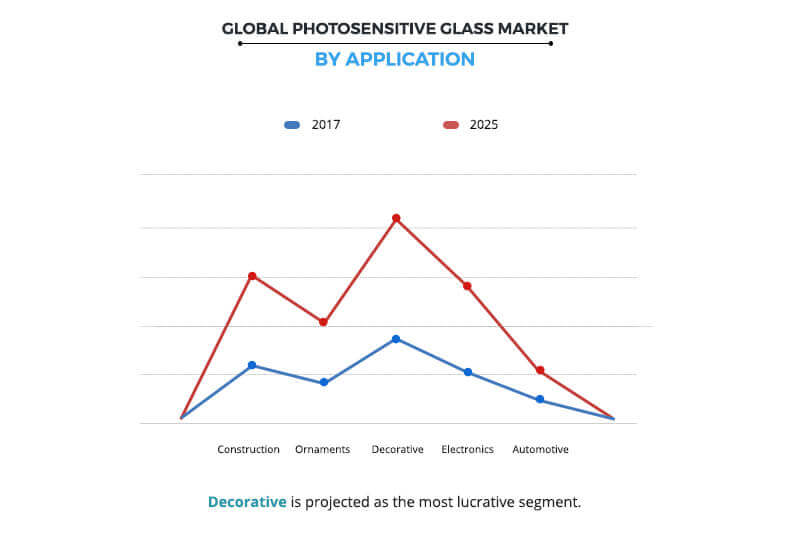
Global Photosensitive Glass market, by Application
Based on application, the decorative application segment dominated the market in 2017, owing to unique appearance and property to capture colorful images. This in turn increased the adoption of photosensitive glass decorative applications in the household industry.
Photosensitive Glass Market Report Highlights
Aspects | Details |
---|---|
By Application |
|
By Region |
|
Key Market Players | GAFFER GLASS, HOYA CORPORATION, IPG PHOTONICS CORPORATION, SCHOTT AG, CORNING INCORPORATED |
CHAPTER 1:Â Â Â INTRODUCTION
1.1.   Report description
1.2.   Key benefits for stakeholders
1.3.   Key market segments
1.4.   Research methodology
1.4.1.   Secondary research
1.4.2.   Primary research
1.5.   Analyst tools and models
CHAPTER 2:Â Â Â EXECUTIVE SUMMARY
2.1.   Key findings of the study
2.2.   CXO perspective
CHAPTER 3:Â Â Â MARKET OVERVIEW
3.1.   Market definition and scope
3.2.   Key findings
3.2.1.   Top investment pockets
3.2.2.   Porter’s five forces analysis
3.3.   Market dynamics
3.3.1.   Drivers
3.3.1.1.   Developing applications of photosensitive glass in photolithography
3.3.1.2.   Surge in demand for photosensitive glass
3.3.2.   Restraint
3.3.2.1.   High price and limited presence of global manufacturers
3.3.3.   Opportunity
3.3.3.1.   Increase in application across various industries
CHAPTER 4:Â Â Â PHOTOSENSITIVE GLASS MARKET, BY APPLICATION
4.1.   Overview
4.1.1.   Market size and forecast
4.2.   Construction
4.2.1.   Key market trends, growth factors, and opportunities
4.2.2.   Market size and forecast, by region
4.2.3.   Market share analysis, by country
4.3.   Ornaments
4.3.1.   Key market trends, growth factors, and opportunities
4.3.2.   Market size and forecast, by region
4.3.3.   Market share analysis, by country
4.4.   Decorative
4.4.1.   Key market trends, growth factors, and opportunities
4.4.2.   Market size and forecast, by region
4.4.3.   Market share analysis, by country
4.5.   Electronics
4.5.1.   Key market trends, growth factors, and opportunities
4.5.2.   Market size and forecast, by region
4.5.3.   Market share analysis, by country
4.6.   Automotive
4.6.1.   Key market trends, growth factors, and opportunities
4.6.2.   Market size and forecast, by region
4.6.3.   Market share analysis, by country
CHAPTER 5:Â Â Â PHOTOSENSITIVE GLASS MARKET, BY REGION
5.1.   Overview
5.1.1.   Market size and forecast
5.2.   North America
5.2.1.   Key market trends, growth factors, and opportunities
5.2.2.   Market size and forecast, by application
5.2.3.   Market share analysis, by country
5.2.4.   U.S.
5.2.4.1.   Market size and forecast, by application
5.2.5.   Canada
5.2.5.1.   Market size and forecast, by application
5.2.6.   Mexico
5.2.6.1.   Market size and forecast, by application
5.3.   Europe
5.3.1.   Key market trends, growth factors, and opportunities
5.3.2.   Market size and forecast, by application
5.3.3.   Market share analysis, by country
5.3.4.   Germany
5.3.4.1.   Market size and forecast, by application
5.3.5.   France
5.3.5.1.   Market size and forecast, by application
5.3.6.   UK
5.3.6.1.   Market size and forecast, by application
5.3.7.   Italy
5.3.7.1.   Market size and forecast, by application
5.3.8.   Rest of Europe
5.3.8.1.   Market size and forecast, by application
5.4.   Asia-Pacific
5.4.1.   Key market trends, growth factors, and opportunities
5.4.2.   Market size and forecast, by application
5.4.3.   Market share analysis, by country
5.4.4.   China
5.4.4.1.   Market size and forecast, by application
5.4.5.   Japan
5.4.5.1.   Market size and forecast, by application
5.4.6.   India
5.4.6.1.   Market size and forecast, by application
5.4.7.   Australia
5.4.7.1.   Market size and forecast, by application
5.4.8.   Rest of Asia-Pacific
5.4.8.1.   Market size and forecast, by application
5.5.   LAMEA
5.5.1.   Key market trends, growth factors, and opportunities
5.5.2.   Market size and forecast, by application
5.5.3.   Market share analysis, by country
5.5.4.   Brazil
5.5.4.1.   Market size and forecast, by application
5.5.5.   Saudi Arabia
5.5.5.1.   Market size and forecast, by application
5.5.6.   Rest of LAMEA
5.5.6.1.   Market size and forecast, by application
CHAPTER 6:Â Â Â COMPANY PROFILES
6.1.   CORNING INCORPORATED
6.1.1.   Company overview
6.1.2.   Company snapshot
6.1.3.   Operating business segments
6.1.4.   Product portfolio
6.1.5.   Business performance
6.2.   GAFFER GLASS
6.2.1.   Company overview
6.2.2.   Company snapshot
6.2.3.   Product portfolio
6.3.   HOYA CORPORATION
6.3.1.   Company overview
6.3.2.   Company snapshot
6.3.3.   Operating business segments
6.3.4.   Product portfolio
6.3.5.   Business performance
6.4.   IPG PHOTONICS CORPORATION
6.4.1.   Company overview
6.4.2.   Company snapshot
6.4.3.   Product portfolio
6.4.4.   Business performance
6.5.   SCHOTT AG
6.5.1.   Company overview
6.5.2.   Company snapshot
6.5.3.   Operating business segments
6.5.4.   Product portfolio
6.5.5.   Business performance
6.5.6.   Key strategic moves and developments
LIST OF TABLES
TABLE 01.   GLOBAL PHOTOSENSITIVE GLASS MARKET, BY APPLICATION, 2017–2025 (USD)
TABLE 02.   PHOTOSENSITIVE GLASS MARKET FOR CONSTRUCTION, BY REGION, 2017–2025 (USD)
TABLE 03.   PHOTOSENSITIVE GLASS MARKET FOR ORNAMENTS, BY REGION, 2017–2025 (USD)
TABLE 04.   PHOTOSENSITIVE GLASS MARKET FOR DECORATIVE, BY REGION, 2017–2025 (USD)
TABLE 05.   PHOTOSENSITIVE GLASS MARKET FOR ELECTRONICS, BY REGION, 2017–2025 (USD)
TABLE 06.   PHOTOSENSITIVE GLASS MARKET FOR AUTOMOTIVE, BY REGION, 2017–2025 (USD)
TABLE 07.   PHOTOSENSITIVE GLASS MARKET, BY REGION, 2017–2025 (USD)
TABLE 08.   NORTH AMERICA PHOTOSENSITIVE GLASS MARKET, BY APPLICATION, 2017–2025 (USD)
TABLE 09.   NORTH AMERICA PHOTOSENSITIVE GLASS MARKET, BY COUNTRY, 2017–2025 (USD)
TABLE 10.   U.S. PHOTOSENSITIVE GLASS MARKET, BY APPLICATION, 2017–2025 (USD)
TABLE 11.   CANADA PHOTOSENSITIVE GLASS MARKET, BY APPLICATION, 2017–2025 (USD)
TABLE 12.   MEXICO PHOTOSENSITIVE GLASS MARKET, BY APPLICATION, 2017–2025 (USD)
TABLE 13.   EUROPE PHOTOSENSITIVE GLASS MARKET, BY APPLICATION, 2017–2025 (USD)
TABLE 14.   EUROPE PHOTOSENSITIVE GLASS MARKET, BY COUNTRY, 2017–2025 (USD)
TABLE 15.   GERMANY PHOTOSENSITIVE GLASS MARKET, BY APPLICATION, 2017–2025 (USD)
TABLE 16.   FRANCE PHOTOSENSITIVE GLASS MARKET, BY APPLICATION, 2017–2025 (USD)
TABLE 17.   UK PHOTOSENSITIVE GLASS MARKET, BY APPLICATION, 2017–2025 (USD)
TABLE 18.   ITALY PHOTOSENSITIVE GLASS MARKET, BY APPLICATION, 2017–2025 (USD)
TABLE 19.   REST OF EUROPE PHOTOSENSITIVE GLASS MARKET, BY APPLICATION, 2017–2025 (USD)
TABLE 20.   ASIA-PACIFIC PHOTOSENSITIVE GLASS MARKET, BY APPLICATION, 2017–2025 (USD)
TABLE 21.   ASIA-PACIFIC PHOTOSENSITIVE GLASS MARKET, BY COUNTRY, 2017–2025 (USD)
TABLE 22.   CHINA PHOTOSENSITIVE GLASS MARKET, BY APPLICATION, 2017–2025 (USD)
TABLE 23.   JAPAN PHOTOSENSITIVE GLASS MARKET, BY APPLICATION, 2017–2025 (USD)
TABLE 24.   INDIA PHOTOSENSITIVE GLASS MARKET, BY APPLICATION, 2017–2025 (USD)
TABLE 25.   AUSTRALIA PHOTOSENSITIVE GLASS MARKET, BY APPLICATION, 2017–2025 (USD)
TABLE 26.   REST OF ASIA-PACIFIC PHOTOSENSITIVE GLASS MARKET, BY APPLICATION, 2017–2025 (USD)
TABLE 27.   LAMEA PHOTOSENSITIVE GLASS MARKET, BY APPLICATION, 2017–2025 (USD)
TABLE 28.   LAMEA PHOTOSENSITIVE GLASS MARKET, BY COUNTRY, 2017–2025 (USD)
TABLE 29.   BRAZIL PHOTOSENSITIVE GLASS MARKET, BY APPLICATION, 2017–2025 (USD)
TABLE 30.   SAUDI ARABIA PHOTOSENSITIVE GLASS MARKET, BY APPLICATION, 2017–2025 (USD)
TABLE 31.   REST OF LAMEA PHOTOSENSITIVE GLASS MARKET, BY APPLICATION, 2017–2025 (USD)
TABLE 32.   CORNING: COMPANY SNAPSHOT
TABLE 33.   CORNING: OPERATING SEGMENTS
TABLE 34.   CORNING: PRODUCT PORTFOLIO
TABLE 35.   GAFFER: COMPANY SNAPSHOT
TABLE 36.   GAFFER: PRODUCT PORTFOLIO
TABLE 37.   HOYA: COMPANY SNAPSHOT
TABLE 38.   HOYA: OPERATING SEGMENTS
TABLE 39.   HOYA: PRODUCT PORTFOLIO
TABLE 40.   IPG PHOTONICS: COMPANY SNAPSHOT
TABLE 41.   IPG PHOTONICS: PRODUCT PORTFOLIO
TABLE 42.   SCHOTT: COMPANY SNAPSHOT
TABLE 43.   SCHOTT: OPERATING SEGMENTS
TABLE 44.   SCHOTT: PRODUCT PORTFOLIO
TABLE 45.   SCHOTT: KEY STRATEGIC MOVES AND DEVELOPMENTS
LIST OF FIGURES
FIGURE 01.   GLOBAL PHOTOSENSITIVE GLASS MARKET SEGMENTATION
FIGURE 02.   TOP INVESTMENT POCKETS, BY COUNTRY
FIGURE 03.   LOW BARGAINING POWER OF SUPPLIERS
FIGURE 04.   MODERATE BARGAINING POWER OF BUYERS
FIGURE 05.   MODERATE THREAT OF NEW ENTRANTS
FIGURE 06.   MODERATE THREAT OF SUBSTITUTES
FIGURE 07.   MODERATE INTENSITY OF COMPETITIVE RIVALRY
FIGURE 08.   GLOBAL PHOTOSENSITIVE GLASS MARKET DYNAMICS
FIGURE 09.   COMPARATIVE SHARE ANALYSIS OF PHOTOSENSITIVE GLASS MARKET FOR CONSTRUCTION, BY COUNTRY, 2017 & 2025 (%)
FIGURE 10.   COMPARATIVE SHARE ANALYSIS OF PHOTOSENSITIVE GLASS MARKET FOR ORNAMENTS, BY COUNTRY, 2017 & 2025 (%)
FIGURE 11.   COMPARATIVE SHARE ANALYSIS OF PHOTOSENSITIVE GLASS MARKET FOR DECORATIVE, BY COUNTRY, 2017 & 2025 (%)
FIGURE 12.   COMPARATIVE SHARE ANALYSIS OF PHOTOSENSITIVE GLASS MARKET FOR ELECTRONICS, BY COUNTRY, 2017 & 2025 (%)
FIGURE 13.   COMPARATIVE SHARE ANALYSIS OF PHOTOSENSITIVE GLASS MARKET FOR AUTOMOTIVE, BY COUNTRY, 2017 & 2025 (%)
FIGURE 14.   CORNING: REVENUE, 2015–2017 ($MILLION)
FIGURE 15.   CORNING: REVENUE SHARE BY SEGMENT, 2017 (%)
FIGURE 16.   CORNING: REVENUE SHARE BY REGION, 2017 (%)
FIGURE 17.   HOYA: REVENUE, 2015–2017 ($MILLION)
FIGURE 18.   HOYA: REVENUE SHARE BY REGION, 2017 (%)
FIGURE 19.   HOYA: REVENUE SHARE BY SEGMENT, 2017 (%)
FIGURE 20.   IPG PHOTONICS: REVENUE, 2015–2017 ($MILLION)
FIGURE 21.   IPG PHOTONICS: REVENUE SHARE BY REGION, 2017 (%)
FIGURE 22.   SCHOTT: REVENUE, 2015–2017 ($MILLION)
FIGURE 23.   SCHOTT: REVENUE SHARE BY REGION, 2017 (%)
According to the CXOs, the photosensitive glass market is at a nascent stage and its applications are still developing at an industrial level. Currently, the glass is being used for aesthetic purposes in the household end-use industry; however, its potential applications are anticipated to experience growth in the electronics industry. This product is used for microfabrication to produce various electronic and optoelectronic devices with photolithography. These devices are used in the production of micro-circuits, micro-organic memory devices, micro-sensors, lab-on-a-chip/micro-total analysis systems, as well as micro-solar panels and piezoelectric devices for energy harvesting.
The electronics industry is witnessing a trend of compact devices due to high preference for consumer electronics devices. Due to which extensive adoption of micro-circuit is expected over the forthcoming years, this in turn expected to expand use of photosensitive glass in the electronics industry. Considering this scenario, the new market players may enter into the market.
Start reading instantly.
This Report and over 66,944+ more Reports, Available with Avenue Library. T&C*.
Enterprise
License/PDF
Library
Membership
*Taxes/Fees, if applicable will be added during checkout. All prices in USD
To ensure high-level data integrity, accurate analysis, and impeccable forecasts
For complete satisfaction
On-demand customization of scope of the report to exactly meet your needs
Targeted market view to provide pertinent information and save time of readers
Get insights on topics that are crucial for your business. Stay abreast of your interest areas.
Get Industry Data AlertsTo ensure high-level data integrity, accurate analysis, and impeccable forecasts
For complete satisfaction
On-demand customization of scope of the report to exactly meet your needs
Targeted market view to provide pertinent information and save time of readers