
Pneumatic Components Market Research, 2032
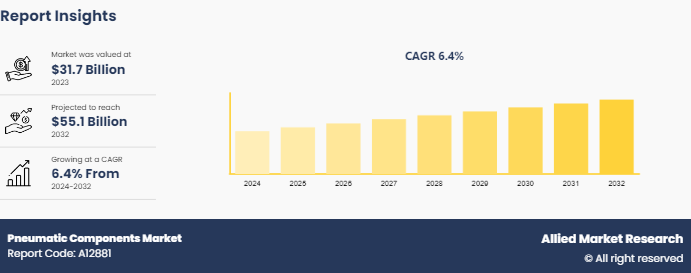
The global pneumatic components market size was valued at $31.7 billion in 2023, and is projected to reach $55.1 billion by 2032, growing at a CAGR of 6.4% from 2024 to 2032.
Market Introduction and Definition
Pneumatic components are devices and systems that use compressed air to perform mechanical work. These components include cylinders, valves, actuators, and air compressors, which convert the energy of compressed air into motion or force. Pneumatic systems are widely used in various industries for tasks such as automation, material handling, and machinery operation. They offer advantages like simplicity, reliability, and safety in hazardous environments. Common applications include operating conveyor belts, controlling industrial machinery, powering pneumatic tools, and facilitating precise movements in robotics and automation systems. Their versatility and efficiency make pneumatic components essential in modern manufacturing and industrial processes.
Key Findings
- Over 1,500 product literatures, industry releases, annual reports, and various documents from major pneumatic components market participants, along with credible industry journals, trade association releases, and government websites, have been reviewed to generate valuable industry insights.
- The pneumatic components market study covers 20 countries. The research includes a segment analysis of each country in terms of value for the projected period.
- The study integrated high-quality data, expert opinions and analysis, and crucial independent perspectives. This research approach aims to provide a balanced view of global markets and pneumatic components market overview, assisting stakeholders in making informed decisions to achieve their most ambitious growth objectives.
- Pneumatic components market news and key industry trends are also included in the report.
Market Dynamics
The pneumatic components market growth is driven by the increasing automation in manufacturing and industrial processes, which demand efficient and reliable motion control solutions. The simplicity, cost-effectiveness, and safety of pneumatic systems in hazardous environments further propel market growth. Pneumatic components are widely used in robots due to their ability to provide precise, flexible, and efficient control of movement. In robotic systems, pneumatic actuators enable smooth and variable motion, mimicking natural movements with high flexibility. They are particularly beneficial in applications requiring soft or adaptive interactions, such as in soft robotics where they replicate biological motions.
Furthermore, pneumatic cylinders and grippers are commonly used for tasks like lifting, gripping, and positioning, offering advantages such as lightweight construction, simple control mechanisms, and cost-effectiveness. Additionally, pneumatic systems can operate in environments where electric or hydraulic systems might be less suitable, such as in explosive or high-temperature settings. Soft robots are increasingly matching the application range of metal-based machines and are entering fields that pose challenges for traditional machinery. Pneumatic actuators are crucial in this advancement, enabling the creation of bioinspired motion systems. Additionally, pneumatic logic gates offer a robust alternative for managing pressure-activated soft robots, which are typically controlled by metallic valves and electric circuits. This innovation enhances the flexibility and adaptability of soft robots, broadening their potential applications. However, restraints include the need for regular maintenance, potential energy inefficiencies compared to electric systems, and noise issues associated with air compressors. Pneumatic components market opportunities lie in technological advancements, such as smart pneumatics and IoT integration, which enhance performance and monitoring capabilities.
Industrial Robots Industry Facts
As per International Federation of Robotics, the annual installations of industrial robots from 2017 to 2022 show a fluctuating trend with a significant rise in recent years. Starting at 400, 000 units in 2017, installations grew to 423, 000 in 2018, but then dropped to 387, 000 in 2019, followed by a modest recovery to 390, 000 in 2020.

Market Segmentation
The pneumatic components market is segmented on the basis of type, end use, and region. By type, the market is classified into air treatment components, pneumatic valves, pneumatic cylinders, and others. By end use, the market is classified into automotive, construction, aviation, electrical, medical, and Others. Region-wise, the pneumatic components market share is studied across areas such as North America, Europe, Asia-Pacific, and LAMEA.?
Regional/Country Market Outlook
The demand for pneumatic components in North America is driven by the region's strong industrial base, advancements in automation, and the increasing adoption of smart manufacturing technologies. Sectors such as automotive, aerospace, and healthcare are significant contributors to this demand, seeking efficient and reliable pneumatic systems for various applications. Also, this demand is shaped by stringent regulations to ensure safety and environmental compliance. In the U.S., regulations governing pneumatic components are primarily focused on ensuring safety, efficiency, and environmental protection. The Occupational Safety and Health Administration (OSHA) sets standards to ensure that pneumatic systems are safe for use in the workplace, including guidelines on proper installation, maintenance, and operation to prevent accidents and injuries. Additionally, the Environmental Protection Agency (EPA) regulates noise emissions from pneumatic equipment to mitigate environmental impact. These regulations also address energy efficiency, encouraging the use of technologies that reduce energy consumption and minimize waste. Compliance with these standards is essential for manufacturers and users to ensure operational safety, environmental responsibility, and regulatory adherence.
Competitive Landscape
Key players in the pneumatic components industry include SMC Corporation, Norgren, Inc. (IMI, PIC) , Airtac International Group, Emerson Electric Co., Bosch Rexroth AG, Festo SE & Co. KG, JELPC (Ningbo Jiaerling Pneumatic Machinery Co., Ltd.) , Parker Hannifin Corporation, Camozzi Group, and Zhaoqing Fangda Pneumatic Co. Ltd.
Key Developments
- In November 2023, SMC, a Japanese manufacturer of pneumatic control systems, announced plans to invest 40 billion yen ($265 million) by 2026 to implement a round-the-clock model at its facilities. This investment aims to halve the time required for product development. SMC, which operates technical development centers in China, the U.S., Europe, and other regions, will increase its overseas engineering workforce by 20%, targeting over 2, 000 engineers by 2026. Consequently, the proportion of engineers based in Japan will decrease from 70% to around 60%. The investment will also equip development centers with updated and standardized testing equipment, facilitating seamless data sharing.
- In May 2022, Emerson announced that its AVENTICS Series Advanced Valve (AV) system, equipped with Advanced Electronic System (AES) Profinet and Ethernet/IP, now features preinstalled Open Platform Communications Unified Architecture (OPC UA) functionality. This development makes it the first and only valve system to offer direct integration of OPC UA. The AES enhances interoperability and facilitates easier data access, while the integration of digital twin technology aims to boost productivity and efficiency.
Key Industry Trends
- In June 2024, Kirloskar Pneumatic Company Limited (KPCL) announced its plan to acquire a majority stake (over 51%) in Systems & Components India Private Ltd. (S&C) . This strategic move marks KPCL's entry into the industrial refrigeration sector, complementing its existing operations and expanding its market presence.
- In April 2024, Kirloskar Pneumatic Company Limited opened a new manufacturing facility in Nashik. The facility features a 32-tonne forge hammer for producing high-speed gear blanks and a comprehensive fabrication unit for creating base frames, pressure vessels, and heat exchangers. Primarily catering to in-house requirements to expedite project execution, the facility will also allocate approximately 25 percent of its capacity to external customers. In its first phase, the plant can produce around 6, 000 tons of forged parts (each weighing half a ton) annually and fabricate complex parts weighing up to 35 tons each.
- In February 2024, a research team at the University of Freiburg developed 3D-printed pneumatic logic modules that control the movements of soft robots using air pressure alone. These modules enable logical switching of the air flow, mimicking electrical control. This breakthrough allows for flexible, electronics-free soft robots production entirely through 3D printing using conventional filament printing material.
Key Sources Referred
- International Society of Automation (ISA)
- Fluid Power Society (FPS)
- National Fluid Power Association (NFPA)
- Pneumatic Division of the Fluid Power Association (PFPA)
- International Pneumatic Society (IPS)
- Hydraulics & Pneumatics (H&P) Magazine
- Association for Manufacturing Technology (AMT)
- European Fluid Power Committee (EFPC)
Key Benefits for Stakeholders
- The pneumatic components market report provides a quantitative analysis of the market segments, current trends, estimations, and dynamics of the Pneumatic components market analysis to identify the prevailing market opportunities.
- Market research is offered along with information related to key drivers, restraints, and opportunities.
- Porter's five forces analysis highlights the potency of buyers and suppliers to enable stakeholders to make profit-oriented business decisions and strengthen their supplier-buyer network.
- In-depth analysis of the Pneumatic components market forecast assists to determine the prevailing market opportunities.
- Major countries in each region are mapped according to their revenue contribution to the global market.
- Market player positioning facilitates benchmarking and provides a clear understanding of the present position of the market players.
- The report includes the analysis of the regional and global Pneumatic components market trends, market statistics, key players, market segments, application areas, and market growth strategies.
Pneumatic Components Market Report Highlights
| Aspects | Details |
| Market Size By 2032 | USD 55.1 Billion |
| Growth Rate | CAGR of 6.4% |
| Forecast period | 2024 - 2032 |
| Report Pages | 280 |
| By Type |
|
| By End-use |
|
| By Region |
|
| Key Market Players | SMC Corporation, JELPC (Ningbo Jiaerling Pneumatic Machinery Co., Ltd.), Bosch Rexroth AG, Norgren, Inc. (IMI, PIC), Camozzi Group, Festo SE & Co. KG,, Airtac International Group, Emerson Electric Co., Parker Hannifin Corporation, Zhaoqing Fangda Pneumatic Co. Ltd. |
Asia-Pacific is the largest regional market for Pneumatic Components.
The global pneumatic components market size was valued at $31.7 billion in 2023, and is projected to reach $55.1 billion by 2032, growing at a CAGR of 6.4% from 2024 to 2032.
Key players in the pneumatic components industry include SMC Corporation, Norgren, Inc. (IMI, PIC), Airtac International Group, Emerson Electric Co., Bosch Rexroth AG, Festo SE & Co. KG, JELPC (Ningbo Jiaerling Pneumatic Machinery Co., Ltd.), Parker Hannifin Corporation, Camozzi Group, and Zhaoqing Fangda Pneumatic Co. Ltd.
Automotive is the leading application of Pneumatic Components Market.
The pneumatic components market is driven by the increasing automation in manufacturing and industrial processes, which demand efficient and reliable motion control solutions. The simplicity, cost-effectiveness, and safety of pneumatic systems in hazardous environments further propel market growth.
Loading Table Of Content...

