0
2023
Polished Concrete Market

Polished Concrete Market

by Product (Densifiers, Sealers & Crack Fillers, Conditioners), by Method (Dry, Wet), by Construction Type (New Construction, Renovation), by End-Use (Residential, Non-Residential): Global Opportunity Analysis and Industry Forecast, 2021-2031

Report Code: A12548
Jan 2023 | Pages: 350
Tables: 174
Charts: 67
  • Formats*:

  • pdf

    Single User License, Five User
    License & Enterprise User License

  • xls

    Data Pack Excel License

  • ppt

    It comes with the additional cost
    of $2500.00 contact sales.


Polished Concrete Market Research, 2031

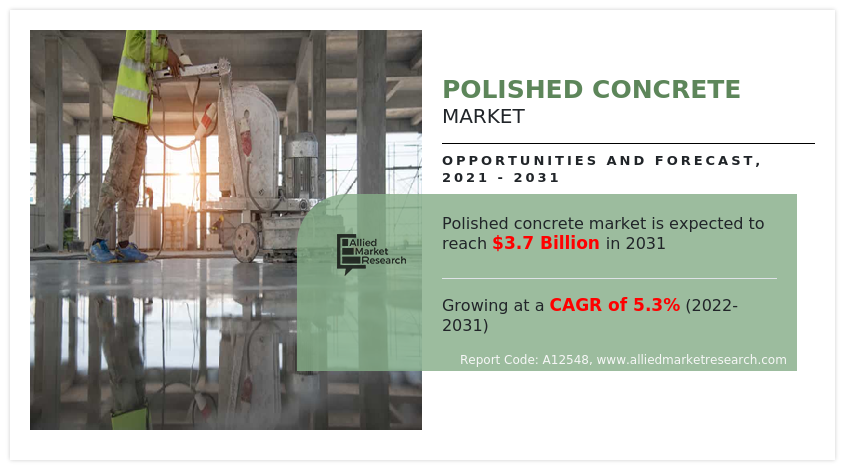
The global polished concrete market was valued at $2.2 billion in 2021 and is projected to reach $3.7 billion by 2031, growing at a CAGR of 5.3% from 2022 to 2031. Polished concrete is created by physically honing, polishing, and grinding a concrete floor with bonded abrasives to smooth up the surface. After that, it is altered for each cut until the appropriate level of look is obtained. In this procedure, a penetrant substance known as a hardener is also utilized. After penetrating the concrete, the concrete hardener triggers a chemical process that hardens and dust-proofs the surface. Concrete polishing involves processing the surface over several steps using progressively finer grinding instruments.

The COVID-19 pandemic breakout in 2020 has had a negative effect on the expansion of the polished concrete market. Several regions experienced stringent lockdowns during the epidemic, which prevented several development projects from moving forward. Additionally, the pandemic's limits on import-export transactions, shortage of raw materials, and labour shortage had a significant influence on the building sector. The market's expansion was hampered by all of these reasons during the recession.

Polished Concrete Market

One of the main reasons for the increase in demand for polished concrete is the strong demand for the construction of hotel flooring and other commercial structures. This is primarily due to the several benefits of polished concrete, which include a good visual appeal for floors and resistance to sliding and wear and tear from heavy foot traffic. Significant growth in demand is projected both in the Asia-Pacific region as well as the Middle East and Africa. The demand for polished concrete is likely to rise as a result of considerable investments in housing developments and rapid industrialization in these developing countries. A building's or facility's increased aesthetic appeal is anticipated to fuel the demand for polished concrete market size.

The cost of the raw materials and energy used to manufacture polished concrete is volatile, and this tendency is expected to continue during the forecast period. The cost of raw materials could increase due to fluctuations in the price of crude oil and petroleum products, which would subsequently increase the cost of cement, sealants, and adhesives used in polished concrete. As a result, the cost of these components has a direct impact on the cost of polished concrete. Vendors boost the price of their product's profit margins in reaction to rising raw material costs, limiting the potential of the polished concrete market share to grow.

During the forecast year, there will be a surge in the number of redevelopment and renovation projects in non-residential facilities. The structures of their establishments are also being renovated by hotel and resort owners in an effort to increase their customers and improve the accommodation experience. For instance, JW Marriott debuted a new hotel in Canberra, Australia, in September 2019. The hotel has polished concrete flooring, which further improves the visual appeal of the floors, and it has the latest design accents. Furthermore, a rise in investments from industry players in the residential construction and retail sectors is projected to hasten the use of polished concrete.

The key players for polished concrete analysis in this report include Pittsburgh Plate Glass Industries, Inc., 3M, BASF SE, Sika AG, Ultra Tech Cement Limited, The Sherwin Williams Company, Boral Limited, Solomon Colors Inc., Vexcon Chemicals Inc., and The Euclid Chemical Company.

The global polished concrete market size is segmented by product, method, construction type, end-use, and region. By product, the market is sub-segmented into densifiers, sealer & crack filler, and conditioner. By the method, the market is sub-segmented into dry and wet. By construction type, the market is classified into new construction and renovation. By end use, the market is classified into residential and non-residential. By region, the market is analyzed across North America, Europe, Asia-Pacific, and LAMEA.

The polished concrete market is segmented into Product, Method, Construction Type, and End-Use.

Polished Concrete Market

By product, the densifiers sub-segment dominated the polished concrete market in 2021. On top of the concrete slab, concrete densifiers is utilized as chemical hardener. The densifiers are used in the modification stage of slab polishing. These concrete densifiers increase the density of the slab's surface by filling its pores. Manufacturers are employing cutting-edge tactics to take a big portion of the market. For example, W.R. Meadows' Induroshine, a green concrete grinding, and polishing densifier is used to polish concrete flooring systems. This densifier is extremely long-lasting and VOC-free. The Indochine densifiers offer the flooring a dense, resilient, and visually pleasant appearance. This densifier is utilized in a range of applications, including shopping center floors, airports, schools, museums, stadiums, and warehouses.

The sealer & crack sub-segment is projected to be the fastest growing during the forecast period. For making the flooring more durable, the sealer and crack filler significantly increase the value of the polished concrete. Crack filler and sealer can be used in environments where the temperature swings a lot. As a result, polished concrete sealer and crack filler can be used in industrial and commercial settings, as well as on the exterior of homes. During the forecast period, this aspect may have a substantial impact on the polished conditioner market growth.

Polished Concrete Market

By method, the dry sub-segment dominated the polished concrete market in 2021. Higher shine, more hardening and condensing of the floor, and its effectiveness in both wide regions and small sections are all contributing factors to the polished concrete market growth. Using industrial-sized polishing machinery, the concrete surface is ground for the dry concrete polishing procedure. Different abrasive polishing discs are required for each stage of the process, frequently combining diamond grit with coarser textures for early stages and finer ones to achieve the desired shine. All these factors are predicted to boost polished concrete market share and raise demand for dry polished concrete.

Polished Concrete Market

By construction type, the new construction sub-segment dominated the global polished concrete market share in 2021. Due to the increase in demand for new construction projects such as warehouses, office buildings, and residential homes, it is projected that the new construction sub-segment of the polished concrete market size would experience rapid expansion. For instance, in the U.S., which is renowned for its burgeoning infrastructure and construction projects, $20,000 million was invested in Hudson Yards' construction in New York. One of the largest construction projects in Chelsea and Hudson Yards. In the next years, a number of these new construction projects are anticipated to boom the global polished concrete industry.

Polished Concrete Market

By end use, the non-residential sub-segment dominated the global polished concrete market share in 2021. Due to the strong demand for polished concrete from hospitals, restaurants, commercial complexes, and other locations, the non-residential sub-segment is anticipated to have the largest market share in the global industry. For example, polished concrete has a brilliant luster, a glossy appearance, outstanding performance, and long-lasting durability. During the projected period, these advantages are anticipated to fuel the polished concrete market growth of the non-residential polished concrete sub-segment.

Polished Concrete Market

By region, the North America dominated the global market in 2021. The revenue increase is attributed to reasons such as technological improvements and expansion of the construction and building sectors, rising demand for lustrous and attractive flooring systems in suburban buildings, and high demand for the construction of logistic hubs. The e-commerce industry's rapid developments have raised North America's need for additional logistical hubs and warehouses. To attract top e-commerce corporations like Amazon and Home Depot, for instance, The Atlanta Business Chronicles developers in the metro Atlanta area have constructed 18 million square feet of warehouse space. In the end, all these factors will influence polished concrete demand in North America.

Impact of COVID-19 on the Global Polished Concrete Industry

  • Since all construction projects across several nations were put on hold until further notice, the new coronavirus pandemic has had a devastating impact on a number of industries, including the polished concrete market.
  • Furthermore, the pandemic had a significant influence on human travel, supply chain disruptions, and raw material shortages. During the pandemic, there has been a surge in the movement of workers between cities and their hometowns. For instance, the construction workers in India were forced to return to their hometowns because interstate travel was prohibited.
  • Additionally, the cost of raw materials increased as a result of global supply chain problems. The demand for polished concrete, which is frequently used in building, decreased as a result of all these factors having a significant impact on the construction industry.
  • With their strategic actions, the various businesses are helping society regain control of the chaotic situation that COVID-19 has brought. As an illustration, the International Standards and Training Alliance (INSTALL) placed a focus on working with building architects and designers to specify flooring criteria for COVID-19 to assure safety on September 17, 2020.
  • For instance, the COVID-19 virus is anticipated to live and spread on porous surfaces. Contractors advise using non-porous flooring or semi-porous sheet flooring as a result. A good flooring option is polished concrete because it has a non-porous surface. Given the COVID-19 situation and the benefits mentioned above, there may be significant investment opportunities in the market.

Key Benefits For Stakeholders

  • This report provides a quantitative analysis of the polished concrete market forecast, segments, current trends, estimations, and dynamics of the polished concrete market analysis from 2021 to 2031 to identify the prevailing polished concrete market opportunities.
  • The market research is offered along with information related to key drivers, restraints, and opportunities.
  • Porter's five forces analysis highlights the potency of buyers and suppliers to enable stakeholders make profit-oriented business decisions and strengthen their supplier-buyer network.
  • In-depth analysis of the polished concrete market segmentation assists to determine the prevailing market opportunities.
  • Major countries in each region are mapped according to their revenue contribution to the global market.
  • Market player positioning facilitates benchmarking and provides a clear understanding of the present position of the market players.
  • The report includes the analysis of the regional as well as global polished concrete market trends, key players, market segments, application areas, and market growth strategies.

Polished Concrete Market Report Highlights

Aspects Details
Market Size By 2031 USD 3.7 billion
Growth Rate CAGR of 5.3%
Forecast period 2021 - 2031
Report Pages 350
By Product
  • Densifiers
  • Sealers & Crack Fillers
  • Conditioners
By Method
  • Dry
  • Wet
By Construction Type
  • New Construction
  • Renovation
By End-Use
  • Residential
  • Non-Residential
By Region
  • North America  (U.S., Canada, Mexico)
  • Europe  (Germany, United Kingdom, France, Spain, Italy, Rest of Europe)
  • Asia-Pacific  (China, Japan, India, Australia, South Korea, Rest of Asia-Pacific)
  • LAMEA  (Brazil, Saudi Arabia, UAE, South Africa, Rest of LAMEA)
Key Market Players Solomon Colors Inc., The Sherwin Williams Company, BASF SE, Ultra Tech Cement Limited, the euclid chemical company, Vexcon Chemicals, Inc., PPG Industries, Inc., Boral Limited, The 3M Company, Sika AG
 
  • CHAPTER 1:INTRODUCTION

    • 1.1.Report description

    • 1.2.Key market segments

    • 1.3.Key benefits to the stakeholders

    • 1.4.Research Methodology

      • 1.4.1.Secondary research

      • 1.4.2.Primary research

      • 1.4.3.Analyst tools and models

  • CHAPTER 2:EXECUTIVE SUMMARY

    • 2.1.Key findings of the study

    • 2.2.CXO Perspective

  • CHAPTER 3:MARKET OVERVIEW

    • 3.1.Market definition and scope

    • 3.2.Key findings

      • 3.2.1.Top investment pockets

    • 3.3.Porter’s five forces analysis

    • 3.4.Market dynamics

      • 3.4.1.Drivers

      • 3.4.2.Restraints

      • 3.4.3.Opportunities

    • 3.5.COVID-19 Impact Analysis on the market

    • 3.6.Value Chain Analysis

    • 3.7.Key Regulation Analysis

    • 3.8.Patent Landscape

    • 3.9.Market Share Analysis

    • 3.10.Regulatory Guidelines

  • CHAPTER 4: POLISHED CONCRETE MARKET, BY PRODUCT

    • 4.1 Overview

      • 4.1.1 Market size and forecast

    • 4.2. Densifiers

      • 4.2.1 Key market trends, growth factors and opportunities

      • 4.2.2 Market size and forecast, by region

      • 4.2.3 Market share analysis by country

    • 4.3. Sealers & Crack Fillers

      • 4.3.1 Key market trends, growth factors and opportunities

      • 4.3.2 Market size and forecast, by region

      • 4.3.3 Market share analysis by country

    • 4.4. Conditioners

      • 4.4.1 Key market trends, growth factors and opportunities

      • 4.4.2 Market size and forecast, by region

      • 4.4.3 Market share analysis by country

  • CHAPTER 5: POLISHED CONCRETE MARKET, BY METHOD

    • 5.1 Overview

      • 5.1.1 Market size and forecast

    • 5.2. Dry

      • 5.2.1 Key market trends, growth factors and opportunities

      • 5.2.2 Market size and forecast, by region

      • 5.2.3 Market share analysis by country

    • 5.3. Wet

      • 5.3.1 Key market trends, growth factors and opportunities

      • 5.3.2 Market size and forecast, by region

      • 5.3.3 Market share analysis by country

  • CHAPTER 6: POLISHED CONCRETE MARKET, BY CONSTRUCTION TYPE

    • 6.1 Overview

      • 6.1.1 Market size and forecast

    • 6.2. New Construction

      • 6.2.1 Key market trends, growth factors and opportunities

      • 6.2.2 Market size and forecast, by region

      • 6.2.3 Market share analysis by country

    • 6.3. Renovation

      • 6.3.1 Key market trends, growth factors and opportunities

      • 6.3.2 Market size and forecast, by region

      • 6.3.3 Market share analysis by country

  • CHAPTER 7: POLISHED CONCRETE MARKET, BY END-USE

    • 7.1 Overview

      • 7.1.1 Market size and forecast

    • 7.2. Residential

      • 7.2.1 Key market trends, growth factors and opportunities

      • 7.2.2 Market size and forecast, by region

      • 7.2.3 Market share analysis by country

    • 7.3. Non-Residential

      • 7.3.1 Key market trends, growth factors and opportunities

      • 7.3.2 Market size and forecast, by region

      • 7.3.3 Market share analysis by country

  • CHAPTER 8: POLISHED CONCRETE MARKET, BY REGION

    • 8.1 Overview

      • 8.1.1 Market size and forecast

    • 8.2 North America

      • 8.2.1 Key trends and opportunities

      • 8.2.2 North America Market size and forecast, by Product

      • 8.2.3 North America Market size and forecast, by Method

      • 8.2.4 North America Market size and forecast, by Construction Type

      • 8.2.5 North America Market size and forecast, by End-Use

      • 8.2.6 North America Market size and forecast, by country

        • 8.2.6.1 U.S.
          • 8.2.6.1.1 Key market trends, growth factors and opportunities
          • 8.2.6.1.2 Market size and forecast, by Product
          • 8.2.6.1.3 Market size and forecast, by Method
          • 8.2.6.1.4 Market size and forecast, by Construction Type
          • 8.2.6.1.5 Market size and forecast, by End-Use
        • 8.2.6.2 Canada
          • 8.2.6.2.1 Key market trends, growth factors and opportunities
          • 8.2.6.2.2 Market size and forecast, by Product
          • 8.2.6.2.3 Market size and forecast, by Method
          • 8.2.6.2.4 Market size and forecast, by Construction Type
          • 8.2.6.2.5 Market size and forecast, by End-Use
        • 8.2.6.3 Mexico
          • 8.2.6.3.1 Key market trends, growth factors and opportunities
          • 8.2.6.3.2 Market size and forecast, by Product
          • 8.2.6.3.3 Market size and forecast, by Method
          • 8.2.6.3.4 Market size and forecast, by Construction Type
          • 8.2.6.3.5 Market size and forecast, by End-Use
    • 8.3 Europe

      • 8.3.1 Key trends and opportunities

      • 8.3.2 Europe Market size and forecast, by Product

      • 8.3.3 Europe Market size and forecast, by Method

      • 8.3.4 Europe Market size and forecast, by Construction Type

      • 8.3.5 Europe Market size and forecast, by End-Use

      • 8.3.6 Europe Market size and forecast, by country

        • 8.3.6.1 Germany
          • 8.3.6.1.1 Key market trends, growth factors and opportunities
          • 8.3.6.1.2 Market size and forecast, by Product
          • 8.3.6.1.3 Market size and forecast, by Method
          • 8.3.6.1.4 Market size and forecast, by Construction Type
          • 8.3.6.1.5 Market size and forecast, by End-Use
        • 8.3.6.2 United Kingdom
          • 8.3.6.2.1 Key market trends, growth factors and opportunities
          • 8.3.6.2.2 Market size and forecast, by Product
          • 8.3.6.2.3 Market size and forecast, by Method
          • 8.3.6.2.4 Market size and forecast, by Construction Type
          • 8.3.6.2.5 Market size and forecast, by End-Use
        • 8.3.6.3 France
          • 8.3.6.3.1 Key market trends, growth factors and opportunities
          • 8.3.6.3.2 Market size and forecast, by Product
          • 8.3.6.3.3 Market size and forecast, by Method
          • 8.3.6.3.4 Market size and forecast, by Construction Type
          • 8.3.6.3.5 Market size and forecast, by End-Use
        • 8.3.6.4 Spain
          • 8.3.6.4.1 Key market trends, growth factors and opportunities
          • 8.3.6.4.2 Market size and forecast, by Product
          • 8.3.6.4.3 Market size and forecast, by Method
          • 8.3.6.4.4 Market size and forecast, by Construction Type
          • 8.3.6.4.5 Market size and forecast, by End-Use
        • 8.3.6.5 Italy
          • 8.3.6.5.1 Key market trends, growth factors and opportunities
          • 8.3.6.5.2 Market size and forecast, by Product
          • 8.3.6.5.3 Market size and forecast, by Method
          • 8.3.6.5.4 Market size and forecast, by Construction Type
          • 8.3.6.5.5 Market size and forecast, by End-Use
        • 8.3.6.6 Rest of Europe
          • 8.3.6.6.1 Key market trends, growth factors and opportunities
          • 8.3.6.6.2 Market size and forecast, by Product
          • 8.3.6.6.3 Market size and forecast, by Method
          • 8.3.6.6.4 Market size and forecast, by Construction Type
          • 8.3.6.6.5 Market size and forecast, by End-Use
    • 8.4 Asia-Pacific

      • 8.4.1 Key trends and opportunities

      • 8.4.2 Asia-Pacific Market size and forecast, by Product

      • 8.4.3 Asia-Pacific Market size and forecast, by Method

      • 8.4.4 Asia-Pacific Market size and forecast, by Construction Type

      • 8.4.5 Asia-Pacific Market size and forecast, by End-Use

      • 8.4.6 Asia-Pacific Market size and forecast, by country

        • 8.4.6.1 China
          • 8.4.6.1.1 Key market trends, growth factors and opportunities
          • 8.4.6.1.2 Market size and forecast, by Product
          • 8.4.6.1.3 Market size and forecast, by Method
          • 8.4.6.1.4 Market size and forecast, by Construction Type
          • 8.4.6.1.5 Market size and forecast, by End-Use
        • 8.4.6.2 Japan
          • 8.4.6.2.1 Key market trends, growth factors and opportunities
          • 8.4.6.2.2 Market size and forecast, by Product
          • 8.4.6.2.3 Market size and forecast, by Method
          • 8.4.6.2.4 Market size and forecast, by Construction Type
          • 8.4.6.2.5 Market size and forecast, by End-Use
        • 8.4.6.3 India
          • 8.4.6.3.1 Key market trends, growth factors and opportunities
          • 8.4.6.3.2 Market size and forecast, by Product
          • 8.4.6.3.3 Market size and forecast, by Method
          • 8.4.6.3.4 Market size and forecast, by Construction Type
          • 8.4.6.3.5 Market size and forecast, by End-Use
        • 8.4.6.4 Australia
          • 8.4.6.4.1 Key market trends, growth factors and opportunities
          • 8.4.6.4.2 Market size and forecast, by Product
          • 8.4.6.4.3 Market size and forecast, by Method
          • 8.4.6.4.4 Market size and forecast, by Construction Type
          • 8.4.6.4.5 Market size and forecast, by End-Use
        • 8.4.6.5 South Korea
          • 8.4.6.5.1 Key market trends, growth factors and opportunities
          • 8.4.6.5.2 Market size and forecast, by Product
          • 8.4.6.5.3 Market size and forecast, by Method
          • 8.4.6.5.4 Market size and forecast, by Construction Type
          • 8.4.6.5.5 Market size and forecast, by End-Use
        • 8.4.6.6 Rest of Asia-Pacific
          • 8.4.6.6.1 Key market trends, growth factors and opportunities
          • 8.4.6.6.2 Market size and forecast, by Product
          • 8.4.6.6.3 Market size and forecast, by Method
          • 8.4.6.6.4 Market size and forecast, by Construction Type
          • 8.4.6.6.5 Market size and forecast, by End-Use
    • 8.5 LAMEA

      • 8.5.1 Key trends and opportunities

      • 8.5.2 LAMEA Market size and forecast, by Product

      • 8.5.3 LAMEA Market size and forecast, by Method

      • 8.5.4 LAMEA Market size and forecast, by Construction Type

      • 8.5.5 LAMEA Market size and forecast, by End-Use

      • 8.5.6 LAMEA Market size and forecast, by country

        • 8.5.6.1 Brazil
          • 8.5.6.1.1 Key market trends, growth factors and opportunities
          • 8.5.6.1.2 Market size and forecast, by Product
          • 8.5.6.1.3 Market size and forecast, by Method
          • 8.5.6.1.4 Market size and forecast, by Construction Type
          • 8.5.6.1.5 Market size and forecast, by End-Use
        • 8.5.6.2 Saudi Arabia
          • 8.5.6.2.1 Key market trends, growth factors and opportunities
          • 8.5.6.2.2 Market size and forecast, by Product
          • 8.5.6.2.3 Market size and forecast, by Method
          • 8.5.6.2.4 Market size and forecast, by Construction Type
          • 8.5.6.2.5 Market size and forecast, by End-Use
        • 8.5.6.3 UAE
          • 8.5.6.3.1 Key market trends, growth factors and opportunities
          • 8.5.6.3.2 Market size and forecast, by Product
          • 8.5.6.3.3 Market size and forecast, by Method
          • 8.5.6.3.4 Market size and forecast, by Construction Type
          • 8.5.6.3.5 Market size and forecast, by End-Use
        • 8.5.6.4 South Africa
          • 8.5.6.4.1 Key market trends, growth factors and opportunities
          • 8.5.6.4.2 Market size and forecast, by Product
          • 8.5.6.4.3 Market size and forecast, by Method
          • 8.5.6.4.4 Market size and forecast, by Construction Type
          • 8.5.6.4.5 Market size and forecast, by End-Use
        • 8.5.6.5 Rest of LAMEA
          • 8.5.6.5.1 Key market trends, growth factors and opportunities
          • 8.5.6.5.2 Market size and forecast, by Product
          • 8.5.6.5.3 Market size and forecast, by Method
          • 8.5.6.5.4 Market size and forecast, by Construction Type
          • 8.5.6.5.5 Market size and forecast, by End-Use
  • CHAPTER 9: COMPETITIVE LANDSCAPE

    • 9.1. Introduction

    • 9.2. Top winning strategies

    • 9.3. Product Mapping of Top 10 Player

    • 9.4. Competitive Dashboard

    • 9.5. Competitive Heatmap

    • 9.6. Top player positioning, 2021

  • CHAPTER 10: COMPANY PROFILES

    • 10.1 PPG Industries, Inc.

      • 10.1.1 Company overview

      • 10.1.2 Key Executives

      • 10.1.3 Company snapshot

      • 10.1.4 Operating business segments

      • 10.1.5 Product portfolio

      • 10.1.6 Business performance

      • 10.1.7 Key strategic moves and developments

    • 10.2 The 3M Company

      • 10.2.1 Company overview

      • 10.2.2 Key Executives

      • 10.2.3 Company snapshot

      • 10.2.4 Operating business segments

      • 10.2.5 Product portfolio

      • 10.2.6 Business performance

      • 10.2.7 Key strategic moves and developments

    • 10.3 BASF SE

      • 10.3.1 Company overview

      • 10.3.2 Key Executives

      • 10.3.3 Company snapshot

      • 10.3.4 Operating business segments

      • 10.3.5 Product portfolio

      • 10.3.6 Business performance

      • 10.3.7 Key strategic moves and developments

    • 10.4 Sika AG

      • 10.4.1 Company overview

      • 10.4.2 Key Executives

      • 10.4.3 Company snapshot

      • 10.4.4 Operating business segments

      • 10.4.5 Product portfolio

      • 10.4.6 Business performance

      • 10.4.7 Key strategic moves and developments

    • 10.5 Ultra Tech Cement Limited

      • 10.5.1 Company overview

      • 10.5.2 Key Executives

      • 10.5.3 Company snapshot

      • 10.5.4 Operating business segments

      • 10.5.5 Product portfolio

      • 10.5.6 Business performance

      • 10.5.7 Key strategic moves and developments

    • 10.6 The Sherwin Williams Company

      • 10.6.1 Company overview

      • 10.6.2 Key Executives

      • 10.6.3 Company snapshot

      • 10.6.4 Operating business segments

      • 10.6.5 Product portfolio

      • 10.6.6 Business performance

      • 10.6.7 Key strategic moves and developments

    • 10.7 Boral Limited

      • 10.7.1 Company overview

      • 10.7.2 Key Executives

      • 10.7.3 Company snapshot

      • 10.7.4 Operating business segments

      • 10.7.5 Product portfolio

      • 10.7.6 Business performance

      • 10.7.7 Key strategic moves and developments

    • 10.8 Solomon Colors Inc.

      • 10.8.1 Company overview

      • 10.8.2 Key Executives

      • 10.8.3 Company snapshot

      • 10.8.4 Operating business segments

      • 10.8.5 Product portfolio

      • 10.8.6 Business performance

      • 10.8.7 Key strategic moves and developments

    • 10.9 Vexcon Chemicals, Inc.

      • 10.9.1 Company overview

      • 10.9.2 Key Executives

      • 10.9.3 Company snapshot

      • 10.9.4 Operating business segments

      • 10.9.5 Product portfolio

      • 10.9.6 Business performance

      • 10.9.7 Key strategic moves and developments

    • 10.10 the euclid chemical company

      • 10.10.1 Company overview

      • 10.10.2 Key Executives

      • 10.10.3 Company snapshot

      • 10.10.4 Operating business segments

      • 10.10.5 Product portfolio

      • 10.10.6 Business performance

      • 10.10.7 Key strategic moves and developments

  • LIST OF TABLES

  • TABLE 1. GLOBAL POLISHED CONCRETE MARKET, BY PRODUCT, 2021-2031 (REVENUE, $MILLION)
    TABLE 2. POLISHED CONCRETE MARKET FOR DENSIFIERS, BY REGION, 2021-2031 (REVENUE, $MILLION)
    TABLE 3. POLISHED CONCRETE MARKET FOR SEALERS & CRACK FILLERS, BY REGION, 2021-2031 (REVENUE, $MILLION)
    TABLE 4. POLISHED CONCRETE MARKET FOR CONDITIONERS, BY REGION, 2021-2031 (REVENUE, $MILLION)
    TABLE 5. GLOBAL POLISHED CONCRETE MARKET, BY METHOD, 2021-2031 (REVENUE, $MILLION)
    TABLE 6. POLISHED CONCRETE MARKET FOR DRY, BY REGION, 2021-2031 (REVENUE, $MILLION)
    TABLE 7. POLISHED CONCRETE MARKET FOR WET, BY REGION, 2021-2031 (REVENUE, $MILLION)
    TABLE 8. GLOBAL POLISHED CONCRETE MARKET, BY CONSTRUCTION TYPE, 2021-2031 (REVENUE, $MILLION)
    TABLE 9. POLISHED CONCRETE MARKET FOR NEW CONSTRUCTION, BY REGION, 2021-2031 (REVENUE, $MILLION)
    TABLE 10. POLISHED CONCRETE MARKET FOR RENOVATION, BY REGION, 2021-2031 (REVENUE, $MILLION)
    TABLE 11. GLOBAL POLISHED CONCRETE MARKET, BY END-USE, 2021-2031 (REVENUE, $MILLION)
    TABLE 12. POLISHED CONCRETE MARKET FOR RESIDENTIAL, BY REGION, 2021-2031 (REVENUE, $MILLION)
    TABLE 13. POLISHED CONCRETE MARKET FOR NON-RESIDENTIAL, BY REGION, 2021-2031 (REVENUE, $MILLION)
    TABLE 14. POLISHED CONCRETE MARKET, BY REGION, 2021-2031 (REVENUE, $MILLION)
    TABLE 15. NORTH AMERICA POLISHED CONCRETE MARKET, BY PRODUCT, 2021-2031 (REVENUE, $MILLION)
    TABLE 16. NORTH AMERICA POLISHED CONCRETE MARKET, BY METHOD, 2021-2031 (REVENUE, $MILLION)
    TABLE 17. NORTH AMERICA POLISHED CONCRETE MARKET, BY CONSTRUCTION TYPE, 2021-2031 (REVENUE, $MILLION)
    TABLE 18. NORTH AMERICA POLISHED CONCRETE MARKET, BY END-USE, 2021-2031 (REVENUE, $MILLION)
    TABLE 19. NORTH AMERICA POLISHED CONCRETE MARKET, BY COUNTRY, 2021-2031 (REVENUE, $MILLION)
    TABLE 20. U.S. POLISHED CONCRETE MARKET, BY PRODUCT, 2021-2031 (REVENUE, $MILLION)
    TABLE 21. U.S. POLISHED CONCRETE MARKET, BY METHOD, 2021-2031 (REVENUE, $MILLION)
    TABLE 22. U.S. POLISHED CONCRETE MARKET, BY CONSTRUCTION TYPE, 2021-2031 (REVENUE, $MILLION)
    TABLE 23. U.S. POLISHED CONCRETE MARKET, BY END-USE, 2021-2031 (REVENUE, $MILLION)
    TABLE 24. CANADA POLISHED CONCRETE MARKET, BY PRODUCT, 2021-2031 (REVENUE, $MILLION)
    TABLE 25. CANADA POLISHED CONCRETE MARKET, BY METHOD, 2021-2031 (REVENUE, $MILLION)
    TABLE 26. CANADA POLISHED CONCRETE MARKET, BY CONSTRUCTION TYPE, 2021-2031 (REVENUE, $MILLION)
    TABLE 27. CANADA POLISHED CONCRETE MARKET, BY END-USE, 2021-2031 (REVENUE, $MILLION)
    TABLE 28. MEXICO POLISHED CONCRETE MARKET, BY PRODUCT, 2021-2031 (REVENUE, $MILLION)
    TABLE 29. MEXICO POLISHED CONCRETE MARKET, BY METHOD, 2021-2031 (REVENUE, $MILLION)
    TABLE 30. MEXICO POLISHED CONCRETE MARKET, BY CONSTRUCTION TYPE, 2021-2031 (REVENUE, $MILLION)
    TABLE 31. MEXICO POLISHED CONCRETE MARKET, BY END-USE, 2021-2031 (REVENUE, $MILLION)
    TABLE 32. EUROPE POLISHED CONCRETE MARKET, BY PRODUCT, 2021-2031 (REVENUE, $MILLION)
    TABLE 33. EUROPE POLISHED CONCRETE MARKET, BY METHOD, 2021-2031 (REVENUE, $MILLION)
    TABLE 34. EUROPE POLISHED CONCRETE MARKET, BY CONSTRUCTION TYPE, 2021-2031 (REVENUE, $MILLION)
    TABLE 35. EUROPE POLISHED CONCRETE MARKET, BY END-USE, 2021-2031 (REVENUE, $MILLION)
    TABLE 36. EUROPE POLISHED CONCRETE MARKET, BY COUNTRY, 2021-2031 (REVENUE, $MILLION)
    TABLE 37. GERMANY POLISHED CONCRETE MARKET, BY PRODUCT, 2021-2031 (REVENUE, $MILLION)
    TABLE 38. GERMANY POLISHED CONCRETE MARKET, BY METHOD, 2021-2031 (REVENUE, $MILLION)
    TABLE 39. GERMANY POLISHED CONCRETE MARKET, BY CONSTRUCTION TYPE, 2021-2031 (REVENUE, $MILLION)
    TABLE 40. GERMANY POLISHED CONCRETE MARKET, BY END-USE, 2021-2031 (REVENUE, $MILLION)
    TABLE 41. UNITED KINGDOM POLISHED CONCRETE MARKET, BY PRODUCT, 2021-2031 (REVENUE, $MILLION)
    TABLE 42. UNITED KINGDOM POLISHED CONCRETE MARKET, BY METHOD, 2021-2031 (REVENUE, $MILLION)
    TABLE 43. UNITED KINGDOM POLISHED CONCRETE MARKET, BY CONSTRUCTION TYPE, 2021-2031 (REVENUE, $MILLION)
    TABLE 44. UNITED KINGDOM POLISHED CONCRETE MARKET, BY END-USE, 2021-2031 (REVENUE, $MILLION)
    TABLE 45. FRANCE POLISHED CONCRETE MARKET, BY PRODUCT, 2021-2031 (REVENUE, $MILLION)
    TABLE 46. FRANCE POLISHED CONCRETE MARKET, BY METHOD, 2021-2031 (REVENUE, $MILLION)
    TABLE 47. FRANCE POLISHED CONCRETE MARKET, BY CONSTRUCTION TYPE, 2021-2031 (REVENUE, $MILLION)
    TABLE 48. FRANCE POLISHED CONCRETE MARKET, BY END-USE, 2021-2031 (REVENUE, $MILLION)
    TABLE 49. SPAIN POLISHED CONCRETE MARKET, BY PRODUCT, 2021-2031 (REVENUE, $MILLION)
    TABLE 50. SPAIN POLISHED CONCRETE MARKET, BY METHOD, 2021-2031 (REVENUE, $MILLION)
    TABLE 51. SPAIN POLISHED CONCRETE MARKET, BY CONSTRUCTION TYPE, 2021-2031 (REVENUE, $MILLION)
    TABLE 52. SPAIN POLISHED CONCRETE MARKET, BY END-USE, 2021-2031 (REVENUE, $MILLION)
    TABLE 53. ITALY POLISHED CONCRETE MARKET, BY PRODUCT, 2021-2031 (REVENUE, $MILLION)
    TABLE 54. ITALY POLISHED CONCRETE MARKET, BY METHOD, 2021-2031 (REVENUE, $MILLION)
    TABLE 55. ITALY POLISHED CONCRETE MARKET, BY CONSTRUCTION TYPE, 2021-2031 (REVENUE, $MILLION)
    TABLE 56. ITALY POLISHED CONCRETE MARKET, BY END-USE, 2021-2031 (REVENUE, $MILLION)
    TABLE 57. REST OF EUROPE POLISHED CONCRETE MARKET, BY PRODUCT, 2021-2031 (REVENUE, $MILLION)
    TABLE 58. REST OF EUROPE POLISHED CONCRETE MARKET, BY METHOD, 2021-2031 (REVENUE, $MILLION)
    TABLE 59. REST OF EUROPE POLISHED CONCRETE MARKET, BY CONSTRUCTION TYPE, 2021-2031 (REVENUE, $MILLION)
    TABLE 60. REST OF EUROPE POLISHED CONCRETE MARKET, BY END-USE, 2021-2031 (REVENUE, $MILLION)
    TABLE 61. ASIA-PACIFIC POLISHED CONCRETE MARKET, BY PRODUCT, 2021-2031 (REVENUE, $MILLION)
    TABLE 62. ASIA-PACIFIC POLISHED CONCRETE MARKET, BY METHOD, 2021-2031 (REVENUE, $MILLION)
    TABLE 63. ASIA-PACIFIC POLISHED CONCRETE MARKET, BY CONSTRUCTION TYPE, 2021-2031 (REVENUE, $MILLION)
    TABLE 64. ASIA-PACIFIC POLISHED CONCRETE MARKET, BY END-USE, 2021-2031 (REVENUE, $MILLION)
    TABLE 65. ASIA-PACIFIC POLISHED CONCRETE MARKET, BY COUNTRY, 2021-2031 (REVENUE, $MILLION)
    TABLE 66. CHINA POLISHED CONCRETE MARKET, BY PRODUCT, 2021-2031 (REVENUE, $MILLION)
    TABLE 67. CHINA POLISHED CONCRETE MARKET, BY METHOD, 2021-2031 (REVENUE, $MILLION)
    TABLE 68. CHINA POLISHED CONCRETE MARKET, BY CONSTRUCTION TYPE, 2021-2031 (REVENUE, $MILLION)
    TABLE 69. CHINA POLISHED CONCRETE MARKET, BY END-USE, 2021-2031 (REVENUE, $MILLION)
    TABLE 70. JAPAN POLISHED CONCRETE MARKET, BY PRODUCT, 2021-2031 (REVENUE, $MILLION)
    TABLE 71. JAPAN POLISHED CONCRETE MARKET, BY METHOD, 2021-2031 (REVENUE, $MILLION)
    TABLE 72. JAPAN POLISHED CONCRETE MARKET, BY CONSTRUCTION TYPE, 2021-2031 (REVENUE, $MILLION)
    TABLE 73. JAPAN POLISHED CONCRETE MARKET, BY END-USE, 2021-2031 (REVENUE, $MILLION)
    TABLE 74. INDIA POLISHED CONCRETE MARKET, BY PRODUCT, 2021-2031 (REVENUE, $MILLION)
    TABLE 75. INDIA POLISHED CONCRETE MARKET, BY METHOD, 2021-2031 (REVENUE, $MILLION)
    TABLE 76. INDIA POLISHED CONCRETE MARKET, BY CONSTRUCTION TYPE, 2021-2031 (REVENUE, $MILLION)
    TABLE 77. INDIA POLISHED CONCRETE MARKET, BY END-USE, 2021-2031 (REVENUE, $MILLION)
    TABLE 78. AUSTRALIA POLISHED CONCRETE MARKET, BY PRODUCT, 2021-2031 (REVENUE, $MILLION)
    TABLE 79. AUSTRALIA POLISHED CONCRETE MARKET, BY METHOD, 2021-2031 (REVENUE, $MILLION)
    TABLE 80. AUSTRALIA POLISHED CONCRETE MARKET, BY CONSTRUCTION TYPE, 2021-2031 (REVENUE, $MILLION)
    TABLE 81. AUSTRALIA POLISHED CONCRETE MARKET, BY END-USE, 2021-2031 (REVENUE, $MILLION)
    TABLE 82. SOUTH KOREA POLISHED CONCRETE MARKET, BY PRODUCT, 2021-2031 (REVENUE, $MILLION)
    TABLE 83. SOUTH KOREA POLISHED CONCRETE MARKET, BY METHOD, 2021-2031 (REVENUE, $MILLION)
    TABLE 84. SOUTH KOREA POLISHED CONCRETE MARKET, BY CONSTRUCTION TYPE, 2021-2031 (REVENUE, $MILLION)
    TABLE 85. SOUTH KOREA POLISHED CONCRETE MARKET, BY END-USE, 2021-2031 (REVENUE, $MILLION)
    TABLE 86. REST OF ASIA-PACIFIC POLISHED CONCRETE MARKET, BY PRODUCT, 2021-2031 (REVENUE, $MILLION)
    TABLE 87. REST OF ASIA-PACIFIC POLISHED CONCRETE MARKET, BY METHOD, 2021-2031 (REVENUE, $MILLION)
    TABLE 88. REST OF ASIA-PACIFIC POLISHED CONCRETE MARKET, BY CONSTRUCTION TYPE, 2021-2031 (REVENUE, $MILLION)
    TABLE 89. REST OF ASIA-PACIFIC POLISHED CONCRETE MARKET, BY END-USE, 2021-2031 (REVENUE, $MILLION)
    TABLE 90. LAMEA POLISHED CONCRETE MARKET, BY PRODUCT, 2021-2031 (REVENUE, $MILLION)
    TABLE 91. LAMEA POLISHED CONCRETE MARKET, BY METHOD, 2021-2031 (REVENUE, $MILLION)
    TABLE 92. LAMEA POLISHED CONCRETE MARKET, BY CONSTRUCTION TYPE, 2021-2031 (REVENUE, $MILLION)
    TABLE 93. LAMEA POLISHED CONCRETE MARKET, BY END-USE, 2021-2031 (REVENUE, $MILLION)
    TABLE 94. LAMEA POLISHED CONCRETE MARKET, BY COUNTRY, 2021-2031 (REVENUE, $MILLION)
    TABLE 95. BRAZIL POLISHED CONCRETE MARKET, BY PRODUCT, 2021-2031 (REVENUE, $MILLION)
    TABLE 96. BRAZIL POLISHED CONCRETE MARKET, BY METHOD, 2021-2031 (REVENUE, $MILLION)
    TABLE 97. BRAZIL POLISHED CONCRETE MARKET, BY CONSTRUCTION TYPE, 2021-2031 (REVENUE, $MILLION)
    TABLE 98. BRAZIL POLISHED CONCRETE MARKET, BY END-USE, 2021-2031 (REVENUE, $MILLION)
    TABLE 99. SAUDI ARABIA POLISHED CONCRETE MARKET, BY PRODUCT, 2021-2031 (REVENUE, $MILLION)
    TABLE 100. SAUDI ARABIA POLISHED CONCRETE MARKET, BY METHOD, 2021-2031 (REVENUE, $MILLION)
    TABLE 101. SAUDI ARABIA POLISHED CONCRETE MARKET, BY CONSTRUCTION TYPE, 2021-2031 (REVENUE, $MILLION)
    TABLE 102. SAUDI ARABIA POLISHED CONCRETE MARKET, BY END-USE, 2021-2031 (REVENUE, $MILLION)
    TABLE 103. UAE POLISHED CONCRETE MARKET, BY PRODUCT, 2021-2031 (REVENUE, $MILLION)
    TABLE 104. UAE POLISHED CONCRETE MARKET, BY METHOD, 2021-2031 (REVENUE, $MILLION)
    TABLE 105. UAE POLISHED CONCRETE MARKET, BY CONSTRUCTION TYPE, 2021-2031 (REVENUE, $MILLION)
    TABLE 106. UAE POLISHED CONCRETE MARKET, BY END-USE, 2021-2031 (REVENUE, $MILLION)
    TABLE 107. SOUTH AFRICA POLISHED CONCRETE MARKET, BY PRODUCT, 2021-2031 (REVENUE, $MILLION)
    TABLE 108. SOUTH AFRICA POLISHED CONCRETE MARKET, BY METHOD, 2021-2031 (REVENUE, $MILLION)
    TABLE 109. SOUTH AFRICA POLISHED CONCRETE MARKET, BY CONSTRUCTION TYPE, 2021-2031 (REVENUE, $MILLION)
    TABLE 110. SOUTH AFRICA POLISHED CONCRETE MARKET, BY END-USE, 2021-2031 (REVENUE, $MILLION)
    TABLE 111. REST OF LAMEA POLISHED CONCRETE MARKET, BY PRODUCT, 2021-2031 (REVENUE, $MILLION)
    TABLE 112. REST OF LAMEA POLISHED CONCRETE MARKET, BY METHOD, 2021-2031 (REVENUE, $MILLION)
    TABLE 113. REST OF LAMEA POLISHED CONCRETE MARKET, BY CONSTRUCTION TYPE, 2021-2031 (REVENUE, $MILLION)
    TABLE 114. REST OF LAMEA POLISHED CONCRETE MARKET, BY END-USE, 2021-2031 (REVENUE, $MILLION)
    TABLE 115. PPG INDUSTRIES, INC.: KEY EXECUTIVES
    TABLE 116. PPG INDUSTRIES, INC.: COMPANY SNAPSHOT
    TABLE 117. PPG INDUSTRIES, INC.: OPERATING SEGMENTS
    TABLE 118. PPG INDUSTRIES, INC.: PRODUCT PORTFOLIO
    TABLE 119. PPG INDUSTRIES, INC.: NET SALES
    TABLE 120. PPG INDUSTRIES, INC.: KEY STRATERGIES
    TABLE 121. THE 3M COMPANY: KEY EXECUTIVES
    TABLE 122. THE 3M COMPANY: COMPANY SNAPSHOT
    TABLE 123. THE 3M COMPANY: OPERATING SEGMENTS
    TABLE 124. THE 3M COMPANY: PRODUCT PORTFOLIO
    TABLE 125. THE 3M COMPANY: NET SALES
    TABLE 126. THE 3M COMPANY: KEY STRATERGIES
    TABLE 127. BASF SE: KEY EXECUTIVES
    TABLE 128. BASF SE: COMPANY SNAPSHOT
    TABLE 129. BASF SE: OPERATING SEGMENTS
    TABLE 130. BASF SE: PRODUCT PORTFOLIO
    TABLE 131. BASF SE: NET SALES
    TABLE 132. BASF SE: KEY STRATERGIES
    TABLE 133. SIKA AG: KEY EXECUTIVES
    TABLE 134. SIKA AG: COMPANY SNAPSHOT
    TABLE 135. SIKA AG: OPERATING SEGMENTS
    TABLE 136. SIKA AG: PRODUCT PORTFOLIO
    TABLE 137. SIKA AG: NET SALES
    TABLE 138. SIKA AG: KEY STRATERGIES
    TABLE 139. ULTRA TECH CEMENT LIMITED: KEY EXECUTIVES
    TABLE 140. ULTRA TECH CEMENT LIMITED: COMPANY SNAPSHOT
    TABLE 141. ULTRA TECH CEMENT LIMITED: OPERATING SEGMENTS
    TABLE 142. ULTRA TECH CEMENT LIMITED: PRODUCT PORTFOLIO
    TABLE 143. ULTRA TECH CEMENT LIMITED: NET SALES
    TABLE 144. ULTRA TECH CEMENT LIMITED: KEY STRATERGIES
    TABLE 145. THE SHERWIN WILLIAMS COMPANY: KEY EXECUTIVES
    TABLE 146. THE SHERWIN WILLIAMS COMPANY: COMPANY SNAPSHOT
    TABLE 147. THE SHERWIN WILLIAMS COMPANY: OPERATING SEGMENTS
    TABLE 148. THE SHERWIN WILLIAMS COMPANY: PRODUCT PORTFOLIO
    TABLE 149. THE SHERWIN WILLIAMS COMPANY: NET SALES
    TABLE 150. THE SHERWIN WILLIAMS COMPANY: KEY STRATERGIES
    TABLE 151. BORAL LIMITED: KEY EXECUTIVES
    TABLE 152. BORAL LIMITED: COMPANY SNAPSHOT
    TABLE 153. BORAL LIMITED: OPERATING SEGMENTS
    TABLE 154. BORAL LIMITED: PRODUCT PORTFOLIO
    TABLE 155. BORAL LIMITED: NET SALES
    TABLE 156. BORAL LIMITED: KEY STRATERGIES
    TABLE 157. SOLOMON COLORS INC.: KEY EXECUTIVES
    TABLE 158. SOLOMON COLORS INC.: COMPANY SNAPSHOT
    TABLE 159. SOLOMON COLORS INC.: OPERATING SEGMENTS
    TABLE 160. SOLOMON COLORS INC.: PRODUCT PORTFOLIO
    TABLE 161. SOLOMON COLORS INC.: NET SALES
    TABLE 162. SOLOMON COLORS INC.: KEY STRATERGIES
    TABLE 163. VEXCON CHEMICALS, INC.: KEY EXECUTIVES
    TABLE 164. VEXCON CHEMICALS, INC.: COMPANY SNAPSHOT
    TABLE 165. VEXCON CHEMICALS, INC.: OPERATING SEGMENTS
    TABLE 166. VEXCON CHEMICALS, INC.: PRODUCT PORTFOLIO
    TABLE 167. VEXCON CHEMICALS, INC.: NET SALES
    TABLE 168. VEXCON CHEMICALS, INC.: KEY STRATERGIES
    TABLE 169. THE EUCLID CHEMICAL COMPANY: KEY EXECUTIVES
    TABLE 170. THE EUCLID CHEMICAL COMPANY: COMPANY SNAPSHOT
    TABLE 171. THE EUCLID CHEMICAL COMPANY: OPERATING SEGMENTS
    TABLE 172. THE EUCLID CHEMICAL COMPANY: PRODUCT PORTFOLIO
    TABLE 173. THE EUCLID CHEMICAL COMPANY: NET SALES
    TABLE 174. THE EUCLID CHEMICAL COMPANY: KEY STRATERGIES
  • LIST OF FIGURES

  • FIGURE 1.POLISHED CONCRETE MARKET SEGMENTATION
    FIGURE 2.POLISHED CONCRETE MARKET,2021-2031
    FIGURE 3.POLISHED CONCRETE MARKET,2021-2031
    FIGURE 4. TOP INVESTMENT POCKETS, BY REGION
    FIGURE 5.PORTER FIVE-1
    FIGURE 6.PORTER FIVE-2
    FIGURE 7.PORTER FIVE-3
    FIGURE 8.PORTER FIVE-4
    FIGURE 9.PORTER FIVE-5
    FIGURE 10.TOP PLAYER POSITIONING
    FIGURE 11.POLISHED CONCRETE MARKET:DRIVERS, RESTRAINTS AND OPPORTUNITIES
    FIGURE 12.VALUE CHAIN ANALYSIS
    FIGURE 13.KEY REGULATION ANALYSIS
    FIGURE 14.PATENT ANALYSIS BY COMPANY
    FIGURE 15.PATENT ANALYSIS BY COUNTRY
    FIGURE 16.MARKET SHARE ANALYSIS
    FIGURE 17.REGULATORY GUIDELINES
    FIGURE 18.POLISHED CONCRETE MARKET,BY PRODUCT,2021(%)
    FIGURE 19.COMPARATIVE SHARE ANALYSIS OF DENSIFIERS POLISHED CONCRETE MARKET,2021-2031(%)
    FIGURE 20.COMPARATIVE SHARE ANALYSIS OF SEALERS & CRACK FILLERS POLISHED CONCRETE MARKET,2021-2031(%)
    FIGURE 21.COMPARATIVE SHARE ANALYSIS OF CONDITIONERS POLISHED CONCRETE MARKET,2021-2031(%)
    FIGURE 22.POLISHED CONCRETE MARKET,BY METHOD,2021(%)
    FIGURE 23.COMPARATIVE SHARE ANALYSIS OF DRY POLISHED CONCRETE MARKET,2021-2031(%)
    FIGURE 24.COMPARATIVE SHARE ANALYSIS OF WET POLISHED CONCRETE MARKET,2021-2031(%)
    FIGURE 25.POLISHED CONCRETE MARKET,BY CONSTRUCTION TYPE,2021(%)
    FIGURE 26.COMPARATIVE SHARE ANALYSIS OF NEW CONSTRUCTION POLISHED CONCRETE MARKET,2021-2031(%)
    FIGURE 27.COMPARATIVE SHARE ANALYSIS OF RENOVATION POLISHED CONCRETE MARKET,2021-2031(%)
    FIGURE 28.POLISHED CONCRETE MARKET,BY END-USE,2021(%)
    FIGURE 29.COMPARATIVE SHARE ANALYSIS OF RESIDENTIAL POLISHED CONCRETE MARKET,2021-2031(%)
    FIGURE 30.COMPARATIVE SHARE ANALYSIS OF NON-RESIDENTIAL POLISHED CONCRETE MARKET,2021-2031(%)
    FIGURE 31.POLISHED CONCRETE MARKET BY REGION,2021
    FIGURE 32.U.S. POLISHED CONCRETE MARKET,2021-2031($MILLION)
    FIGURE 33.CANADA POLISHED CONCRETE MARKET,2021-2031($MILLION)
    FIGURE 34.MEXICO POLISHED CONCRETE MARKET,2021-2031($MILLION)
    FIGURE 35.GERMANY POLISHED CONCRETE MARKET,2021-2031($MILLION)
    FIGURE 36.UNITED KINGDOM POLISHED CONCRETE MARKET,2021-2031($MILLION)
    FIGURE 37.FRANCE POLISHED CONCRETE MARKET,2021-2031($MILLION)
    FIGURE 38.SPAIN POLISHED CONCRETE MARKET,2021-2031($MILLION)
    FIGURE 39.ITALY POLISHED CONCRETE MARKET,2021-2031($MILLION)
    FIGURE 40.REST OF EUROPE POLISHED CONCRETE MARKET,2021-2031($MILLION)
    FIGURE 41.CHINA POLISHED CONCRETE MARKET,2021-2031($MILLION)
    FIGURE 42.JAPAN POLISHED CONCRETE MARKET,2021-2031($MILLION)
    FIGURE 43.INDIA POLISHED CONCRETE MARKET,2021-2031($MILLION)
    FIGURE 44.AUSTRALIA POLISHED CONCRETE MARKET,2021-2031($MILLION)
    FIGURE 45.SOUTH KOREA POLISHED CONCRETE MARKET,2021-2031($MILLION)
    FIGURE 46.REST OF ASIA-PACIFIC POLISHED CONCRETE MARKET,2021-2031($MILLION)
    FIGURE 47.BRAZIL POLISHED CONCRETE MARKET,2021-2031($MILLION)
    FIGURE 48.SAUDI ARABIA POLISHED CONCRETE MARKET,2021-2031($MILLION)
    FIGURE 49.UAE POLISHED CONCRETE MARKET,2021-2031($MILLION)
    FIGURE 50.SOUTH AFRICA POLISHED CONCRETE MARKET,2021-2031($MILLION)
    FIGURE 51.REST OF LAMEA POLISHED CONCRETE MARKET,2021-2031($MILLION)
    FIGURE 52. TOP WINNING STRATEGIES, BY YEAR
    FIGURE 53. TOP WINNING STRATEGIES, BY DEVELOPMENT
    FIGURE 54. TOP WINNING STRATEGIES, BY COMPANY
    FIGURE 55.PRODUCT MAPPING OF TOP 10 PLAYERS
    FIGURE 56.COMPETITIVE DASHBOARD
    FIGURE 57.COMPETITIVE HEATMAP OF TOP 10 KEY PLAYERS
    FIGURE 58.PPG INDUSTRIES, INC..: NET SALES ,($MILLION)
    FIGURE 59.THE 3M COMPANY.: NET SALES ,($MILLION)
    FIGURE 60.BASF SE.: NET SALES ,($MILLION)
    FIGURE 61.SIKA AG.: NET SALES ,($MILLION)
    FIGURE 62.ULTRA TECH CEMENT LIMITED.: NET SALES ,($MILLION)
    FIGURE 63.THE SHERWIN WILLIAMS COMPANY.: NET SALES ,($MILLION)
    FIGURE 64.BORAL LIMITED.: NET SALES ,($MILLION)
    FIGURE 65.SOLOMON COLORS INC..: NET SALES ,($MILLION)
    FIGURE 66.VEXCON CHEMICALS, INC..: NET SALES ,($MILLION)
    FIGURE 67.THE EUCLID CHEMICAL COMPANY.: NET SALES ,($MILLION)


The polished concrete industry is anticipated to experience considerable growth in the coming years due to the rise in demand for polished concrete in both residential and commercial construction. Additionally, it is anticipated that the market for polished concrete will be supported during the forecast period by growth in the construction of new homes and businesses as well as an increase in demand for flooring options that are beautiful, long-lasting, and low maintenance. As a result, the market is anticipated to experience revenue growth during the forecast period. However, in response to rising raw material costs, vendors may raise the price of their goods or reduce their profit margins, which will have a negative influence on market expansion and is likely to impede the growth of the worldwide polished concrete market during the forecast period. The Leadership in Energy and Environmental Design (LEED) -friendly polished concrete floors enable sustainable building construction without the release of volatile organic compounds (VOCs). Furthermore, essential advantages may create profitable market opportunities for the industry's players in the years to come.

Among the analyzed regions, North America is expected to account for the highest revenue in the market by the end of 2027. The rapid advancements in the e-commerce industry have increased the demand for construction of new warehouses and logistics hubs in North America and thus are the key factors responsible for dominating position of North America in the global polished concrete market.

PURCHASE OPTIONS

Call or Email us

U.S.-Canada Toll-free: +1-800-792-5285
Int'l : +1-503-894-6022
Europe : +44-845-528-1300
Email : help@alliedmarketresearch.com
 
FREQUENTLY ASKED QUESTIONS?

A. Increase in construction activities around the world is a major factor in the polished concrete industry’s rapid expansion. In addition, another important factor which is population growth in rise in economies such as China and India are causing the construction industry to expand quickly thus it is expected to fuel revenue growth of the market in the forecast timeframe.

A. The major growth strategies adopted by polished concrete market players are investment and merger & acquisitions.

A. Concrete manufacturers, builders, and contractors are the major customers in the global polished concrete market.

A. The report provides an extensive qualitative and quantitative analysis of the current trends and future estimations of the global polished concrete market from 2022 to 2031 to determine the prevailing opportunities.

A. The reconstruction and remodeling activities in residential & commercial sector is increasing the demand for smooth and aesthetically pleasant flooring at cost-effective price which in turn is anticipated to boost the polished concrete market in the upcoming years.

A. The non-residential sub-segment of the component segment acquired the maximum share of the global polished concrete market in 2021.

A. Asia-Pacific will provide more business opportunities for the global polished concrete market in future.

A. Pittsburgh Plate Glass Industries, Inc., 3M, BASF SE, Sika AG, Ultra Tech Cement Limited, The Sherwin Williams Company, Boral Limited, Solomon Colors Inc., Vexcon Chemicals Inc., and The Euclid Chemical Company are the major players in the polished concrete market.

Looking for Customization?

 Customization Request

Have a Question?

 Speak with Analyst

Any Confusion?

 Inquire Before Buying

Have a glance of the Report

  Request Sample
RELATED TAGS

Purchase Full Report of
Polished Concrete Market

Start reading instantly.
This Report and over 67,404+ more Reports, Available with Avenue Library. T&C*.

  • Online Only
  • $3,570
  • Online cloud access only
  • Restricted print, copy, paste & download
  • Read only
  • Free industry update
    (Within 180 days)
  • Free report update in next update cycle
    (Jan 2024 - Jan 2025)
  • Data Pack
  • $3,840
  • Restricted to one authorized user
  • One print only
  • Available in
    Excel
  • Free industry update
    (Within 180 days)
  •   Free report update in next update cycle
    (Jan 2024 - Jan 2025)
  • Single User
  • $5,730
  • Restricted to one authorized user
  • One print only
  • Available in
    PDF
  • Free industry update
    (Within 180 days)
  •   Free report update in next update cycle
    (Jan 2024 - Jan 2025)
  • Five Users
  • $6,450
  • Limited to five authorized users
  • Print upto five copies
  • Available in
    PDF
  • Free industry update
    (Within 180 days)
  •   Free report update in next update cycle
    (Jan 2024 - Jan 2025)
  • Enterprise
    License/PDF

  • $9,600
  • Unlimited
    within
    company/enterprise
  • Available in Excel & PDF
  • Free industry update
    (Within 180 days)
  •   Free report update in next update cycle
    (Jan 2024 - Jan 2025)
  • Library
    Membership

  • $999 $ 1,175
    Per User/ Per month/ Billed annually
  • Published Content
    E-access
  • Company Profiles
    E-access
  • Newly Added Content Access
  • 10 PDF
    Downloads
  • 5 Excel Data
    Pack Downloads
  • 250 Company Profiles PDF Downloads
  • Buy Now

*Taxes/Fees, if applicable will be added during checkout. All prices in USD

RELATED REPORTS
 

Why Allied Market Research?


Infallible Methodology

To ensure high-level data integrity, accurate analysis, and impeccable forecasts

Analyst Support

For complete satisfaction

Customization

On-demand customization of scope of the report to exactly meet your needs

TARGETED MARKET VIEW

Targeted market view to provide pertinent information and save time of readers

Get fresh content delivered

Get insights on topics that are crucial for your business. Stay abreast of your interest areas.

Get Industry Data Alerts

Why Allied Market Research?

Infallible Methodology

To ensure high-level data integrity, accurate analysis, and impeccable forecasts

Analyst Support

For complete satisfaction

Customization

On-demand customization of scope of the report to exactly meet your needs

TARGETED MARKET VIEW

Targeted market view to provide pertinent information and save time of readers