0
2021
Portable Dishwasher Market

Portable Dishwasher Market

by Price-Range (Economy, Mid-range, and Luxury), End-Use (Commercial and Residential), and Distribution Channel (Supermarket/Hypermarket, Specialty Stores, Convenience Stores, E-commerce, and Others): Global Opportunity Analysis and Industry Forecast, 2021-2030

Report Code: A13688
Sep 2021 | Pages: 315
Tables: 160
Charts: 85
  • Formats*:

  • pdf

    Single User License, Five User
    License & Enterprise User License

  • xls

    Data Pack Excel License

  • ppt

    It comes with the additional cost
    of $2500.00 contact sales.


COVID-19

Pandemic disrupted the entire world and affected many industries.

Get detailed COVID-19 impact analysis on the Portable Dishwasher Market

Request Now !

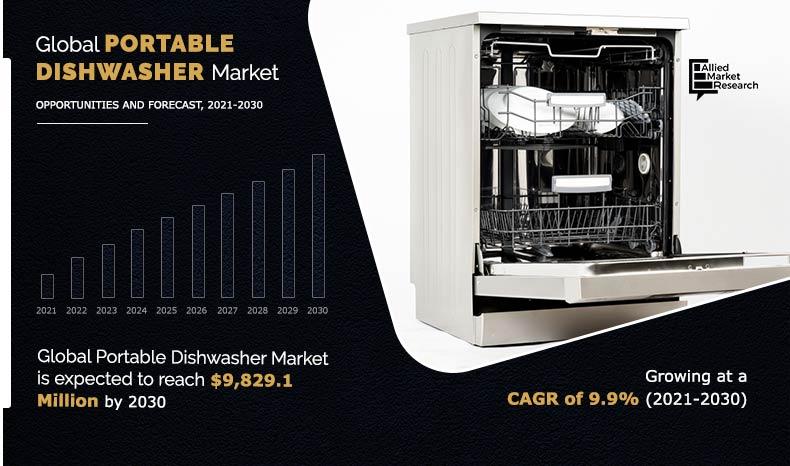
The global portable dishwasher market size was valued at $4,594.3 million in 2020, and is projected to reach $9,829.1 million by 2030, registering a CAGR of 9.9%. Asia-Pacific was the highest revenue contributor, accounting for $2,092.7 million in 2020.  

A dishwasher is a machine for cleaning dishware and cutlery automatically. This machine does not need any kind of supervision, which saves time. Portable dishwashers are not only a necessity in developed countries but they are also luxury that are being used by consumers of developing nations.

Portable-Dishwasher-Market-2021-2030

It is expected that focus on R&D will increase during the forecast period, as companies are expected to offer products that are better than their rivals. Manufacturers of home appliances products are focused on the positioning their brands better to improve their sales. 

Exponential increase in population density in metro cities has been majorly driving the growth of the kitchen appliances market. People are majorly migrating from rural areas to metro cities in the search of job opportunities and plan to settle there permanently. This migration creates huge opportunities for real estate, hotels & restaurants, hospitals, and clinics, where various kitchen appliances products are required.

Rise in urbanized population creates huge demand for white goods such as dishwasher, air conditioners, refrigerators, vacuum cleaners, and water heaters, as populace living in metro is considerably seeking for high standard of living.

People are actively involving themselves in home improvement by installing smart appliances such as portable dishwasher, smart refrigerators, air conditioners, and vacuum cleaners. Furthermore, increase in personal disposable income and affordable credit facilities are promoting people to improve and design their living rooms and kitchens, thus augmenting the demand for portable dishwashers. In addition, increase in innovation in home appliances is promoting people to replace their old model appliances with new smart appliances, which is anticipated to foster the growth of the global portable dishwasher market.

Portable Dishwasher Market
By Price-range

Your browser does not support the canvas element.

Luxury segment would witness the fastest growth, registering a CAGR of 10.9% during the forecast period.

Get more information on this report : Request Sample Pages

According to the portable dishwasher market analysis, the market is segmented on the basis of price-range, end use, distribution channel, and region. Depending on price-range, the market is divided into economy, mid-range, and luxury. By end user, it is segregated into residential and commercial. According to distribution channel, it is divided into supermarket & hypermarket, specialty store, convenience store, e-commerce, and others. Region wise, it is analyzed across North America (the U.S., Canada, and Mexico), Europe (Germany, France, the UK, Spain, Italy, Russia, and rest of Europe), Asia-Pacific (China, Japan, India, Australia, South Korea, Thailand, Singapore, and rest of Asia-Pacific), and LAMEA (Brazil, Argentina, the UAE, Nigeria, Saudi Arabia, South Africa, and rest of LAMEA).    

On the basis of price-range, the economy segment accounted for the maximum share in the global portable dishwasher market in 2020, and is expected to remain dominant during the portable dishwasher market forecast period. Economy pricing is based on a low-cost approach. Moreover, it assists businesses to survive in times of economic uncertainty by allowing them to establish lower pricing that appeal consumers who are financially pressured. Hence, this type of price tag is preferred across globe. 

Portable Dishwasher Market
By End-use

Your browser does not support the canvas element.

Residential Segment witnssed a major growth rate of 10.5%

Get more information on this report : Request Sample Pages

On the basis of end-use, the commercial segment accounts to higher value share. Increase has been witnessed in the demand for commercial kitchen appliances such as dishwasher due to rise in number of food service establishments especially in the emerging countries such as India and China. The hectic lifestyle and busy schedule accelerate the trend of dining out at cafes, restaurants, hotels, and similar other food establishments, which, in turn, supplements the growth of the food service industry.

On the basis of distribution channel, the supermarket/hypermarket segment held the significant Portable Dishwasher market share in 2020. Supermarket/hypermarket is gaining popularity due to the availability of broad range of consumer goods under a single roof, in addition to ample parking space and convenient operation timings. Consumers across the globe prefer to buy products that are on sale. Moreover, products are arranged nearby, which aids buyers for easy comparison among similar products, thereby helping consumers to decide which product to buy.

Portable Dishwasher Market
By Distribution Channel

Your browser does not support the canvas element.

Supermarket/hypermarket Segment held the major share of 44.9% in 2020

Get more information on this report : Request Sample Pages

On the basis of region, Asia-Pacific dominated the portable dishwasher market in 2020, and accounted for maximum market share. Rapid urbanization and high standard of living especially in the developing countries including India and China are driving the growth of the portable dishwasher market in Asia-Pacific. Rise in disposable income and high spending on home improvement are some of the major factors positively influencing the market growth. People in India are replacing old household appliances with smart and advanced appliances, which is further creating huge demand for portable dishwasher. 

Players in the Portable Dishwasher market have adopted business expansion and product launch as their key developmental strategies to expand their market share, increase profitability, and remain competitive in the market. The key players profiled in the report include Danby, Electrolux AB, Haier lnc., Havells India Limited, LG Electronics Inc., Midea Group, Panasonic Corporation, Samsung Electronics Co. Ltd., the Middleby Corporation, and Whirlpool Corp. 

Portable Dishwasher Market
By Region

2030
Asia-pacific 
North America
Europe
LAMEA

North America held the major share of 45.5% in 2020

Get more information on this report : Request Sample Pages

Key benefits for stakeholders    

  • The report provides quantitative analysis of the current portable dishwasher market trends, estimations, and dynamics of the market size from 2020 to 2030 to identify the prevailing portable dishwasher market opportunities. 
  • Porter’s five forces analysis highlights the potency of buyers and suppliers to enable stakeholders to make profit-oriented business decisions and strengthen their supplier–buyer network.
  • In-depth analysis and the market size & segmentation assist to determine the market potential.
  • The major countries in each region are mapped according to their revenue contribution to the market.    
  • The market player positioning segment facilitates benchmarking and provides a clear understanding of the present position of the market players in the portable dishwasher industry. 

Key market segments 

By Price-Range

  • Economy
  • Mid-range
  • Luxury

By End-use

  • Commercial
  • Residential

By Distribution Channel

  • Supermarket/Hypermarket
  • Specialty Stores
  • Convenience Stores
  • E-commerce
  • Others

By Region

  • North America
    • U.S.
    • Canada
    • Mexico
  • Europe
    • Germany 
    • France
    • UK
    • Italy
    • Spain 
    • Russia
    • Rest of Europe
  • Asia-Pacific
    • China
    • Japan
    • Australia
    • South Korea
    • Thailand
    • Singapore
    • Rest of Asia-Pacific 
  • LAMEA 
    • Brazil
    • Argentina
    • UAE
    • Nigeria 
    • Saudi Arabia 
    • South Africa
    • Rest of LAMEA

Portable Dishwasher Market Report Highlights

Aspects Details
By PRICE-RANGE
  • Economy
  • Mid-Range
  • Luxury
By END-USE
  • Commercial
  • Residential
By DISTRIBUTION CHANNEL
  • Supermarket & hypermarket
  • Specialty stores
  • Convenience stores
  • E-commerce
  • Others
By Region
  • North America  (U.S., Canada, Mexico)
  • Europe  (France, Germany, Italy, Spain, UK, Russia, Rest of Europe)
  • Asia-Pacific  (China, Japan, India, South Korea, Australia, Thailand, Malaysia, Indonesia, Rest of Asia-Pacific)
  • LAMEA  (Brazil, South Africa, Saudi Arabia, UAE, Argentina, Rest of LAMEA)
Key Market Players Danby, LG ELECTRONICS INC., SAMSUNG ELECTRONICS CO. LTD., Whirlpool Corp., THE MIDDLEBY CORPORATION, ELECTROLUX AB, Panasonic Corporation, Haier lnc., HAVELLS INDIA LIMITED, Midea Group
 

CHAPTER 1:INTRODUCTION

1.1.Key benefits for stakeholders
1.2.Key market segments
1.3.Research methodology

1.3.1.Secondary research
1.3.2.Primary research
1.3.3.Analyst tools and models

CHAPTER 2:EXECUTIVE SUMMARY

2.1.Key findings of the study
2.2.CXO perspective

CHAPTER 3:MARKET OVERVIEW

3.1.Market definition and scope
3.2.Key findings

3.2.1.Top impacting factors

3.2.1.1.Technological advancement
3.2.1.2.Rise in disposable income
3.2.1.3.Energy consumption
3.2.1.4.Availability of smart kitchen appliances
3.2.1.5.Quality products at lower cost

3.2.2.Top investment pockets

3.3.Value chain analysis
3.4.Porter’s five forces analysis
3.5.Market dynamics

3.5.1.Drivers

3.5.1.1.Growing urbanized population
3.5.1.2.Growing technological advancements in the home appliances
3.5.1.3.Changes in lifestyle and growing disposable income
3.5.1.4.Increase in spending on home improvement

3.5.2.Restraints

3.5.2.1.Rising energy consumption and increasing electricity prices

3.5.3.Opportunities

3.5.3.1.Rapid growth of the retail sector

3.6.Market share analysis

3.6.1.By Price-Range
3.6.2.By End-Use
3.6.3.By Distribution Channel
3.6.4.By region

3.7.Pricing Analysis
3.8.Parent/Peer Analysis
3.9.Impact of COVID-19 on the Portable Dishwasher market

CHAPTER 4:PORTABLE DISHWASHER MARKET, BY PRICE-RANGE

4.1.Overview

4.1.1.Market size and forecast

4.2.Economy

4.2.1.Key market trends, growth factors, and opportunities
4.2.2.Market size and forecast, by region
4.2.3.Market analysis, by country

4.3.Mid-Range

4.3.1.Key market trends, growth factors, and opportunities
4.3.2.Market size and forecast, by region
4.3.3.Market analysis, by country

4.4.Luxury

4.4.1.Key market trends, growth factors, and opportunities
4.4.2.Market size and forecast, by region
4.4.3.Market analysis, by country

CHAPTER 5:PORTABLE DISHWASHER MARKET, END-USE

5.1.Overview

5.1.1.Market size and forecast

5.2.Commercial

5.2.1.Key market trends, growth factors, and opportunities
5.2.2.Market size and forecast, by region
5.2.3.Market analysis, by country

5.4.Residential

5.4.1.Key market trends, growth factors, and opportunities
5.4.2.Market size and forecast, by region
5.4.3.Market analysis, by country

CHAPTER 6:PORTABLE DISHWASHER MARKET, DISTRIBUTION CHANNEL

6.1.Overview

6.1.1.Market size and forecast

6.2.Supermarket & hypermarket

6.2.1.Key market trends, growth factors, and opportunities
6.2.2.Market size and forecast, by region
6.2.3.Market analysis, by country

6.3.Specialty stores

6.3.1.Key market trends, growth factors, and opportunities
6.3.2.Market size and forecast, by region
6.3.3.Market analysis, by country

6.4.Convenience stores

6.4.1.Key market trends, growth factors, and opportunities
6.4.2.Market size and forecast, by region
6.4.3.Market analysis, by country

6.5.E-commerce

6.5.1.Key market trends, growth factors, and opportunities
6.5.2.Market size and forecast, by region
6.5.3.Market analysis, by country

6.6.Others

6.6.1.Key market trends, growth factors, and opportunities
6.6.2.Market size and forecast, by region
6.6.3.Market analysis, by country

CHAPTER 7:PORTABLE DISHWASHER MARKET, BY REGION

7.1.Overview

7.1.1.Market size and forecast, by region

7.2.North America

7.2.1.Key market trends, growth factors, and opportunities
7.2.2.Market size and forecast, by price-range
7.2.3.Market size and forecast, by end-use
7.2.4.Market size and forecast, by distribution channel
7.2.5.Market size and forecast, by country

7.2.5.1.U.S.

7.2.5.1.1.Market size and forecast, by price-range
7.2.5.1.2.Market size and forecast, by end-use
7.2.5.1.3.Market size and forecast, by distribution channel

7.2.5.2.Canada

7.2.5.2.1.Market size and forecast, by price-range
7.2.5.2.2.Market size and forecast, by end-use
7.2.5.2.3.Market size and forecast, by distribution channel

7.2.5.3.Mexico

7.2.5.3.1.Market size and forecast, by price-range
7.2.5.3.2.Market size and forecast, by end-use
7.2.5.3.3.Market size and forecast, by distribution channel

7.3.Europe

7.3.1.Key market trends, growth factors, and opportunities
7.3.2.Market size and forecast, by price-range
7.3.3.Market size and forecast, by end-use
7.3.4.Market size and forecast, by distribution channel
7.3.5.Market size and forecast, by country

7.3.5.1.Germany

7.3.5.1.1.Market size and forecast, by price-range
7.3.5.1.2.Market size and forecast, by end-use
7.3.5.1.3.Market size and forecast, by distribution channel

7.3.5.2.France

7.3.5.2.1.Market size and forecast, by price-range
7.3.5.2.2.Market size and forecast, by end-use
7.3.5.2.3.Market size and forecast, by distribution channel

7.3.5.3.UK

7.3.5.3.1.Market size and forecast, by price-range
7.3.5.3.2.Market size and forecast, by end-use
7.3.5.3.3.Market size and forecast, by distribution channel

7.3.5.4.Italy

7.3.5.4.1.Market size and forecast, by price-range
7.3.5.4.2.Market size and forecast, by end-use
7.3.5.4.3.Market size and forecast, by distribution channel

7.3.5.5.Spain

7.3.5.5.1.Market size and forecast, by price-range
7.3.5.5.2.Market size and forecast, by end-use
7.3.5.5.3.Market size and forecast, by distribution channel

7.3.5.6.Russia

7.3.5.6.1.Market size and forecast, by price-range
7.3.5.6.2.Market size and forecast, by end-use
7.3.5.6.3.Market size and forecast, by distribution channel

7.3.5.7.Rest of Europe

7.3.5.7.1.Market size and forecast, by price-range
7.3.5.7.2.Market size and forecast, by end-use
7.3.5.7.3.Market size and forecast, by distribution channel

7.4.Asia-Pacific

7.4.1.Key market trends, growth factors, and opportunities
7.4.2.Market size and forecast, by price-range
7.4.3.Market size and forecast, by end-use
7.4.4.Market size and forecast, by distribution channel
7.4.5.Market size and forecast, by country

7.4.5.1.China

7.4.5.1.1.Market size and forecast, by price-range
7.4.5.1.2.Market size and forecast, by end-use
7.4.5.1.3.Market size and forecast, by distribution channel

7.4.5.2.Japan

7.4.5.2.1.Market size and forecast, by price-range
7.4.5.2.2.Market size and forecast, by end-use
7.4.5.2.3.Market size and forecast, by distribution channel

7.4.5.3.India

7.4.5.3.1.Market size and forecast, by price-range
7.4.5.3.2.Market size and forecast, by end-use
7.4.5.3.3.Market size and forecast, by distribution channel

7.4.5.4.Australia

7.4.5.4.1.Market size and forecast, by price-range
7.4.5.4.2.Market size and forecast, by end-use
7.4.5.4.3.Market size and forecast, by distribution channel

7.4.5.5.South Korea

7.4.5.5.1.Market size and forecast, by price-range
7.4.5.5.2.Market size and forecast, by end-use
7.4.5.5.3.Market size and forecast, by distribution channel

7.4.5.6.Thailand

7.4.5.6.1.Market size and forecast, by price-range
7.4.5.6.2.Market size and forecast, by end-use
7.4.5.6.3.Market size and forecast, by distribution channel

7.4.5.7.Singapore

7.4.5.7.1.Market size and forecast, by price-range
7.4.5.7.2.Market size and forecast, by end-use
7.4.5.7.3.Market size and forecast, by distribution channel

7.4.5.8.Rest of Asia-Pacific

7.4.5.8.1.Market size and forecast, by price-range
7.4.5.8.2.Market size and forecast, by end-use
7.4.5.8.3.Market size and forecast, by distribution channel

7.5.LAMEA

7.5.1.Key market trends, growth factors, and opportunities
7.5.2.Market size and forecast, by price-range
7.5.3.Market size and forecast, by end-use
7.5.4.Market size and forecast, by distribution channel
7.5.5.Market size and forecast, by country

7.5.5.1.Brazil

7.5.5.1.1.Market size and forecast, by price-range
7.5.5.1.2.Market size and forecast, by end-use
7.5.5.1.3.Market size and forecast, by distribution channel

7.5.5.2.Argentina

7.5.5.2.1.Market size and forecast, by price-range
7.5.5.2.2.Market size and forecast, by end-use
7.5.5.2.3.Market size and forecast, by distribution channel

7.5.5.3.UAE

7.5.5.3.1.Market size and forecast, by price-range
7.5.5.3.2.Market size and forecast, by end-use
7.5.5.3.3.Market size and forecast, by distribution channel

7.5.5.4.Nigeria

7.5.5.4.1.Market size and forecast, by price-range
7.5.5.4.2.Market size and forecast, by end-use
7.5.5.4.3.Market size and forecast, by Distribution Channel

7.5.5.5.South Africa

7.5.5.5.1.Market size and forecast, by price-range
7.5.5.5.2.Market size and forecast, by end-use
7.5.5.5.3.Market size and forecast, by distribution channel

7.5.5.6.Saudi Arabia

7.5.5.6.1.Market size and forecast, by price-range
7.5.5.6.2.Market size and forecast, by end-use
7.5.5.6.3.Market size and forecast, by distribution channel

7.5.5.7.Rest of LAMEA

7.5.5.7.1.Market size and forecast, by Price-Range
7.5.5.7.2.Market size and forecast, by end-use
7.5.5.7.3.Market size and forecast, by distribution channel

CHAPTER 8:COMPETITION LANDSCAPE

8.1.Top winning strategies
8.2.Product mapping
8.3.Competitive dashboard
8.4.Competitive heat map
8.5.Key developments

8.5.1.Acquisition
8.5.2.Business Expansion
8.5.3.Product Launch

CHAPTER 9:COMPANY PROFILES

9.1.Danby

9.1.1.Company overview
9.1.2.Key Executives
9.1.3.Company snapshot
9.1.4.Product portfolio

9.2.ELECTROLUX AB

9.2.1.Company overview
9.2.2.Key Executives
9.2.3.Company snapshot
9.2.4.Operating business segments
9.2.5.Product portfolio
9.2.6.Business performance
9.2.7.Key strategic moves and developments

9.3.Haier lnc.

9.3.1.Company overview
9.3.2.Key Executives
9.3.3.Company snapshot
9.3.4.Operating business segments
9.3.5.Product portfolio
9.3.6.R&D Expenditure
9.3.7.Business performance

9.4.HAVELLS INDIA LIMITED

9.4.1.Company overview
9.4.2.Key Executives
9.4.3.Company snapshot
9.4.4.Operating business segments
9.4.5.Product portfolio
9.4.6.R&D Expenditure
9.4.7.Business performance
9.4.8.Key strategic moves and developments

9.5.LG ELECTRONICS INC.

9.5.1.Company overview
9.5.2.Key Executives
9.5.3.Company snapshot
9.5.4.Operating business segments
9.5.5.Product portfolio
9.5.6.R&D Expenditure
9.5.7.Business performance
9.5.8.Key strategic moves and developments

9.6.Midea Group

9.6.1.Company overview
9.6.2.Key Executives
9.6.3.Company snapshot
9.6.4.Operating business segments
9.6.5.Product portfolio
9.6.6.R&D Expenditure
9.6.7.Business performance

9.7.Panasonic Corporation

9.7.1.Company overview
9.7.2.Key Executives
9.7.3.Company snapshot
9.7.4.Operating business segments
9.7.5.Product portfolio
9.7.6.R&D Expenditure
9.7.7.Business performance

9.8.SAMSUNG ELECTRONICS CO. LTD.

9.8.1.Company overview
9.8.2.Key Executives
9.8.3.Company snapshot
9.8.4.Operating business segments
9.8.5.Product portfolio
9.8.6.R&D Expenditure
9.8.7.Business performance
9.8.8.Key strategic moves and developments

9.9.THE MIDDLEBY CORPORATION

9.9.1.Company overview
9.9.2.Key Executives
9.9.3.Company snapshot
9.9.4.Operating business segments
9.9.5.Product portfolio
9.9.6.R&D Expenditure
9.9.7.Business performance
9.9.8.Key strategic moves and developments

9.10.Whirlpool Corp.

9.10.1.Company overview
9.10.2.Key Executives
9.10.3.Company snapshot
9.10.4.Operating business segments
9.10.5.Product portfolio
9.10.6.Business performance
9.10.7.Key strategic moves and developments

LIST OF TABLES

TABLE 01.PORTABLE DISHWASHER MARKET REVENUE, BY PRICE-RANGE, 2020–2030 ($MILLION)
TABLE 02.ECONOMY PORTABLE DISHWASHER MARKET REVENUE, BY REGION, 2020–2030 ($MILLION)
TABLE 03.MID-RANGE PORTABLE DISHWASHER MARKET REVENUE, BY REGION 2020–2030 ($MILLION)
TABLE 04.LUXURY PORTABLE DISHWASHER MARKET REVENUE, BY REGION 2020–2030 ($MILLION)
TABLE 05.PORTABLE DISHWASHER MARKET REVENUE, BY END-USE, 2020–2030($MILLION)
TABLE 06.PORTABLE DISHWASHER MARKET REVENUE FOR COMMERCIAL, BY REGION, 2020–2030 ($MILLION)
TABLE 07.PORTABLE DISHWASHER MARKET REVENUE FOR RESIDENTIAL, BY REGION, 2020–2030 ($MILLION)
TABLE 08.PORTABLE DISHWASHER MARKET REVENUE, BY DISTRIBUTION CHANNEL, 2020–2030($MILLION)
TABLE 09.PORTABLE DISHWASHER MARKET REVENUE FOR SUPERMARKET & HYPERMARKET, BY REGION, 2020–2030 ($MILLION)
TABLE 10.PORTABLE DISHWASHER MARKET REVENUE FOR SPECIALTY STORES, BY REGION, 2020–2030 ($MILLION)
TABLE 11.PORTABLE DISHWASHER MARKET REVENUE FOR CONVENIENCE STORES, BY REGION, 2020–2030 ($MILLION)
TABLE 12.PORTABLE DISHWASHER MARKET REVENUE FOR E-COMMERCE, BY REGION, 2020–2030 ($MILLION)
TABLE 13.PORTABLE DISHWASHER MARKET REVENUE FOR OTHERS, BY REGION, 2020–2030 ($MILLION)
TABLE 14.PORTABLE DISHWASHER MARKET, BY REGION, 2020–2030 ($MILLION)
TABLE 15.NORTH AMERICA PORTABLE DISHWASHER MARKET, BY PRICE-RANGE, 2020–2030 ($MILLION)
TABLE 16.NORTH AMERICA PORTABLE DISHWASHER MARKET, BY END-USE, 2020–2030 ($MILLION)
TABLE 17.NORTH AMERICA PORTABLE DISHWASHER MARKET, BY DISTRIBUTION CHANNEL, 2020–2030 ($MILLION)
TABLE 18.NORTH AMERICA PORTABLE DISHWASHER MARKET, BY COUNTRY, 2020–2030 ($MILLION)
TABLE 19.U.S. PORTABLE DISHWASHER MARKET, BY PRICE-RANGE, 2020–2030 ($MILLION)
TABLE 20.U.S. PORTABLE DISHWASHER MARKET, BY END-USE, 2020–2030 ($MILLION)
TABLE 21.U.S. PORTABLE DISHWASHER MARKET, BY DISTRIBUTION CHANNEL, 2020–2030 ($MILLION)
TABLE 22.CANADA PORTABLE DISHWASHER MARKET, BY PRICE-RANGE, 2020–2030 ($MILLION)
TABLE 23.CANADA PORTABLE DISHWASHER MARKET, BY END-USE, 2020–2030 ($MILLION)
TABLE 24.CANADA PORTABLE DISHWASHER MARKET, BY DISTRIBUTION CHANNEL, 2020–2030 ($MILLION)
TABLE 25.MEXICO PORTABLE DISHWASHER MARKET, BY PRICE-RANGE, 2020–2030 ($MILLION)
TABLE 26.MEXICO PORTABLE DISHWASHER MARKET, BY END-USE, 2020–2030 ($MILLION)
TABLE 27.MEXICO PORTABLE DISHWASHER MARKET, BY DISTRIBUTION CHANNEL, 2020–2030 ($MILLION)
TABLE 28.EUROPE PORTABLE DISHWASHER MARKET, BY PRICE-RANGE, 2020–2030 ($MILLION)
TABLE 29.EUROPE PORTABLE DISHWASHER MARKET, BY END-USE, 2020–2030 ($MILLION)
TABLE 30.EUROPE PORTABLE DISHWASHER MARKET, BY DISTRIBUTION CHANNEL, 2020–2030 ($MILLION)
TABLE 31.EUROPE PORTABLE DISHWASHER MARKET, BY COUNTRY, 2020–2030 ($MILLION)
TABLE 32.GERMANY PORTABLE DISHWASHER MARKET, BY PRICE-RANGE, 2020–2030 ($MILLION)
TABLE 33.GERMANY PORTABLE DISHWASHER MARKET, BY END-USE, 2020–2030 ($MILLION)
TABLE 34.GERMANY PORTABLE DISHWASHER MARKET, BY DISTRIBUTION CHANNEL, 2020–2030 ($MILLION)
TABLE 35.FRANCE PORTABLE DISHWASHER MARKET, BY PRICE-RANGE, 2020–2030 ($MILLION)
TABLE 36.FRANCE PORTABLE DISHWASHER MARKET, BY END-USE, 2020–2030 ($MILLION)
TABLE 37.FRANCE PORTABLE DISHWASHER MARKET, BY DISTRIBUTION CHANNEL, 2020–2030 ($MILLION)
TABLE 38.UK PORTABLE DISHWASHER MARKET, BY PRICE-RANGE, 2020–2030 ($MILLION)
TABLE 39.UK PORTABLE DISHWASHER MARKET, BY END-USE, 2020–2030 ($MILLION)
TABLE 40.UK PORTABLE DISHWASHER MARKET, BY DISTRIBUTION CHANNEL, 2020–2030 ($MILLION)
TABLE 41.ITALY PORTABLE DISHWASHER MARKET, BY PRICE-RANGE, 2020–2030 ($MILLION)
TABLE 42.ITALY PORTABLE DISHWASHER MARKET, BY END-USE, 2020–2030 ($MILLION)
TABLE 43.ITALY PORTABLE DISHWASHER MARKET, BY DISTRIBUTION CHANNEL, 2020–2030 ($MILLION)
TABLE 44.SPAIN PORTABLE DISHWASHER MARKET, BY PRICE-RANGE, 2020–2030 ($MILLION)
TABLE 45.SPAIN PORTABLE DISHWASHER MARKET, BY END-USE, 2020–2030 ($MILLION)
TABLE 46.SPAIN PORTABLE DISHWASHER MARKET, BY DISTRIBUTION CHANNEL, 2020–2030 ($MILLION)
TABLE 47.RUSSIA PORTABLE DISHWASHER MARKET, BY PRICE-RANGE, 2020–2030 ($MILLION)
TABLE 48.RUSSIA PORTABLE DISHWASHER MARKET, BY END-USE, 2020–2030 ($MILLION)
TABLE 49.RUSSIA PORTABLE DISHWASHER MARKET, BY DISTRIBUTION CHANNEL, 2020–2030 ($MILLION)
TABLE 50.REST OF EUROPE PORTABLE DISHWASHER MARKET, BY PRICE-RANGE, 2020–2030 ($MILLION)
TABLE 51.REST OF EUROPE PORTABLE DISHWASHER MARKET, BY END-USE, 2020–2030 ($MILLION)
TABLE 52.REST OF EUROPE PORTABLE DISHWASHER MARKET, BY DISTRIBUTION CHANNEL, 2020–2030 ($MILLION)
TABLE 53.ASIA-PACIFIC PORTABLE DISHWASHER MARKET, BY PRICE-RANGE, 2020–2030 ($MILLION)
TABLE 54.ASIA-PACIFIC PORTABLE DISHWASHER MARKET, BY END-USE, 2020–2030 ($MILLION)
TABLE 55.ASIA-PACIFIC PORTABLE DISHWASHER MARKET, BY DISTRIBUTION CHANNEL, 2020–2030 ($MILLION)
TABLE 56.ASIA-PACIFIC PORTABLE DISHWASHER MARKET, BY COUNTRY, 2020–2030 ($MILLION)
TABLE 57.CHINA PORTABLE DISHWASHER MARKET, BY PRICE-RANGE, 2020–2030 ($MILLION)
TABLE 58.CHINA PORTABLE DISHWASHER MARKET, BY END-USE, 2020–2030 ($MILLION)
TABLE 59.CHINA PORTABLE DISHWASHER MARKET, BY DISTRIBUTION CHANNEL, 2020–2030 ($MILLION)
TABLE 60.JAPAN PORTABLE DISHWASHER MARKET, BY PRICE-RANGE, 2020–2030 ($MILLION)
TABLE 61.JAPAN PORTABLE DISHWASHER MARKET, BY END-USE, 2020–2030 ($MILLION)
TABLE 62.JAPAN PORTABLE DISHWASHER MARKET, BY DISTRIBUTION CHANNEL, 2020–2030 ($MILLION)
TABLE 63.INDIA PORTABLE DISHWASHER MARKET, BY PRICE-RANGE, 2020–2030 ($MILLION)
TABLE 64.INDIA PORTABLE DISHWASHER MARKET, BY END-USE, 2020–2030 ($MILLION)
TABLE 65.INDIA PORTABLE DISHWASHER MARKET, BY DISTRIBUTION CHANNEL, 2020–2030 ($MILLION)
TABLE 66.AUSTRALIA PORTABLE DISHWASHER MARKET, BY PRICE-RANGE, 2020–2030 ($MILLION)
TABLE 67.AUSTRALIA PORTABLE DISHWASHER MARKET, BY END-USE, 2020–2030 ($MILLION)
TABLE 68.AUSTRALIA PORTABLE DISHWASHER MARKET, BY DISTRIBUTION CHANNEL, 2020–2030 ($MILLION)
TABLE 69.SOUTH KOREA PORTABLE DISHWASHER MARKET, BY PRICE-RANGE, 2020–2030 ($MILLION)
TABLE 70.SOUTH KOREA PORTABLE DISHWASHER MARKET, BY END-USE, 2020–2030 ($MILLION)
TABLE 71.SOUTH KOREA PORTABLE DISHWASHER MARKET, BY DISTRIBUTION CHANNEL, 2020–2030 ($MILLION)
TABLE 72.THAILAND PORTABLE DISHWASHER MARKET, BY PRICE-RANGE, 2020–2030 ($MILLION)
TABLE 73.THAILAND PORTABLE DISHWASHER MARKET, BY END-USE, 2020–2030 ($MILLION)
TABLE 74.THAILAND PORTABLE DISHWASHER MARKET, BY DISTRIBUTION CHANNEL, 2020–2030 ($MILLION)
TABLE 75.SINGAPORE PORTABLE DISHWASHER MARKET, BY PRICE-RANGE, 2020–2030 ($MILLION)
TABLE 76.SINGAPORE PORTABLE DISHWASHER MARKET, BY END-USE, 2020–2030 ($MILLION)
TABLE 77.SINGAPORE PORTABLE DISHWASHER MARKET, BY DISTRIBUTION CHANNEL, 2020–2030 ($MILLION)
TABLE 78.REST OF ASIA-PACIFIC PORTABLE DISHWASHER MARKET, BY PRICE-RANGE, 2020–2030 ($MILLION)
TABLE 79.REST OF ASIA-PACIFIC PORTABLE DISHWASHER MARKET, BY END-USE, 2020–2030 ($MILLION)
TABLE 80.REST OF ASIA-PACIFIC PORTABLE DISHWASHER MARKET, BY DISTRIBUTION CHANNEL, 2020–2030 ($MILLION)
TABLE 81.LAMEA PORTABLE DISHWASHER MARKET, BY PRICE-RANGE, 2020–2030 ($MILLION)
TABLE 82.LAMEA PORTABLE DISHWASHER MARKET, BY END-USE, 2020–2030 ($MILLION)
TABLE 83.LAMEA PORTABLE DISHWASHER MARKET, BY DISTRIBUTION CHANNEL, 2020–2030 ($MILLION)
TABLE 84.LAMEA PORTABLE DISHWASHER MARKET, BY COUNTRY, 2020–2030 ($MILLION)
TABLE 85.BRAZIL PORTABLE DISHWASHER MARKET, BY PRICE-RANGE, 2020–2030 ($MILLION)
TABLE 86.BRAZIL PORTABLE DISHWASHER MARKET, BY END-USE, 2020–2030 ($MILLION)
TABLE 87.BRAZIL PORTABLE DISHWASHER MARKET, BY DISTRIBUTION CHANNEL, 2020–2030 ($MILLION)
TABLE 88.ARGENTINA PORTABLE DISHWASHER MARKET, BY PRICE-RANGE, 2020–2030 ($MILLION)
TABLE 89.ARGENTINA PORTABLE DISHWASHER MARKET, BY END-USE, 2020–2030 ($MILLION)
TABLE 90.ARGENTINA PORTABLE DISHWASHER MARKET, BY DISTRIBUTION CHANNEL, 2020–2030 ($MILLION)
TABLE 91.UAE PORTABLE DISHWASHER MARKET, BY PRICE-RANGE, 2020–2030 ($MILLION)
TABLE 92.UAE PORTABLE DISHWASHER MARKET, BY END-USE, 2020–2030 ($MILLION)
TABLE 93.UAE PORTABLE DISHWASHER MARKET, BY DISTRIBUTION CHANNEL, 2020–2030 ($MILLION)
TABLE 94.NIGERIA PORTABLE DISHWASHER MARKET, BY PRICE-RANGE, 2020–2030 ($MILLION)
TABLE 95.NIGERIA PORTABLE DISHWASHER MARKET, BY END-USE, 2020–2030 ($MILLION)
TABLE 96.NIGERIA PORTABLE DISHWASHER MARKET, BY DISTRIBUTION CHANNEL, 2020–2030 ($MILLION)
TABLE 97.SOUTH AFRICA PORTABLE DISHWASHER MARKET, BY PRICE-RANGE, 2020–2030 ($MILLION)
TABLE 98.SOUTH AFRICA PORTABLE DISHWASHER MARKET, BY END-USE, 2020–2030 ($MILLION)
TABLE 99.SOUTH AFRICA PORTABLE DISHWASHER MARKET, BY DISTRIBUTION CHANNEL, 2020–2030 ($MILLION)
TABLE 100.SAUDI ARABIA PORTABLE DISHWASHER MARKET, BY PRICE-RANGE, 2020–2030 ($MILLION)
TABLE 101.SAUDI ARABIA PORTABLE DISHWASHER MARKET, BY END-USE, 2020–2030 ($MILLION)
TABLE 102.SAUDI ARABIA PORTABLE DISHWASHER MARKET, BY DISTRIBUTION CHANNEL, 2020–2030 ($MILLION)
TABLE 103.REST OF LAMEA PORTABLE DISHWASHER MARKET, BY PRICE-RANGE, 2020–2030 ($MILLION)
TABLE 104.REST OF LAMEA PORTABLE DISHWASHER MARKET, BY END-USE, 2020–2030 ($MILLION)
TABLE 105.REST OF LAMEA PORTABLE DISHWASHER MARKET, BY DISTRIBUTION CHANNEL, 2020–2030 ($MILLION)
TABLE 106.DANBY: KEY EXECUTIVES
TABLE 107.DANBY: COMPANY SNAPSHOT
TABLE 108.DANBY: PRODUCT PORTFOLIO
TABLE 109.ELECTROLUX AB: KEY EXECUTIVES
TABLE 110.ELECTROLUX AB: COMPANY SNAPSHOT
TABLE 111.ELECTROLUX AB: OPERATING SEGMENTS
TABLE 112.ELECTROLUX AB: PRODUCT PORTFOLIO
TABLE 113.ELECTROLUX AB: NET SALES, 2018–2020 ($MILLION)
TABLE 114.HAIER INC.: KEY EXECUTIVES
TABLE 115.HAIER INC.: COMPANY SNAPSHOT
TABLE 116.HAIER INC.: OPERATING SEGMENTS
TABLE 117.HAIER INC.: PRODUCT PORTFOLIO
TABLE 118.HAIER INC.: R&D EXPENDITURE, 2018–2020 ($MILLION)
TABLE 119.HAIER INC.: NET SALES, 2018–2020 ($MILLION)
TABLE 120.HAVELLS INDIA LIMITED: KEY EXECUTIVES
TABLE 121.HAVELLS INDIA LIMITED: COMPANY SNAPSHOT
TABLE 122.HAVELLS INDIA LIMITED: OPERATING SEGMENTS
TABLE 123.HAVELLS INDIA LIMITED: PRODUCT PORTFOLIO
TABLE 124.HAVELLS INDIA LIMITED: R&D EXPENDITURE, 2018–2020 ($MILLION)
TABLE 125.HAVELLS INDIA LIMITED: NET SALES, 2018–2020 ($MILLION)
TABLE 126.LG ELECTRONICS INC.: KEY EXECUTIVES
TABLE 127.LG ELECTRONICS INC.: COMPANY SNAPSHOT
TABLE 128.LG ELECTRONICS INC.: OPERATING SEGMENTS
TABLE 129.LG ELECTRONICS INC.: PRODUCT PORTFOLIO
TABLE 130.LG ELECTRONICS INC.: R&D EXPENDITURE, 2018–2020 ($MILLION)
TABLE 131.LG ELECTRONICS INC.: NET SALES, 2018–2020 ($MILLION)
TABLE 132.MIDEA GROUP: KEY EXECUTIVES
TABLE 133.MIDEA GROUP: COMPANY SNAPSHOT
TABLE 134.MIDEA GROUP: OPERATING SEGMENTS
TABLE 135.MIDEA GROUP: PRODUCT PORTFOLIO
TABLE 136.MIDEA GROUP: R&D EXPENDITURE, 2018–2020 ($MILLION)
TABLE 137.MIDEA GROUP: NET SALES, 2018–2020 ($MILLION)
TABLE 138.PANASONIC CORPORATION: KEY EXECUTIVES
TABLE 139.PANASONIC CORPORATION: COMPANY SNAPSHOT
TABLE 140.PANASONIC CORPORATION: OPERATING SEGMENTS
TABLE 141.PANASONIC CORPORATION: PRODUCT PORTFOLIO
TABLE 142.PANASONIC CORPORATION: R&D EXPENDITURE, 2018–2020 ($MILLION)
TABLE 143.PANASONIC CORPORATION: NET SALES, 2018–2020 ($MILLION)
TABLE 144.SAMSUNG ELECTRONICS CO. LTD.: KEY EXECUTIVES
TABLE 145.SAMSUNG ELECTRONICS CO. LTD.: COMPANY SNAPSHOT
TABLE 146.SAMSUNG ELECTRONICS CO. LTD.: OPERATING SEGMENTS
TABLE 147.SAMSUNG ELECTRONICS CO. LTD.: PRODUCT PORTFOLIO
TABLE 148.SAMSUNG ELECTRONICS CO. LTD.: R&D EXPENDITURE, 2018–2020 ($MILLION)
TABLE 149.SAMSUNG ELECTRONICS CO. LTD.: NET SALES, 2018–2020 ($MILLION)
TABLE 150.THE MIDDLEBY CORPORATION: KEY EXECUTIVES
TABLE 151.THE MIDDLEBY CORPORATION: COMPANY SNAPSHOT
TABLE 152.THE MIDDLEBY CORPORATION: OPERATING SEGMENTS
TABLE 153.THE MIDDLEBY CORPORATION: PRODUCT PORTFOLIO
TABLE 154.THE MIDDLEBY CORPORATION: R&D EXPENDITURE, 2018–2020 ($MILLION)
TABLE 155.THE MIDDLEBY CORPORATION: NET SALES, 2018–2020 ($MILLION)
TABLE 156.WHIRLPOOL CORP.: KEY EXECUTIVES
TABLE 157.WHIRLPOOL CORP.: COMPANY SNAPSHOT
TABLE 158.WHIRLPOOL CORP.: OPERATING SEGMENTS
TABLE 159.WHIRLPOOL CORP.: PRODUCT PORTFOLIO
TABLE 160.WHIRLPOOL CORP.: NET SALES, 2018–2020 ($MILLION)

LIST OF FIGURES

FIGURE 01.PORTABLE DISHWASHER MARKET SNAPSHOT
FIGURE 02.PORTABLE DISHWASHER MARKET: SEGMENTATION
FIGURE 03.TOP IMPACTING FACTORS
FIGURE 04.TOP INVESTMENT POCKETS
FIGURE 05.TOP PLAYERS POSITIONING
FIGURE 06.VALUE CHAIN ANALYSIS
FIGURE 07.MODERATE BARGAINING POWER OF SUPPLIERS
FIGURE 08.MODERATE BARGAINING POWER OF BUYERS
FIGURE 09.MODERATE THREAT OF SUBSTITUTION
FIGURE 10.MODERATE THREAT OF NEW ENTRANTS
FIGURE 11.MODERATE INTENSITY OF COMPETITIVE RIVALRY
FIGURE 12.PORTABLE DISHWASHER MARKET: DRIVERS, RESTRAINTS, AND OPPORTUNITIES
FIGURE 13.PRICING ANALYSIS
FIGURE 14.PARENT/PEER ANALYSIS
FIGURE 15.PORTABLE DISHWASHER MARKET REVENUE, BY PRICE-RANGE, 2020 (%)
FIGURE 16.COMPARATIVE SHARE ANALYSIS OF ECONOMY PORTABLE DISHWASHER MARKET REVENUE, BY COUNTRY, 2020 & 2030(%)
FIGURE 17.COMPARATIVE SHARE ANALYSIS FOR MID-RANGE PORTABLE DISHWASHER MARKET REVENUE, BY COUNTRY, 2020 & 2030(%)
FIGURE 18.COMPARATIVE SHARE ANALYSIS FOR LUXURY PORTABLE DISHWASHER MARKET REVENUE, BY COUNTRY, 2020 & 2030(%)
FIGURE 19.PORTABLE DISHWASHER MARKET, BY END-USE, 2020 (%)
FIGURE 20.COMPARATIVE SHARE ANALYSIS OF PORTABLE DISHWASHER MARKET FOR COMMERCIAL, BY COUNTRY, 2020 & 2030(%)
FIGURE 21.COMPARATIVE SHARE ANALYSIS OF PORTABLE DISHWASHER MARKET FOR RESIDENTIAL, BY COUNTRY, 2020 & 2030 (%)
FIGURE 22.PORTABLE DISHWASHER MARKET, BY DISTRIBUTION CHANNEL, 2020 (%)
FIGURE 23.COMPARATIVE SHARE ANALYSIS OF PORTABLE DISHWASHER MARKET FOR SUPERMARKET & HYPERMARKET, BY COUNTRY, 2020 & 2030(%)
FIGURE 24.COMPARATIVE SHARE ANALYSIS OF PORTABLE DISHWASHER MARKET FOR SPECIALTY STORES, BY COUNTRY, 2020 & 2030 (%)
FIGURE 25.COMPARATIVE SHARE ANALYSIS OF PORTABLE DISHWASHER MARKET FOR CONVENIENCE STORES, BY COUNTRY, 2020 & 2030 (%)
FIGURE 26.COMPARATIVE SHARE ANALYSIS OF PORTABLE DISHWASHER MARKET FOR E-COMMERCE, BY COUNTRY, 2020 & 2030 (%)
FIGURE 27.COMPARATIVE SHARE ANALYSIS OF PORTABLE DISHWASHER MARKET FOR OTHERS, BY COUNTRY, 2020 & 2030 (%)
FIGURE 28.PORTABLE DISHWASHER MARKET, BY REGION, 2020 (%)
FIGURE 29.U.S. PORTABLE DISHWASHER MARKET, 2020–2030 ($MILLION)
FIGURE 30.CANADA PORTABLE DISHWASHER MARKET, 2020–2030 ($MILLION)
FIGURE 31.MEXICO PORTABLE DISHWASHER MARKET, 2020–2030 ($MILLION)
FIGURE 32.GERMANY PORTABLE DISHWASHER MARKET, 2020–2030 ($MILLION)
FIGURE 33.FRANCE PORTABLE DISHWASHER MARKET, 2020–2030 ($MILLION)
FIGURE 34.UK PORTABLE DISHWASHER MARKET, 2020–2030 ($MILLION)
FIGURE 35.ITALY PORTABLE DISHWASHER MARKET, 2020–2030 ($MILLION)
FIGURE 36.SPAIN PORTABLE DISHWASHER MARKET, 2020–2030 ($MILLION)
FIGURE 37.RUSSIA PORTABLE DISHWASHER MARKET, 2020–2030 ($MILLION)
FIGURE 38.REST OF EUROPE PORTABLE DISHWASHER MARKET, 2020–2030 ($MILLION)
FIGURE 39.CHINA PORTABLE DISHWASHER MARKET, 2020–2030 ($MILLION)
FIGURE 40.JAPAN PORTABLE DISHWASHER MARKET, 2020–2030 ($MILLION)
FIGURE 41.INDIA PORTABLE DISHWASHER MARKET, 2020–2030 ($MILLION)
FIGURE 42.AUSTRALIA PORTABLE DISHWASHER MARKET, 2020–2030 ($MILLION)
FIGURE 43.SOUTH KOREA PORTABLE DISHWASHER MARKET, 2020–2030 ($MILLION)
FIGURE 44.THAILAND PORTABLE DISHWASHER MARKET, 2020–2030 ($MILLION)
FIGURE 45.SINGAPORE PORTABLE DISHWASHER MARKET, 2020–2030 ($MILLION)
FIGURE 46.REST OF ASIA-PACIFIC PORTABLE DISHWASHER MARKET, 2020–2030 ($MILLION)
FIGURE 47.BRAZIL PORTABLE DISHWASHER MARKET, 2020–2030 ($MILLION)
FIGURE 48.ARGENTINA PORTABLE DISHWASHER MARKET, 2020–2030 ($MILLION)
FIGURE 49.UAE PORTABLE DISHWASHER MARKET, 2020–2030 ($MILLION)
FIGURE 50.NIGERIA PORTABLE DISHWASHER MARKET, 2020–2030 ($MILLION)
FIGURE 51.SOUTH AFRICA PORTABLE DISHWASHER MARKET, 2020–2030 ($MILLION)
FIGURE 52.SAUDI ARABIA PORTABLE DISHWASHER MARKET, 2020–2030 ($MILLION)
FIGURE 53.REST OF LAMEA PORTABLE DISHWASHER MARKET, 2020–2030 ($MILLION)
FIGURE 54.TOP WINNING STRATEGIES, BY YEAR, 2017–2021*
FIGURE 55.TOP WINNING STRATEGIES, BY DEVELOPMENT, 2017–2021* (%)
FIGURE 56.PRODUCT MAPPING OF TOP 10 KEY PLAYERS
FIGURE 57.COMPETITIVE DASHBOARD OF TOP 10 KEY PLAYERS
FIGURE 58.COMPETITIVE HEATMAP OF TOP 10 KEY PLAYERS
FIGURE 59.ELECTROLUX AB: NET SALES, 2018–2020 ($MILLION)
FIGURE 60.ELECTROLUX AB: REVENUE SHARE BY SEGMENT, 2020 (%)
FIGURE 61.HAIER INC.: R&D EXPENDITURE, 2018–2020 ($MILLION)
FIGURE 62.HAIER INC.: NET SALES, 2018–2020 ($MILLION)
FIGURE 63.HAIER INC.: REVENUE SHARE BY SEGMENT, 2020 (%)
FIGURE 64.HAVELLS INDIA LIMITED: R&D EXPENDITURE, 2018–2020 ($MILLION)
FIGURE 65.HAVELLS INDIA LIMITED: NET SALES, 2018–2020 ($MILLION)
FIGURE 66.HAVELLS INDIA LIMITED: REVENUE SHARE BY SEGMENT, 2020 (%)
FIGURE 67.LG ELECTRONICS INC.: R&D EXPENDITURE, 2018–2020 ($MILLION)
FIGURE 68.LG ELECTRONICS INC.: NET SALES, 2018–2020 ($MILLION)
FIGURE 69.LG ELECTRONICS INC.: REVENUE SHARE BY SEGMENT, 2020 (%)
FIGURE 70.MIDEA GROUP: R&D EXPENDITURE, 2018–2020 ($MILLION)
FIGURE 71.MIDEA GROUP: NET SALES, 2018–2020 ($MILLION)
FIGURE 72.MIDEA GROUP: REVENUE SHARE BY SEGMENT, 2020 (%)
FIGURE 73.PANASONIC CORPORATION: R&D EXPENDITURE, 2018–2020 ($MILLION)
FIGURE 74.PANASONIC CORPORATION: NET SALES, 2018–2020 ($MILLION)
FIGURE 75.PANASONIC CORPORATION: REVENUE SHARE BY SEGMENT, 2020 (%)
FIGURE 76.SAMSUNG ELECTRONICS CO. LTD.: R&D EXPENDITURE, 2018–2020 ($MILLION)
FIGURE 77.SAMSUNG ELECTRONICS CO. LTD.: NET SALES, 2018–2020 ($MILLION)
FIGURE 78.SAMSUNG ELECTRONICS CO. LTD.: REVENUE SHARE BY SEGMENT, 2020 (%)
FIGURE 79.SAMSUNG ELECTRONICS CO. LTD.: REVENUE SHARE BY REGION, 2020 (%)
FIGURE 80.THE MIDDLEBY CORPORATION: R&D EXPENDITURE, 2018–2020 ($MILLION)
FIGURE 81.THE MIDDLEBY CORPORATION: NET SALES, 2018–2020 ($MILLION)
FIGURE 82.THE MIDDLEBY CORPORATION: REVENUE SHARE BY SEGMENT, 2020 (%)
FIGURE 83.THE MIDDLEBY CORPORATION: REVENUE SHARE BY REGION, 2020 (%)
FIGURE 84.WHIRLPOOL CORP.: NET SALES, 2018–2020 ($MILLION)
FIGURE 85.WHIRLPOOL CORP.: REVENUE SHARE BY SEGMENT, 2020 (%)


According to the insights of CXO perspective, rapid expansion of the retail industry plays a major role in the distribution of white goods products such as portable dishwashers. It is becoming more important to make portable dishwasher available to the consumers. Specialty stores and supermarket & hypermarkets are expanding rapidly, owing to the availability of enormous options for consumers to choose from. Multi-brand specialty stores have many brands for the single line product segment, where people can compare their features and colors, which help them to take buying decisions.

Increase in number of commercial & government complexes in various end user industries of the white goods products such as hotels & restaurants, food outlets, hospitals & clinics, and cleaning agencies is creating huge demand for air conditioners, portable dishwasher, washing machines, microwave ovens, and vacuum cleaners. People are actively taking interest in the improvement of homes and kitchens with smart home appliances, which is further contributor to the growth of the portable dishwasher market during the forecast period.

However, lack of proper electrification in rural areas and distribution of channels is the major challenge for growth of the portable dishwasher market in the rural sector. Manufacturers need to address correct requirements of rural consumers and accordingly design portable dishwashers, which acts as a major challenge for portable dishwasher manufacturers. The key players in the industry are focusing on investing on product development to provide additional benefits to the consumer. They have integrated the sensor and features to the product which can be connected to smartphones to monitor the levels in the portable dishwasher.


PURCHASE OPTIONS

Call or Email us

U.S.-Canada Toll-free: +1-800-792-5285
Int'l : +1-503-894-6022
Europe : +44-845-528-1300
Email : help@alliedmarketresearch.com
 
FREQUENTLY ASKED QUESTIONS?

A. At 9.9% CAGR, the Portable Dishwasher market will expand from 2021 – 2030.

A. The market value of Portable Dishwasher market by the end of 2030 is $9,829.1 million.

A. Exponential increase in population density in metro cities, increase in personal disposable income and affordable credit facilities are promoting people to improve and design their living rooms and kitchens are the impacting factors of the Portable Dishwasher market.

A. The leading players profiled in the report include Danby, Electrolux AB, Haier lnc., Havells India Limited, LG Electronics Inc., Midea Group, Panasonic Corporation, Samsung Electronics Co. Ltd., the Middleby Corporation, and Whirlpool Corp.

A. Price-range, end use and distribution channel are the segments of the Portable Dishwasher market.

A. Business expansion and product launch as their key developmental strategies of the Portable Dishwasher market players.

A. Commercial segment held the major share in the Portable Dishwasher Market.

Looking for Customization?

 Customization Request

Have a Question?

 Speak with Analyst

Any Confusion?

 Inquire Before Buying

Have a glance of the Report

  Request Sample
RELATED TAGS

Purchase Full Report of
Portable Dishwasher Market

Start reading instantly.
This Report and over 66,905+ more Reports, Available with Avenue Library. T&C*.

  • Online Only
  • $3,712
  • Online cloud access only
  • Restricted print, copy, paste & download
  • Read only
  • Free industry update
    (Within 180 days)
  • Free report update in next update cycle
    (Sep 2022 - Sep 2023)
  • Data Pack
  • $4,125
  • Restricted to one authorized user
  • One print only
  • Available in
    Excel
  • Free industry update
    (Within 180 days)
  •   Free report update in next update cycle
    (Sep 2022 - Sep 2023)
  • Single User
  • $5,769
  • Restricted to one authorized user
  • One print only
  • Available in
    PDF
  • Free industry update
    (Within 180 days)
  •   Free report update in next update cycle
    (Sep 2022 - Sep 2023)
  • Five Users
  • $6,929
  • Limited to five authorized users
  • Print upto five copies
  • Available in
    PDF
  • Free industry update
    (Within 180 days)
  •   Free report update in next update cycle
    (Sep 2022 - Sep 2023)
  • Enterprise
    License/PDF

  • $10,663
  • Unlimited
    within
    company/enterprise
  • Available in Excel & PDF
  • Free industry update
    (Within 180 days)
  •   Free report update in next update cycle
    (Sep 2022 - Sep 2023)
  • Library
    Membership

  • $999 $ 1,175
    Per User/ Per month/ Billed annually
  • Published Content
    E-access
  • Company Profiles
    E-access
  • Newly Added Content Access
  • 10 PDF
    Downloads
  • 5 Excel Data
    Pack Downloads
  • 250 Company Profiles PDF Downloads
  • Buy Now

*Taxes/Fees, if applicable will be added during checkout. All prices in USD

RELATED REPORTS
 

Why Allied Market Research?


Infallible Methodology

To ensure high-level data integrity, accurate analysis, and impeccable forecasts

Analyst Support

For complete satisfaction

Customization

On-demand customization of scope of the report to exactly meet your needs

TARGETED MARKET VIEW

Targeted market view to provide pertinent information and save time of readers

Get fresh content delivered

Get insights on topics that are crucial for your business. Stay abreast of your interest areas.

Get Industry Data Alerts

Why Allied Market Research?

Infallible Methodology

To ensure high-level data integrity, accurate analysis, and impeccable forecasts

Analyst Support

For complete satisfaction

Customization

On-demand customization of scope of the report to exactly meet your needs

TARGETED MARKET VIEW

Targeted market view to provide pertinent information and save time of readers