0
2018
Portable Printer Market

Portable Printer Market

by Technology (Inkjet, Thermal, and Impact) and Industry Vertical (Healthcare, Retail, Telecom, Transportation & Logistics, and Others) - Global Opportunities Analysis and Industry Forecast, 2017-2023

Report Code: A04194
Jan 2018 | Pages: 209
Tables: 100
Charts: 45
  • Formats*:

  • pdf

    Single User License, Five User
    License & Enterprise User License

  • xls

    Data Pack Excel License

  • ppt

    It comes with the additional cost
    of $2500.00 contact sales.


COVID-19

Pandemic disrupted the entire world and affected many industries.

Get detailed COVID-19 impact analysis on the Portable Printer Market

Request Now !

Portable Printer Market Overview:

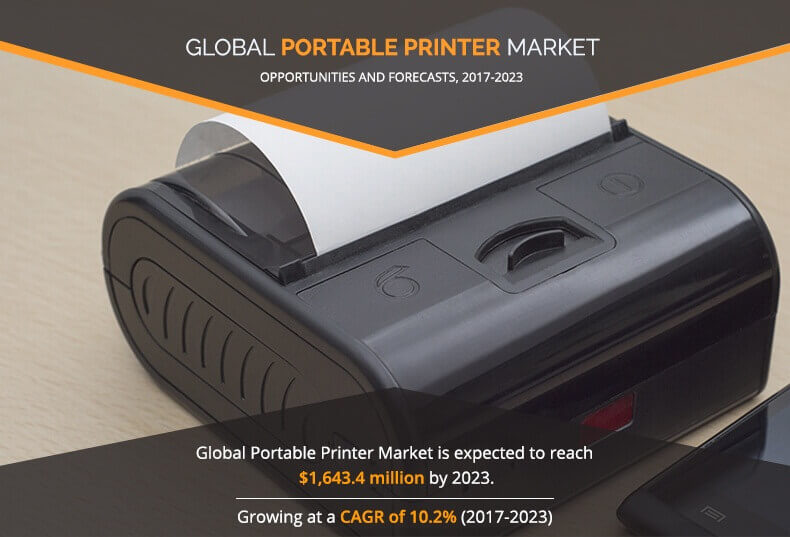
The global portable printer market was valued at $844.19 million in 2016, and is estimated to reach $1,643.40 million by 2023, growing at a CAGR of 10.2% from 2017 to 2023.

Portable Printer is a peripheral device that allows user to generate hard copy of the data stored or gathered using digital devices via universal serial bus (USB) or Bluetooth. Portable printer is smaller, compact, and wireless in nature, and it can be easy movable & carried out from one place to another. The features such as easy paper loading, high speed printing, and light weight design, makes it beneficial & easy to use.

The other features such as simplicity in terms of paper loading, flexible function, and wireless operation make it suitable for the different industry verticals such as retail, healthcare, transportation, and others. The others include hospitality and manufacturing sector. The portable printers are also known as mobile printer and it prints all document format including Microsoft office suite and pdf. At present, portable printers are categorized as inkjet, thermal, and impact based on technology. This enables faster & accurate data processing and effective documentation.

The growth of the global portable printer market is driven by compact size & on-demand printing capacity, growth in internet penetration & rise in adoption of smart devices, proliferation of online businesses such as ecommerce, rise in mobile workforce management among industries, and increase in adoption of BYOD policy. The businesses are expanding their operations across the globe and they are also focusing on innovating and modernizing their business in terms of technology, work management, and resource management. The traditional office printers require a huge space and it is difficult to move from one place to another. It is bulky in shape and require proper maintenance. The portable printers or mobile printers are smaller in shape and hence, can be easily movable. Few examples such as ticket printing for a passenger while travelling, receipt print out through the ATM machine, and many more applications require quick print outs. Portable printer makes it possible easily and quickly, drives the demand for portable printer in the market. The rise in adoption of smart devices such as tablets and smartphones provide easy accessibility and flexibility to the user, they can print the document as per their requirements. Thus, smart & connected devices with high-speed internet availability, drive the growth of the portable printer market. Handheld devices and smartphones provide greater flexibility, productivity, and accuracy in terms of the task performed and work managed by the employees. The connected & smart devices such as smartphones and tablets, support different operating systems such as Windows, iOS, and Android that enable printed documents with portable printer.

However, rise in investment on digitization across the globe is expected to restrict the portable printer market growth. Digitization is the conversion of analogue information into digital information. Digitization leads to improved customer experience, increase marketing, sales & service effectiveness, improved transaction speed, and improved supplier relationship management. This results in obsolescence in the printed document trends, and hence restrict the adoption of portable printer in the market. Conversely, research & development on better battery runtime time & availability of more number of pages is expected to provide potential growth opportunities for the portable printer market.

The key players operating in the Portable Printer market are Bixolon Co. Ltd, Brother Industries Ltd., Canon Inc., Fujitsu, Hewlett Packard Enterprise Development LP, Honeywell International Inc., Polaroid Corporation, Printek LLC, Toshiba Tec Corporation, and ZEBRA Technologies.

Segment Overview

The report segments the Portable Printer market on the basis of technology, industry vertical, and geography. Based on technology, the market is categorized as inkjet, thermal, and impact. According to industry vertical, it is fragmented into healthcare, retail, telecom, transportation & logistics, and others. Geographically, it is analyzed across North America, Europe, Asia-Pacific, and LAMEA.


Top Impacting Factors

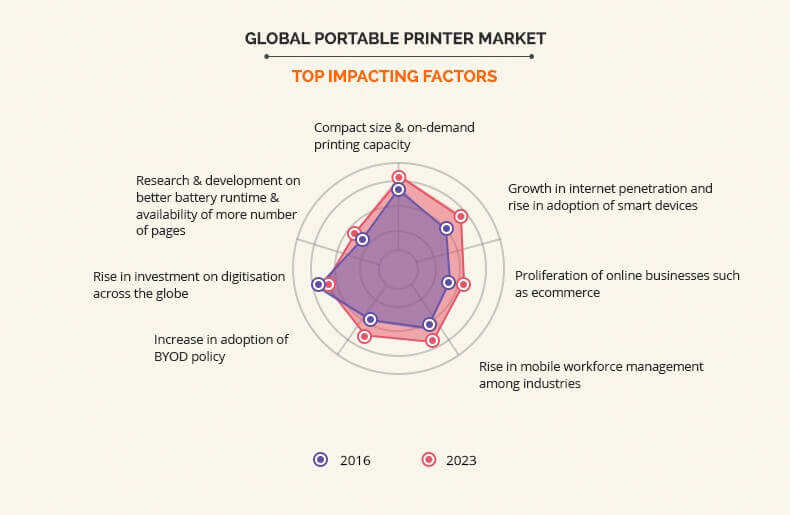
Compact Size & On-demand Printing Capacity

The businesses are focusing on rapid expansion in terms of product offerings and the services. This strategic movement involves greater mobility and flexibility in the documentation process. This in result, provides greater and effective business operation.

Growth in Internet Penetration and Rise In Adoption of Smart Devices

The increase in internet penetration and WIFI connectivity across various nations, support digital storage, drives the demand for portable printer. Furthermore, the decrease in prices of digital notebooks support the growth of the market.

Rise in Investment on Digitization Across the Globe

Digitization is the conversion of analogue information into digital information. Digitization leads to improved customer experience, increase marketing, sales & service effectiveness, improved transaction speed, and improved supplier relationship management. The government across various developing nations such as India, Singapore, China, and many more, are investing huge on building digital infrastructure.

Key Benefits for Stakeholders

  • This report provides an extensive analysis of the current and emerging market trends, and dynamics in the portable printer market.
  • In-depth analysis is conducted by constructing global portable printer market estimations for the key market segments between 2016 and 2023.
  • Extensive analysis of the market is conducted by following key product positioning and monitoring the top competitors within the portable printer industry framework.
  • Key players are profiled and their strategies are analyzed thoroughly to understand the competitive outlook of the global portable printer market.

Portable Printer Market Report Highlights

Aspects Details
By Technology
  • Inkjet
  • Thermal
  • Impact
By Industry Vertical
  • Healthcare
  • Retail
  • Telecom
  • Transportation & Logistics
  • Others
By Geography
  • North America
    • U.S.
    • Canada
    • Mexico
  • Europe
    • UK
    • Germany
    • France
    • Russia
    • Rest of Europe
  • Asia-Pacific
    • China
    • India
    • Japan
    • Australia
    • Rest of Asia-Pacific
  • LAMEA
    • Latin America
    • Middle East
    • Africa
Key Market Players BROTHER INDUSTRIES, LTD., BIXOLON CO., LTD., ZEBRA TECHNOLOGIES CORPORATION, HEWLETT PACKARD ENTERPRISE (HEWLETT PACKARD ENTERPRISE DEVELOPMENT LP), PLR IP HOLDINGS, LLC (POLAROID CORPORATION), PRINTEK LLC, HONEYWELL INTERNATIONAL INC., FUJITSU LIMITED, CANON INC., TOSHIBA CORPORATION (TOSHIBA TEC CORPORATION)
 

CHAPTER 1: INTRODUCTION

1.1. REPORT DESCRIPTION
1.2. KEY BENEFITS
1.3. KEY MARKET SEGMENT
1.4. RESEARCH METHODOLOGY

1.4.1. Secondary research
1.4.2. Primary research
1.4.3. Analyst tools & models

CHAPTER 2: EXECUTIVE SUMMARY

2.1. CXO PERSPECTIVE

CHAPTER 3: MARKET OVERVIEW

3.1. MARKET DEFINITION AND SCOPE
3.2. KEY FINDINGS

3.2.1. Top impacting factors
3.2.2. Top investment pockets
3.2.3. Top winning strategies

3.2.3.1. Top winning strategies, by year 2014-2017
3.2.3.2. Top winning strategies, by development 2014-2017
3.2.3.3. Top winning strategies, by company 2014-2017

3.3. PORTER'S FIVE FORCES ANALYSIS
3.4. MARKET SHARE ANALYSIS, 2015
3.5. MARKET DYNAMICS

3.5.1. Drivers

3.5.1.1. Compact size & on-demand printing capacity
3.5.1.2. Growth in internet penetration and rise in adoption of smart devices
3.5.1.3. Proliferation of online businesses such as ecommerce and online grocery
3.5.1.4. Rise in mobile workforce management among industries
3.5.1.5. Increase in adoption of BYOD policy

3.5.2. Restraints

3.5.2.1. Rise in investment on digitisation across the globe

3.5.3. Opportunities

3.5.3.1. Research & development on better battery runtime & availability of more number of pages

CHAPTER 4: PORTABLE PRINTER MARKET BY TECHNOLOGY

4.1. OVERVIEW
4.2. INKJET

4.2.1. Key market trends and opportunities
4.2.2. Market size and forecast by region
4.2.3. Market analysis by country

4.3. THERMAL

4.3.1. Key market trends and opportunities
4.3.2. Market size and forecast by region
4.3.3. Market analysis by country

4.4. IMPACT

4.4.1. Key market trends and opportunities
4.4.2. Market size and forecast by region
4.4.3. Market analysis by country

CHAPTER 5: PORTABLE PRINTER MARKET BY INDUSTRY VERTICAL

5.1. OVERVIEW
5.2. HEALTHCARE

5.2.1. Key market trends and opportunities
5.2.2. Market size and forecast by region
5.2.3. Market analysis by country

5.3. RETAIL

5.3.1. Key market trends and opportunities
5.3.2. Market size and forecast by region
5.3.3. Market analysis by country

5.4. TELECOM

5.4.1. Key market trends and opportunities
5.4.2. Market size and forecast by region
5.4.3. Market analysis by country

5.5. TRANSPORTATION & LOGISTICS

5.5.1. Key market trends and opportunities
5.5.2. Market size and forecast by region
5.5.3. Market analysis by country

5.6. OTHERS

5.6.1. Key market trends and opportunities
5.6.2. Market size and forecast by region
5.6.3. Market analysis by country

CHAPTER 6: PORTABLE PRINTER MARKET BY GEOGRAPHY

6.1. OVERVIEW
6.2. NORTH AMERICA

6.2.1. Key market trends and opportunities
6.2.2. Market size and forecast by technology
6.2.3. Market size and forecast by industry vertical
6.2.4. Market analysis by country

6.2.4.1. U.S.

6.2.4.1.1. Market size and forecast
6.2.4.1.2. Market size and forecast, by TECHNOLOGY
6.2.4.1.3. Market size and forecast, by industry vertical

6.2.4.2. Canada

6.2.4.2.1. Market size and forecast
6.2.4.2.2. Market size and forecast, by technology
6.2.4.2.3. Market size and forecast, by industry vertical

6.2.4.3. Mexico

6.2.4.3.1. Market size and forecast
6.2.4.3.2. Market size and forecast, by technology
6.2.4.3.3. Market size and forecast, by industry vertical

6.3. EUROPE

6.3.1. Key market trends and opportunities
6.3.2. Market size and forecast by technology
6.3.3. Market size and forecast by industry vertical
6.3.4. Market analysis by country

6.3.4.1. UK

6.3.4.1.1. Market size and forecast
6.3.4.1.2. Market size and forecast, by technology
6.3.4.1.3. Market size and forecast, by industry vertical

6.3.4.2. Germany

6.3.4.2.1. Market size and forecast
6.3.4.2.2. Market size and forecast, by technology
6.3.4.2.3. Market size and forecast, by Industry Vertical

6.3.4.3. France

6.3.4.3.1. Market size and forecast
6.3.4.3.2. Market size and forecast, by technology
6.3.4.3.3. Market size and forecast, by Industry Vertical

6.3.4.4. Italy

6.3.4.4.1. Market size and forecast
6.3.4.4.2. Market size and forecast, by Technology
6.3.4.4.3. Market size and forecast, by Industry Vertical

6.3.4.5. Rest of Europe

6.3.4.5.1. Market size and forecast
6.3.4.5.2. Market size and forecast, by Technology
6.3.4.5.3. Market size and forecast, by Industry Vertical

6.4. ASIA-PACIFIC

6.4.1. Key market trends and opportunities
6.4.2. Market size and forecast by Technology
6.4.3. Market size and forecast by Industry Vertical
6.4.4. Market analysis by country

6.4.4.1. China

6.4.4.1.1. Market size and forecast
6.4.4.1.2. Market size and forecast, by Technology
6.4.4.1.3. Market size and forecast, by Industry Vertical

6.4.4.2. India

6.4.4.2.1. Market size and forecast
6.4.4.2.2. Market size and forecast, by Technology
6.4.4.2.3. Market size and forecast, by Industry Vertical

6.4.4.3. Japan

6.4.4.3.1. Market size and forecast
6.4.4.3.2. Market size and forecast, by Technology
6.4.4.3.3. Market size and forecast, by Industry Vertical

6.4.4.4. Australia

6.4.4.4.1. Market size and forecast
6.4.4.4.2. Market size and forecast, by Technology
6.4.4.4.3. Market size and forecast, by Industry Vertical

6.4.4.5. Rest of Asia-Pacific

6.4.4.5.1. Market size and forecast
6.4.4.5.2. Market size and forecast, by Technology
6.4.4.5.3. Market size and forecast, by Industry Vertical

6.5. LAMEA

6.5.1. Key market trends and opportunities
6.5.2. Market size and forecast by Technology
6.5.3. Market size and forecast by Industry Vertical
6.5.4. Market analysis by Region

6.5.4.1. Latin America

6.5.4.1.1. Market size and forecast
6.5.4.1.2. Market size and forecast, by Technology
6.5.4.1.3. Market size and forecast, by Industry Vertical

6.5.4.2. Middle East

6.5.4.2.1. Market size and forecast
6.5.4.2.2. Market size and forecast, by Technology
6.5.4.2.3. Market size and forecast, by Industry Vertical

6.5.4.3. Africa

6.5.4.3.1. Market size and forecast
6.5.4.3.2. Market size and forecast, by Technology
6.5.4.3.3. Market size and forecast, by Industry Vertical

CHAPTER 7: COMPANY PROFILE

7.1. BIXOLON CO., LTD.

7.1.1. Company overview
7.1.2. Company snapshot
7.1.3. Operating business segments
7.1.4. Product portfolio
7.1.5. Business performance
7.1.6. Key strategic moves and developments

7.2. BROTHER INDUSTRIES, LTD.

7.2.1. Company overview
7.2.2. Company snapshot
7.2.3. Operating business segments
7.2.4. Product portfolio
7.2.5. Business performance

7.3. CANON INC.

7.3.1. Company overview
7.3.2. Company snapshot
7.3.3. Operating business segments
7.3.4. Product portfolio
7.3.5. Business performance
7.3.6. Key strategic moves and developments

7.4. PRINTEK LLC

7.4.1. Company overview
7.4.2. Company snapshot
7.4.3. Operating business segments
7.4.4. Product portfolio
7.4.5. Key strategic moves and developments

7.5. FUJITSU LIMITED

7.5.1. Company overview
7.5.2. Company snapshot
7.5.3. Operating business segments
7.5.4. Product portfolio
7.5.5. Business performance

7.6. HEWLETT PACKARD ENTERPRISE (HEWLETT PACKARD ENTERPRISE DEVELOPMENT LP)

7.6.1. Company overview
7.6.2. Company snapshot
7.6.3. Operating business segments
7.6.4. Product portfolio
7.6.5. Business performance
7.6.6. Key strategic moves and developments

7.7. HONEYWELL INTERNATIONAL INC.

7.7.1. Company overview
7.7.2. Company snapshot
7.7.3. Operating business segments
7.7.4. Product portfolio
7.7.5. Business performance
7.7.6. Key strategic moves and developments

7.8. PLR IP HOLDINGS, LLC (POLAROID CORPORATION)

7.8.1. Company overview
7.8.2. Company snapshot
7.8.3. Product portfolio
7.8.4. Key strategic moves and developments

7.9. TOSHIBA CORPORATION (TOSHIBA TEC CORPORATION)

7.9.1. Company overview
7.9.2. Company snapshot
7.9.3. Operating business segments
7.9.4. Product portfolio
7.9.5. Business performance
7.9.6. Key strategic moves and developments

7.10. ZEBRA TECHNOLOGIES CORPORATION

7.10.1. Company overview
7.10.2. Company snapshot
7.10.3. Operating business segments
7.10.4. Product portfolio
7.10.5. Business performance
7.10.6. Key strategic moves and developments

LIST OF TABLES

TABLE 01. GLOBAL PORTABLE PRINTER MARKET REVENUE, BY TECHNOLOGY, 2016-2023 ($MILLION)
TABLE 02. GLOBAL PORTABLE PRINTER MARKET REVENUE FOR INKJET, BY REGION, 2016-2023 ($MILLION)
TABLE 03. GLOBAL PORTABLE PRINTER MARKET REVENUE FOR THERMAL, BY REGION, 2016-2023 ($MILLION)
TABLE 04. GLOBAL PORTABLE PRINTER MARKET REVENUE FOR IMPACT, BY REGION, 2016-2023 ($MILLION)
TABLE 05. GLOBAL PORTABLE PRINTER MARKET REVENUE, BY INDUSTRY VERTICAL, 2016-2023 ($MILLION)
TABLE 06. GLOBAL PORTABLE PRINTER MARKET REVENUE FOR HEALTHCARE, BY REGION, 2016-2023 ($MILLION)
TABLE 07. GLOBAL PORTABLE PRINTER MARKET REVENUE FOR RETAIL, BY REGION, 2016-2023 ($MILLION)
TABLE 08. GLOBAL PORTABLE PRINTER MARKET REVENUE FOR TELECOM, BY REGION, 2016-2023 ($MILLION)
TABLE 09. GLOBAL PORTABLE PRINTER MARKET REVENUE FOR TRANSPORTATION & LOGISTICS, BY REGION, 2016-2023 ($MILLION)
TABLE 10. GLOBAL PORTABLE PRINTER MARKET REVENUE FOR OTHERS, BY REGION, 2016-2023 ($MILLION)
TABLE 11. GLOBAL PORTABLE PRINTER MARKET REVENUE, BY REGION, 2016-2023 ($MILLION)
TABLE 12. NORTH AMERICA PORTABLE PRINTER MARKET REVENUE FOR TECHNOLOGY, 2016-2023 ($MILLION)
TABLE 13. NORTH AMERICA PORTABLE PRINTER MARKET REVENUE FOR INDUSTRY VERTICAL, 2016-2023 ($MILLION)
TABLE 14. NORTH AMERICA PORTABLE PRINTER MARKET REVENUE, BY COUNTRY 2016-2023 ($MILLION)
TABLE 15. U.S. PORTABLE PRINTER MARKET REVENUE, 2016-2023 ($MILLION)
TABLE 16. U.S. PORTABLE PRINTER MARKET REVENUE, BY TECHNOLOGY, 2016-2023 ($MILLION)
TABLE 17. U.S. PORTABLE PRINTER MARKET REVENUE, BY INDUSTRY VERTICAL, 2016-2023 ($MILLION)
TABLE 18. CANADA PORTABLE PRINTER MARKET REVENUE, 2016-2023 ($MILLION)
TABLE 19. CANADA PORTABLE PRINTER MARKET REVENUE, BY TECHNOLOGY, 2016-2023 ($MILLION)
TABLE 20. CANADA PORTABLE PRINTER MARKET REVENUE, BY INDUSTRY VERTICAL, 2016-2023 ($MILLION)
TABLE 21. MEXICO PORTABLE PRINTER MARKET REVENUE, 2016-2023 ($MILLION)
TABLE 22. MEXICO PORTABLE PRINTER MARKET REVENUE, BY TECHNOLOGY, 2016-2023 ($MILLION)
TABLE 23. MEXICO PORTABLE PRINTER MARKET REVENUE, BY INDUSTRY VERTICAL, 2016-2023 ($MILLION)
TABLE 24. EUROPE PORTABLE PRINTER MARKET REVENUE FOR TECHNOLOGY, 2016-2023 ($MILLION)
TABLE 25. EUROPE PORTABLE PRINTER MARKET REVENUE FOR INDUSTRY VERTICAL, 2016-2023 ($MILLION)
TABLE 26. EUROPE PORTABLE PRINTER MARKET REVENUE, BY COUNTRY 2016-2023 ($MILLION)
TABLE 27. UK PORTABLE PRINTER MARKET REVENUE, 2016-2023 ($MILLION)
TABLE 28. UK PORTABLE PRINTER MARKET REVENUE, BY TECHNOLOGY, 2016-2023 ($MILLION)
TABLE 29. UK PORTABLE PRINTER MARKET REVENUE, BY INDUSTRY VERTICAL, 2016-2023 ($MILLION)
TABLE 30. GERMANY PORTABLE PRINTER MARKET REVENUE, 2016-2023 ($MILLION)
TABLE 31. GERMANY PORTABLE PRINTER MARKET REVENUE, BY TECHNOLOGY, 2016-2023 ($MILLION)
TABLE 32. GERMANY PORTABLE PRINTER MARKET REVENUE, BY INDUSTRY VERTICAL, 2016-2023 ($MILLION)
TABLE 33. FRANCE PORTABLE PRINTER MARKET REVENUE, 2016-2023 ($MILLION)
TABLE 34. GERMANY PORTABLE PRINTER MARKET REVENUE, BY TECHNOLOGY, 2016-2023 ($MILLION)
TABLE 35. GERMANY PORTABLE PRINTER MARKET REVENUE, BY INDUSTRY VERTICAL, 2016-2023 ($MILLION)
TABLE 36. ITALY PORTABLE PRINTER MARKET REVENUE, 2016-2023 ($MILLION)
TABLE 37. ITALY PORTABLE PRINTER MARKET REVENUE, BY TECHNOLOGY, 2016-2023 ($MILLION)
TABLE 38. ITALY PORTABLE PRINTER MARKET REVENUE, BY INDUSTRY VERTICAL, 2016-2023 ($MILLION)
TABLE 39. REST OF EUROPE PORTABLE PRINTER MARKET REVENUE, 2016-2023 ($MILLION)
TABLE 40. REST OF EUROPE PORTABLE PRINTER MARKET REVENUE, BY TECHNOLOGY, 2016-2023 ($MILLION)
TABLE 41. REST OF EUROPE PORTABLE PRINTER MARKET REVENUE, BY INDUSTRY VERTICAL, 2016-2023 ($MILLION)
TABLE 42. ASIA-PACIFIC PORTABLE PRINTER MARKET REVENUE FOR TECHNOLOGY, 2016-2023 ($MILLION)
TABLE 43. ASIA-PACIFIC PORTABLE PRINTER MARKET REVENUE FOR INDUSTRY VERTICAL, 2016-2023 ($MILLION)
TABLE 44. ASIA-PACIFIC PORTABLE PRINTER MARKET REVENUE, BY COUNTRY 2016-2023 ($MILLION)
TABLE 45. CHINA PORTABLE PRINTER MARKET REVENUE, 2016-2023 ($MILLION)
TABLE 46. CHINA PORTABLE PRINTER MARKET REVENUE, BY TECHNOLOGY, 2016-2023 ($MILLION)
TABLE 47. CHINA PORTABLE PRINTER MARKET REVENUE, BY INDUSTRY VERTICAL, 2016-2023 ($MILLION)
TABLE 48. INDIA PORTABLE PRINTER MARKET REVENUE, 2016-2023 ($MILLION)
TABLE 49. INDIA PORTABLE PRINTER MARKET REVENUE, BY TECHNOLOGY, 2016-2023 ($MILLION)
TABLE 50. INDIA PORTABLE PRINTER MARKET REVENUE, BY INDUSTRY VERTICAL, 2016-2023 ($MILLION)
TABLE 51. JAPAN PORTABLE PRINTER MARKET REVENUE, 2016-2023 ($MILLION)
TABLE 52. JAPAN PORTABLE PRINTER MARKET REVENUE, BY TECHNOLOGY, 2016-2023 ($MILLION)
TABLE 53. JAPAN PORTABLE PRINTER MARKET REVENUE, BY INDUSTRY VERTICAL, 2016-2023 ($MILLION)
TABLE 54. AUSTRALIA PORTABLE PRINTER MARKET REVENUE, 2016-2023 ($MILLION)
TABLE 55. JAPAN PORTABLE PRINTER MARKET REVENUE, BY TECHNOLOGY, 2016-2023 ($MILLION)
TABLE 56. AUSTRALIA PORTABLE PRINTER MARKET REVENUE, BY INDUSTRY VERTICAL, 2016-2023 ($MILLION)
TABLE 57. REST OF ASIA-PACIFIC PORTABLE PRINTER MARKET REVENUE, 2016-2023 ($MILLION)
TABLE 58. REST OF ASIA-PACIFIC PORTABLE PRINTER MARKET REVENUE, BY TECHNOLOGY, 2016-2023 ($MILLION)
TABLE 59. REST OF ASIA-PACIFIC PORTABLE PRINTER MARKET REVENUE, BY INDUSTRY VERTICAL, 2016-2023 ($MILLION)
TABLE 60. LAMEA PORTABLE PRINTER MARKET REVENUE FOR TECHNOLOGY, 2016-2023 ($MILLION)
TABLE 61. LAMEA PORTABLE PRINTER MARKET REVENUE FOR INDUSTRY VERTICAL, 2016-2023 ($MILLION)
TABLE 62. LAMEA PORTABLE PRINTER MARKET REVENUE, BY COUNTRY 2016-2023 ($MILLION)
TABLE 63. LATIN AMERICA PORTABLE PRINTER MARKET REVENUE, 2016-2023 ($MILLION)
TABLE 64. LATIN AMERICA PORTABLE PRINTER MARKET REVENUE, BY TECHNOLOGY, 2016-2023 ($MILLION)
TABLE 65. LATIN AMERICA PORTABLE PRINTER MARKET REVENUE, BY INDUSTRY VERTICAL, 2016-2023 ($MILLION)
TABLE 66. MIDDLE EAST PORTABLE PRINTER MARKET REVENUE, 2016-2023 ($MILLION)
TABLE 67. MIDDLE EAST PORTABLE PRINTER MARKET REVENUE, BY TECHNOLOGY, 2016-2023 ($MILLION)
TABLE 68. MIDDLE EAST PORTABLE PRINTER MARKET REVENUE, BY INDUSTRY VERTICAL, 2016-2023 ($MILLION)
TABLE 69. AFRICA PORTABLE PRINTER MARKET REVENUE, 2016-2023 ($MILLION)
TABLE 70. AFRICA PORTABLE PRINTER MARKET REVENUE, BY TECHNOLOGY, 2016-2023 ($MILLION)
TABLE 71. AFRICA PORTABLE PRINTER MARKET REVENUE, BY INDUSTRY VERTICAL, 2016-2023 ($MILLION)
TABLE 72. BIXOLON CO.,LTD.: COMPANY SNAPSHOT
TABLE 73. BIXOLON CO.,LTD. : PRODUCT CATEGORIES.
TABLE 74. BIXOLON CO.,LTD.: PRODUCT PORTFOLIO
TABLE 75. BROTHER INDUSTRIES, LTD. : COMPANY SNAPSHOT
TABLE 76. BROTHER INDUSTRIES, LTD. : OPERATING SEGMENTS
TABLE 77. BROTHER INDUSTRIES, LTD. : PRODUCT PORTFOLIO
TABLE 78. CANON INC. : COMPANY SNAPSHOT
TABLE 79. CANON INC. : OPERATING SEGMENTS
TABLE 80. CANON INC. : PRODUCT PORTFOLIO
TABLE 81. PRINTEK LLC : COMPANY SNAPSHOT
TABLE 82. PRINTEK LLC: PRODUCT CATEGORIES.
TABLE 83. PRINTEK LLC : PRODUCT PORTFOLIO
TABLE 84. FUJITSU LIMITED : COMPANY SNAPSHOT
TABLE 85. FUJITSU LIMITED : OPERATING SEGMENTS
TABLE 86. FUJITSU LIMITED: PRODUCT PORTFOLIO
TABLE 87. HPE: COMPANY SNAPSHOT
TABLE 88. HPE: OPERATING SEGMENTS
TABLE 89. HPE: PRODUCT PORTFOLIO
TABLE 90. HONEYWELL: COMPANY SNAPSHOT
TABLE 91. HONEYWELL: OPERATING SEGMENTS
TABLE 92. HONEYWELL: PRODUCT PORTFOLIO
TABLE 93. POLAROID: COMPANY SNAPSHOT
TABLE 94. POLAROID: PRODUCT PORTFOLIO
TABLE 95. TOSHIBA: COMPANY SNAPSHOT
TABLE 96. TOSHIBA: OPERATING SEGMENTS
TABLE 97. TOSHIBA: PRODUCT PORTFOLIO
TABLE 98. ZEBRA: COMPANY SNAPSHOT
TABLE 99. ZEBRA: OPERATING SEGMENTS
TABLE 100. ZEBRA: PRODUCT PORTFOLIO

LIST OF FIGURES

FIGURE 01. GLOBAL PORTABLE PRINTER MARKET, 2016-2023
FIGURE 02. GLOBAL PORTABLE PRINTER MARKET, BY REGION, 2016-2023
FIGURE 03. TOP INVESTMENT POCKETS: PORTABLE PRINTER MARKET
FIGURE 04. TOP WINNING STRATEGIES, BY YEAR 2014-2017*
FIGURE 05. TOP WINNING STRATEGIES, BY DEVELOPMENT 2014-2017 (%)
FIGURE 06. TOP WINNING STRATEGIES, BY COMPANY 2014-2017 (%)
FIGURE 07. MODERATE BARGAINING POWER OF BUYERS
FIGURE 08. MODERATE BARGAINING POERT OF SUPPLIERS
FIGURE 09. HIGH-TO-MODERATE OF NEW ENTRANTS
FIGURE 10. MODERATE OF SUBSTITUTES
FIGURE 11. MODERATE COMPETITIVE RIVALARY
FIGURE 12. MARKET SHARE ANALYSIS: PORTABLE PRINTER MARKET , 2015
FIGURE 13. GLOBAL PORTABLE PRINTER MARKET, BY TECHNOLOGY, 2017-2023
FIGURE 14. COMPARATIVE ANALYSIS OF INKJET MARKET BY COUNTRY, 2016 & 2023 (%)
FIGURE 15. COMPARATIVE ANALYSIS OF THERMAL MARKET BY COUNTRY, 2016 & 2023 (%)
FIGURE 16. COMPARATIVE ANALYSIS OF IMPACT MARKET BY COUNTRY, 2016 & 2023 (%)
FIGURE 17. GLOBAL PORTABLE PRINTER MARKET, BY INDUSTRY VERTICAL, 2017-2023
FIGURE 18. COMPARATIVE ANALYSIS OF HEALTHCARE MARKET BY COUNTRY, 2016 & 2023 (%)
FIGURE 19. COMPARATIVE ANALYSIS OF RETAIL MARKET BY COUNTRY, 2016 & 2023 (%)
FIGURE 20. COMPARATIVE ANALYSIS OF TELECOMMARKET BY COUNTRY, 2016 & 2023 (%)
FIGURE 21. COMPARATIVE ANALYSIS OF TRANSPORTATION & LOGISTICS MARKET BY COUNTRY, 2016 & 2023 (%)
FIGURE 22. COMPARATIVE ANALYSIS OF OTHERS MARKET BY COUNTRY, 2016 & 2023 (%)
FIGURE 23. GLOBAL PORTABLE PRINTER MARKET, BY REGION, 2017-2023
FIGURE 24. BIXOLON CO.,LTD.: REVENUE, 2015-2016 ($MILLION)
FIGURE 25. BROTHER INDUSTRIES, LTD.: REVENUE, 2014-2016 ($MILLION)
FIGURE 26. BROTHER INDUSTRIES, LTD.: REVENUE SHARE BY SEGMENT, 2016 (%)
FIGURE 27. BROTHER INDUSTRIES, LTD.: REVENUE SHARE BY GEOGRAPHY, 2016 (%)
FIGURE 28. CANON INC.: REVENUE, 2014-2016 ($MILLION)
FIGURE 29. CANON INC.: REVENUE SHARE BY SEGMENT, 2016 (%)
FIGURE 30. CANON INC.: REVENUE SHARE BY GEOGRAPHY, 2016 (%)
FIGURE 31. FUJITSU LIMITED: REVENUE, 2015-2017($MILLION)
FIGURE 32. FUJITSU LIMITED: REVENUE SHARE BY SEGMENT, 2017 (%)
FIGURE 33. FUJITSU LIMITED: REVENUE SHARE BY GEOGRAPHY, 2017 (%)
FIGURE 34. HPE: NET SALES, 2015-2017 ($MILLION)
FIGURE 35. HPE: REVENUE SHARE BY SEGMENT, 2017 (%)
FIGURE 36. HPE: REVENUE SHARE BY GEOGRAPHY, 2017 (%)
FIGURE 37. HONEYWELL: NET SALES, 2014-2016 ($MILLION)
FIGURE 38. HONEYWELL: REVENUE SHARE BY SEGMENT, 2016 (%)
FIGURE 39. HONEYWELL: REVENUE SHARE BY GEOGRAPHY, 2016 (%)
FIGURE 40. TOSHIBA: NET SALES, 2015-2017 ($MILLION)
FIGURE 41. TOSHIBA: REVENUE SHARE BY SEGMENT, 2017 (%)
FIGURE 42. TOSHIBA: REVENUE SHARE BY GEOGRAPHY, 2017 (%)
FIGURE 43. ZEBRA: NET SALES, 2014-2016 ($MILLION)
FIGURE 44. ZEBRA: REVENUE SHARE BY SEGMENT, 2016 (%)
FIGURE 45. ZEBRA: REVENUE SHARE BY GEOGRAPHY, 2016 (%)


Portable printer allows the user to print the document as on demand via Bluetooth or USB cable through the connected device. The portable printer market is expected to reach $1,643.40 million by 2023, owing to rise in online business, growth in internet penetration, and increase in adoption of smart and connected devices. However, rise of investment on digitization across various developing nations might limit the adoption of portable printer.

Rise in mobile workforce management among industries and increase in adoption of BYOD policy across various industries, which drive the demand for portable printer. This enables the end users to perform the tasks and maintain documentation at office space or remote location as per the requirement or based on the need to capture the data.

In 2016, Asia-Pacific was the highest contributor, in terms of revenue, in the portable printer market. In addition, thermal technology based printer has contributed significant revenue to the market, majorly from the U.S.  Furthermore, the Telecom segment is anticipated to witness the highest growth rate during the forecast period, due to heavy investment in optical fiber installations and digitization across the developing nations.

Key market players have adopted various strategies, such as new product launch, business expansion, and strategic alliances, to increase awareness about portable printer across various countries.

PURCHASE OPTIONS

Call or Email us

U.S.-Canada Toll-free: +1-800-792-5285
Int'l : +1-503-894-6022
Europe : +44-845-528-1300
Email : help@alliedmarketresearch.com

Looking for Customization?

 Customization Request

Have a Question?

 Speak with Analyst

Any Confusion?

 Inquire Before Buying

Have a glance of the Report

  Request Sample

Purchase Full Report of
Portable Printer Market

Start reading instantly.
This Report and over 67,112+ more Reports, Available with Avenue Library. T&C*.

  • Online Only
  • $3,456
  • Online cloud access only
  • Restricted print, copy, paste & download
  • Read only
  • Free industry update
    (Within 180 days)
  • Free report update in next update cycle
    (Jan 2019 - Jan 2020)
  • Data Pack
  • $3,840
  • Restricted to one authorized user
  • One print only
  • Available in
    Excel
  • Free industry update
    (Within 180 days)
  •   Free report update in next update cycle
    (Jan 2019 - Jan 2020)
  • Single User
  • $5,769
  • Restricted to one authorized user
  • One print only
  • Available in
    PDF
  • Free industry update
    (Within 180 days)
  •   Free report update in next update cycle
    (Jan 2019 - Jan 2020)
  • Five Users
  • $6,450
  • Limited to five authorized users
  • Print upto five copies
  • Available in
    PDF
  • Free industry update
    (Within 180 days)
  •   Free report update in next update cycle
    (Jan 2019 - Jan 2020)
  • Enterprise
    License/PDF

  • $10,995
  • Unlimited
    within
    company/enterprise
  • Available in Excel & PDF
  • Free industry update
    (Within 180 days)
  •   Free report update in next update cycle
    (Jan 2019 - Jan 2020)
  • Library
    Membership

  • $999 $ 1,175
    Per User/ Per month/ Billed annually
  • Published Content
    E-access
  • Company Profiles
    E-access
  • Newly Added Content Access
  • 10 PDF
    Downloads
  • 5 Excel Data
    Pack Downloads
  • 250 Company Profiles PDF Downloads
  • Buy Now

*Taxes/Fees, if applicable will be added during checkout. All prices in USD

RELATED REPORTS
 

Why Allied Market Research?


Infallible Methodology

To ensure high-level data integrity, accurate analysis, and impeccable forecasts

Analyst Support

For complete satisfaction

Customization

On-demand customization of scope of the report to exactly meet your needs

TARGETED MARKET VIEW

Targeted market view to provide pertinent information and save time of readers

Get fresh content delivered

Get insights on topics that are crucial for your business. Stay abreast of your interest areas.

Get Industry Data Alerts

Why Allied Market Research?

Infallible Methodology

To ensure high-level data integrity, accurate analysis, and impeccable forecasts

Analyst Support

For complete satisfaction

Customization

On-demand customization of scope of the report to exactly meet your needs

TARGETED MARKET VIEW

Targeted market view to provide pertinent information and save time of readers