
Portable Speaker Market Research, 2033
Market Introduction and Definition
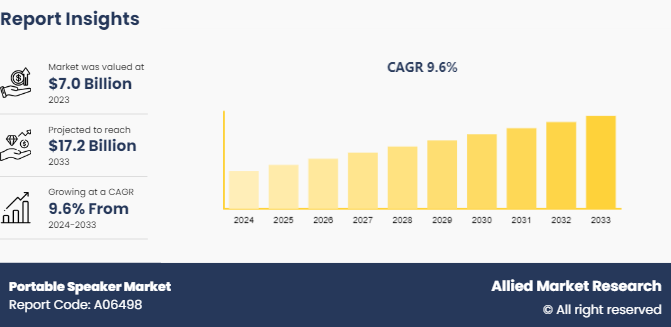
The global portable speaker market was valued at $7.0 billion in 2023, and is projected to reach $17.2 billion by 2033, growing at a CAGR of 9.6% from 2024 to 2033. Portable speakers are compact, wireless audio devices designed for on-the-go use, providing users with the ability to play music, podcasts, and other audio content through Bluetooth or Wi-Fi connections. Unlike traditional speakers, portable speakers are battery-powered, offering flexibility and mobility across different environments. With advancements in sound quality, battery life, and connectivity options, these devices have gained popularity among consumers for personal, outdoor, and travel use. The portability, ease of use, and compatibility with smartphones and smart home ecosystems make them an essential accessory for modern audio consumption.
Key Takeaways
The portable speakers market study covers 20 countries. The research includes a segment analysis of each country in terms of value for the projected period.
More than 1, 500 product literatures, industry releases, annual reports, and other such documents of major portable speaker industry participants along with authentic industry journals, trade associations' releases, and government websites have been reviewed for generating high-value industry insights.
The study integrated high-quality data, professional opinions & analysis, and critical independent perspectives. The research approach is intended to provide a balanced view of global markets and to assist stakeholders in making educated decisions to achieve their most ambitious growth objectives.
Key Market Dynamics
The integration of smart assistants like Amazon Alexa, Google Assistant, and Apple's Siri has significantly increased the demand for portable speaker market. These devices now serve dual functions, offering not only high-quality audio playback but also hands-free control of smart home systems, calendars, and online queries. This added functionality makes portable speakers more versatile, attracting consumers seeking convenience and multi-tasking capabilities. The popularity of smart homes is further boosting demand, as portable speakers with voice assistants become a central hub for home automation. By offering seamless voice interaction, smart assistants have transformed portable speakers from simple audio devices into smart, interactive products, catering to tech-savvy users and driving portable speaker market growth.
However, advancements in wireless technology, concerns over battery life continue to restrain the portable speaker market demand. Consumers expect portable speakers to deliver long-lasting performance, but smaller devices often struggle to balance compactness with sufficient battery capacity. Frequent recharging needs and shorter playback times can detract from user satisfaction, especially for outdoor or travel use. Moreover, extended usage of smart features like voice assistants drains battery life more rapidly. In markets where users prioritize uninterrupted audio experiences, particularly for outdoor or remote activities, limited battery performance can deter portable speaker market size, making battery life a critical restraint in the growth of the portable speaker market.
Moreover, technological innovations in the portable speaker market are driving new opportunities for growth. Enhanced wireless technologies such as Bluetooth 5.0 and Wi-Fi 6 offer faster connectivity and better range, while advances in sound engineering bring richer, high-fidelity audio to compact designs. New battery technologies, such as graphene-based cells, are pushing the limits of battery life, making portable speakers more appealing for extended use. Furthermore, immersive audio technologies like 3D sound and spatial audio elevate the listening experience, catering to audiophiles seeking high-quality sound. Smart integration, multi-room functionality, and eco-friendly materials are additional innovations creating new possibilities for portable speaker market share, allowing brands to meet evolving consumer preferences.
Bluetooth Audio Device Shipment Statistics (2015-2023)

Value Chain of the Portable Speakers Market
- Raw Materials and Component Suppliers: The production of portable speakers starts with sourcing raw materials and components. This includes the plastics, metals, and composite materials used in the speaker casing, as well as lithium-ion batteries for power, audio drivers, and other key components like Bluetooth chips, amplifiers, and circuit boards. The supply of rare-earth metals for magnets and other critical electronic components is also crucial at this stage for portable speaker market.
- Manufacturing and Assembly: Once raw materials are procured, manufacturing involves the production of various internal components, such as audio drivers, speakers, and battery units. After production, assembly lines integrate all these components into a final portable speaker unit. Many companies outsource production to third-party manufacturers, often located in Asia, particularly China, where the electronics manufacturing infrastructure is well-established.
- Branding and Design: At this stage, companies focus on differentiating their portable speakers through design, branding, and innovative features. This includes integrating smart technologies (like voice assistants) , waterproofing, and enhancing sound quality. Companies also work on packaging and user-friendly designs, which cater to both aesthetic and functional consumer needs.
- Distribution and Retail: Once the portable speakers are produced, they move to the distribution phase. This involves shipping the products to regional distribution centers, retailers, and online platforms. Traditional brick-and-mortar stores, e-commerce platforms, and specialty electronics retailers are key channels where portable speakers are sold to end consumers.
- Marketing and Sales: In this stage, companies engage in marketing campaigns to raise awareness and drive demand in portable speaker market. Marketing activities include online advertising, partnerships with influencers, in-store promotions, and product reviews. Some companies also work with third-party distributors for broader market penetration.
- After-Sales Services: After-sales services, such as warranty claims, customer support, and repair services, play a crucial role in maintaining brand loyalty. Many companies also provide software updates for smart speakers to improve functionality over time.
- End Consumer: The final stage in the value chain is the end consumer, who purchases and uses the portable speaker. User feedback and consumer preferences help drive future product developments and innovations.
Market Segmentation
The portable speakers market is segmented into type, application, industrial vertical, and region. On the basis of type, the market is bifurcated into wired and wireless. As per the application, the market is divided into residential, commercial, and others. On the basis of industrial vertical, the market is classified into electronics and others. Region wise, the market is analyzed across North America, Europe, Asia-Pacific, and LAMEA.
Regional/Country Market Outlook
North America holds the largest share of the portable speaker market, driven by the high adoption of smart home devices and widespread smartphone usage. The region also benefits from higher disposable incomes and a preference for premium audio equipment. According to Statista, around 55% of U.S. households owned a smart speaker by 2023, highlighting the growing integration of portable audio devices into daily life. In addition, the presence of major tech players, such as Apple, Amazon, and Google, fosters innovation and provides consumers with a wide array of options.
Industry Trends
Smart Features Integration: Portable speakers are increasingly equipped with voice assistants like Amazon's Alexa, Google Assistant, and Apple's Siri. These smart features allow users to control the speakers using voice commands, streamlining tasks such as playing music, checking the weather, or controlling smart home devices in portable speaker market.
Improved Battery Life and Fast Charging: Innovations in battery technology have significantly extended the usage time of portable speakers. Many models now offer longer battery life, sometimes exceeding 20 hours of playtime, and quick charging capabilities.
Durability and Outdoor Appeal: Consumers are seeking rugged, waterproof, and dustproof speakers that can withstand outdoor environments. IPX-rated waterproof speakers, often marketed for outdoor activities such as hiking, camping, and beach use, are particularly popular.
Multi-Room Audio Systems: The ability to connect multiple portable speakers to create a surround-sound effect or multi-room audio setup is gaining traction in portable speaker market. This trend allows users to sync speakers across different rooms or spaces for an enhanced audio experience.
Competitive Landscape
The major players operating in the portable speakers market include Avnera, JVC KENWOOD, Bose, Jawbone, Denon, Sony, JBL, Samsung Electronics, Logitech International, and Creative Technology.
Recent Key Strategies and Developments
In January 2024 - JBL launches its first AuracastTM enabled portable speakers in LAS VEGAS.
In February 2024 - Sony launched new SRS-XV500 portable party speaker with a powerful party sound and 25 hours battery backup especially Tuned for India.
In June 2024 - Samsung Music Frame 120W wireless speaker was launched in India.
Key Benefits For Stakeholders
This report provides a quantitative analysis of the market segments, current trends, estimations, and dynamics of the portable speaker market analysis from 2024 to 2033 to identify the prevailing portable speaker market opportunities.
The market research is offered along with information related to key drivers, restraints, and opportunities.
Porter's five forces analysis highlights the potency of buyers and suppliers to enable stakeholders make profit-oriented business decisions and strengthen their supplier-buyer network.
In-depth analysis of the portable speaker market segmentation assists to determine the prevailing market opportunities.
Major countries in each region are mapped according to their revenue contribution to the global market.
Market player positioning facilitates benchmarking and provides a clear understanding of the present position of the market players.
The report includes the analysis of the regional as well as global portable speaker market trends, key players, market segments, application areas, and market growth strategies.
Portable Speaker Market Report Highlights
| Aspects | Details |
| Market Size By 2033 | USD 17.2 Billion |
| Growth Rate | CAGR of 9.6% |
| Forecast period | 2024 - 2033 |
| Report Pages | 200 |
| By Type |
|
| By Application |
|
| By Industrial Vertical |
|
| By Region |
|
| Key Market Players | Denon, JBL, JVC Kenwood Corporation, Jawbone, Inc., Bose Corporation, Logitech International S.A., Sony Corporation, Avnera Corporation, Samsung Electronics, Creative Technology Limited |
The integration of smart technology, such as voice assistants and enhanced connectivity features, is becoming more prevalent, catering to the growing preference for multifunctional devices. The market is also witnessing a surge in portable speakers designed for outdoor use, featuring durability and waterproof capabilities, as more consumers engage in outdoor activities and social gatherings.
The leading application of the Portable Speaker Market is in residential use, where these devices are primarily utilized for enhancing audio experiences with smartphones, tablets, and laptops.
North America is the largest regional market for portable speaker.
The global portable speaker market was valued at $7.0 billion in 2023, and is projected to reach $17.2 billion by 2033, growing at a CAGR of 9.6% from 2024 to 2033.
The Sony, JBL, Samsung Electronics, Logitech International are the top companies to hold the market share in portable speaker.
Loading Table Of Content...

