
Pour Point Depressants Market Research, 2033
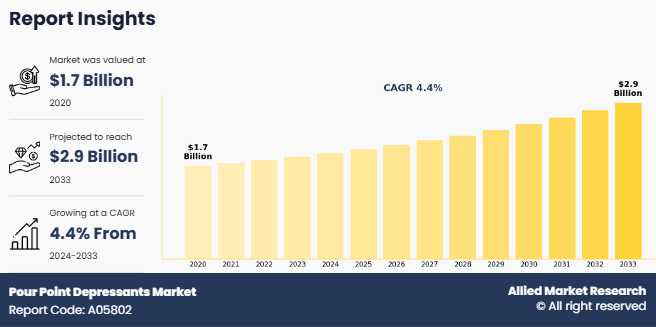
The global pour point depressants market size was valued at $1.7 billion in 2020, and is projected to reach $2.9 billion by 2033, growing at a CAGR of 4.4% from 2024 to 2033.The growth in the automotive industry, driven by increasing vehicle production and demand for fuel-efficient vehicles, alongside the expansion of the oil and gas industry, has significantly boosted the demand for pour point depressants. Pour point depressants are essential in reducing the pour point of fuels, ensuring smooth operation of engines, particularly in colder temperatures, and improving the flow properties of crude oils and refined products.
Introduction
Pour point depressants (PPDs) are specialized chemical additives used in the oil and gas industry to improve the flowability of crude oil, refined fuels, and lubricants at low temperatures. Their primary function is to lower the pour point, which is the lowest temperature at which an oil remains fluid enough to flow. As oil cools, wax crystals form and cause the oil to thicken which results in blockages in pipelines and equipment. Pour point depressants work by modifying the structure of these wax crystals, preventing them from agglomerating and solidifying, thus allowing the oil to remain fluid and easier to pump, transport, and store even in cold conditions.
Key Takeaways
- The global pour point depressants market has been analyzed in terms of value ($billion). The analysis in the report is provided on the basis of system type, source, capacity, end use, 4 major regions, and more than 15 countries.
- The global pour point depressants market report includes a detailed study covering underlying factors influencing the industry opportunities and trends.
- The key players in the pour point depressants market include Afton Chemical, Clariant, The Lubrizol Corporation, DEW PROJECTS AND CHEMICALS PVT. LTD., Goodway Chemicals Private Limited, Thermax Limited, Evonik Industries, The Zoranoc Oilfield Chemical, BASF SE, and SANYO CHEMICAL INDUSTRIES, LTD.
- The report facilitates strategy planning and industry dynamics to enhance decision making for existing market players and new entrants entering the alternators industry.
- Countries such as China, the U.S., Canada, Germany, and Brazil hold a significant share in the global pour point depressants market.
Market Dynamics
The expansion of the oil and gas industry, especially in challenging environments such as offshore deepwater fields, the Arctic, and remote areas with extreme weather, drives the growing demand for pour point depressants (PPDs). These regions experience low temperatures that cause waxes and solids in crude oil to crystallize, increasing viscosity and hindering oil transportation and storage. PPDs ensure fluidity at lower temperatures, preventing blockages in pipelines, pumps, and storage. The need for PPDs is further amplified by the exploration of unconventional oil reserves, such as shale oil, heavy oil, and oil sands, which contain higher wax concentrations. In addition, expanding pipeline infrastructure for long-distance oil transport requires PPDs to maintain flow and prevent system failures due to gelled or solidified oil, reducing maintenance costs and supporting smooth operations. All these factors are expected to drive the growth of the global pour point depressants market during the forecast period.
However, compatibility issues with different base oils hamper the growth of pour point depressants (PPDs) in the oil and gas industry. Base oils, which vary in chemical composition and properties depending on their source and refining process affect how well PPDs perform. These differences lead to ineffective performance or challenges in formulation, as PPDs do not work consistently across various types of oils. Manufacturers must conduct extensive testing to determine the right concentrations and blends of PPDs for each specific base oil, which increases costs and development time. In addition, oils used in extreme conditions such as cold climates require higher or specialized amounts of PPDs, further complicating the formulation process and limiting the widespread adoption of these additives. All these factors hamper the global pour point depressants market growth.
Moreover, the increase in focus on eco-friendly and sustainable formulation trends presents significant opportunities for the pour point depressants (PPDs) market. As environmental regulations become stricter and industries aim to reduce their carbon footprint, there is an increasing demand for PPDs that are derived from renewable, biodegradable, and non-toxic materials. These sustainable alternatives help to meet regulatory requirements and appeal to environmentally conscious consumers and businesses. In addition, the oil and gas industry’s shift towards greener practices creates a market for PPDs that improve the performance of lubricants and fuels while minimizing environmental impact. All these factors are anticipated to offer new growth opportunities for the global pour point depressants market.
Segments Overview
The pour point depressants market is segmented into type, method, end-use industry, and region. On the basis of type, the market is segmented into ethylene vinyl-acetate (EVA), styrene esters, poly acrylate, phthalic acid esters, poly alpha olefin, and others. As per method, the market is divided into surface adsorption and co-crystallization. On the basis of end-use industry, the market is classified into industrial, automotive, marine, aviation, oil and gas, and others. Region-wise, the market is analyzed across North America, Europe, Asia-Pacific, and LAMEA.

On the basis of type, the market is segmented into ethylene vinyl-acetate (EVA), styrene esters, poly acrylate, phthalic acid esters, poly alpha olefin, and others. The ethylene vinyl-acetate (EVA) segment accounted for one-third of the pour point depressants market share in 2020 and is expected to maintain its dominance during the forecast period. EVA helps to improve the fluidity of crude oil and refined products in colder environments by preventing the formation of wax crystals, which cause blockages and reduce efficiency. In addition, EVA’s compatibility with various base oils and its ease of blending with other additives make it a cost-effective solution for enhancing cold flow properties.

On the basis of method, the market is divided into surface adsorption and co-crystallization. The co-crystallization segment accounted for more than half of the pour point depressants market share in 2020 and is expected to maintain its dominance during the forecast period. Co-crystallization allows for the formation of stable, low-melting compounds that inhibit wax crystallization, which is a major cause of high pour points in oils. In addition, this method is seen as more environmentally friendly compared to traditional chemical additives, as it reduces the need for solvents or harsh chemicals. The growing demand for sustainable and efficient methods in the oil and gas industry supports the adoption of co-crystallization.

On the basis of end-use industry, the market is classified into industrial, automotive, marine, aviation, oil and gas, and others. The automotive segment accounted for less than two-fifths of the pour point depressants market share in 2020 and is expected to maintain its dominance during the forecast period. Pour point depressants (PPDs) in the automotive sector play a crucial role in enhancing the performance and reliability of engine oils, particularly in cold weather conditions. As engine oils are prone to thickening in cold weather, PPDs help to lower the pour point, allowing for smoother engine start-ups and reducing the risk of engine wear. This is especially important as automakers strive to improve fuel efficiency, reduce emissions, and meet stringent environmental regulations.

Region-wise, the market is analyzed across North America, Europe, Asia-Pacific, and LAMEA. The Asia-Pacific region accounted for more than one-third of the pour point depressants market share in 2020 and is expected to maintain its dominance during the forecast period. In the automotive sector, stricter regulations on emissions and fuel efficiency standards are prompting the use of advanced additives such as PPDs in lubricants and fuels. These additives help in reducing the energy needed to pump oils and fuels at lower temperatures, improving overall vehicle performance. In addition, rising urbanization and industrialization drives the demand for high-quality fuels and lubricants, particularly in the transportation and industrial sectors that drives the need for pour point depressants.
Key players in the pour point depressants market include Afton Chemical, Clariant, The Lubrizol Corporation, DEW PROJECTS AND CHEMICALS PVT. LTD., Goodway Chemicals Private Limited, Thermax Limited, Evonik Industries, The Zoranoc Oilfield Chemical, BASF SE, and SANYO CHEMICAL INDUSTRIES, LTD.
Competitive Analysis
Key players in the pour point depressants industry include Afton Chemical, Clariant, The Lubrizol Corporation, DEW PROJECTS AND CHEMICALS PVT. LTD., Goodway Chemicals Private Limited, Thermax Limited, Evonik Industries, The Zoranoc Oilfield Chemical, BASF SE, and SANYO CHEMICAL INDUSTRIES, LTD
Key Benefits For Stakeholders
- This report provides a quantitative analysis of the market segments, current trends, estimations, and dynamics of the pour point depressants market analysis from 2020 to 2033 to identify the prevailing pour point depressants market opportunities.
- The market research is offered along with information related to key drivers, restraints, and opportunities.
- Porter's five forces analysis highlights the potency of buyers and suppliers to enable stakeholders make profit-oriented business decisions and strengthen their supplier-buyer network.
- In-depth analysis of the pour point depressants market forecast, segmentation assists to determine the prevailing market opportunities.
- Major countries in each region are mapped according to their revenue contribution to the global market.
- Market player positioning facilitates benchmarking and provides a clear understanding of the present position of the market players.
- The report includes the analysis of the regional as well as global pour point depressants market trends, key players, market segments, application areas, and market growth strategies.
Pour Point Depressants Market Report Highlights
| Aspects | Details |
| Market Size By 2033 | USD 2.9 billion |
| Growth Rate | CAGR of 4.4% |
| Forecast period | 2020 - 2033 |
| Report Pages | 435 |
| By Type |
|
| By Method |
|
| By End-Use Industry |
|
| By Region |
|
| Key Market Players | Thermax Limited, The Zoranoc Oilfield Chemical, The Lubrizol Corporation, SANYO CHEMICAL INDUSTRIES, LTD, BASF SE, CLARIANT, Afton Chemical, GOODWAY CHEMICALS PVT. LTD, Evonik Industries AG, DEW PROJECTS AND CHEMICALS PVT. LTD. |
Analyst Review
According to the opinions of various CXOs of leading companies, the pour point depressants market is expected to witness an increase in demand during the forecast period. Growth in the automotive industry and expansion of the oil and gas industry are expected to increase the demand for pour point depressants during the forecast period. The growth of the automotive industry significantly drives the demand for pour point depressants (PPDs), as modern vehicles require engine oils that perform optimally under a wide range of temperatures. In colder climates, engine oils become too thick to circulate effectively, leading to engine wear, difficulty starting, and potential damage. PPDs are essential in lowering the pour point of motor oils, ensuring that they remain fluid even in low temperatures, thus supporting smoother engine operation and longevity. As the demand for vehicles, especially in colder regions, continues to rise, automakers are increasingly incorporating PPDs to improve the performance and reliability of engine oils, contributing to their growing adoption.
Moreover, the expansion of the oil and gas industry, particularly in challenging environments such as offshore fields, the Arctic, and remote regions with extreme weather, is driving the demand for pour point depressants. These regions face low temperatures that cause wax crystals to form in crude oil, increasing its viscosity and making transportation and storage more difficult. PPDs are vital in preventing wax formation, maintaining the flowability of the oil, and ensuring smooth operation in pipelines and storage facilities. The continued exploration of unconventional and frontier oil reserves, such as shale oil and oil sands, which are more susceptible to viscosity-related issues, further intensifies the need for PPDs to facilitate the transportation and processing of crude oil under cold conditions. This growing demand for PPDs in both the automotive and oil & gas sectors highlights their critical role in ensuring efficient operations across diverse industries.
Growth in the automotive industry and expansion of the oil and gas industry are the upcoming trends of Pour Point Depressants Market in the world.
Automotive is the leading application of Pour Point Depressants Market
Asia-Pacific is the largest regional market for Pour Point Depressants
$2.9 Billion is the estimated industry size of Pour Point Depressants by 2033.
Afton Chemical, Clariant, The Lubrizol Corporation, DEW PROJECTS AND CHEMICALS PVT. LTD., Goodway Chemicals Private Limited, Thermax Limited, Evonik Industries, The Zoranoc Oilfield Chemical, BASF SE, and SANYO CHEMICAL INDUSTRIES, LTD are the top companies to hold the market share in Pour Point Depressants
Loading Table Of Content...
Loading Research Methodology...

