
Povidone Iodine Market Overview: 2031
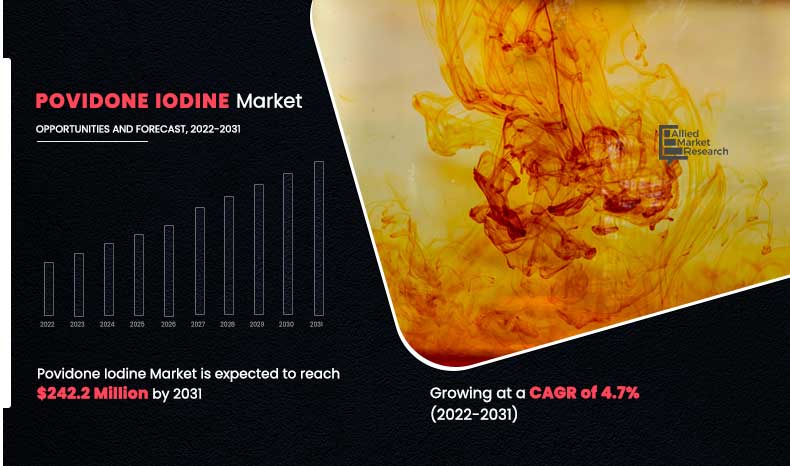
The global povidone iodine market size was valued at $152.6 million in 2021, and is projected to reach $242.2 million by 2031, growing at a CAGR of 4.7% from 2022 to 2031. Increase in awareness about hygiene and infection prevention, particularly in the healthcare sector, has driven demand for povidone iodine in wound care, surgical procedures, and personal hygiene products. Povidone iodine is widely used in wound treatment due to its broad-spectrum antimicrobial properties. Its ability to reduce the risk of infections in cuts, abrasions, burns, and other open wounds makes it an essential component of wound care products in hospitals, clinics, and even at home.
How to Describe Povidone Iodine
Povidone, commonly known as polyvinylpyrrolidone (PVP), is primarily used as an antiseptic and disinfectant agent. Povidone's chemical properties such as biological inertness and the ability to bind and form complexes with other materials make it a popular compound in many sectors. Many artificial tear and eye lubricant products contain povidone as a component. Some contact lens manufacturers include povidone as a wetting agent in their lenses to improve moisture retention. Povidone is further utilized as a binder in the manufacture of pharmaceutical tablets and liquid oral medications. Moreover, it is frequently found in cosmetic products such as shampoos, lipstick, hair spray, and gels.
Povidone iodine can minimize the irritating or poisonous properties of other medications. it is frequently mixed with iodine as an antiseptic. This combination product is sold as Betadine®, a skin antiseptic, but it is also available in lower concentrations for treatment of the eyes and vaginal area. In addition, povidone iodine is commonly used as an antiseptic in surgical operations in hospitals. For healthcare professionals, nose and oral cleansing with povidone iodine has recently been recommended as a COVID-19 infection prevention intervention. As the effectiveness of this medication is unknown, using povidone iodine to prevent COVID-19 is still considered experimental.
The antibacterial properties of povidone iodine enable it to kill bacteria, viruses, and fungus. As a disinfectant, povidone iodine is becoming increasingly popular in the healthcare sector. Antiseptic product demand is rising as invasive procedures become more common and the healthcare business expands rapidly in both developed and developing nations. In addition, rise in prevalence of numerous diseases in hospitals and clinics has boosted the demand for instrument sterilizers, boosting the demand for povidone iodine.
Key Takeaways
The povidone iodine market study covers 20 countries. The research includes a segment analysis of each country in terms of value for the projected period.
The study integrated high-quality data, professional opinions and analysis, and critical independent perspectives. The research approach is intended to provide a balanced view of the global povidone iodine market and to assist stakeholders in making educated decisions in order to achieve their most ambitious growth objectives.
Over 3,700 product literatures, annual reports, industry statements, and other comparable materials from major industry participants were reviewed to gain a better understanding of the povidone iodine market.
The povidone iodine market is highly fragmented, with several players including 3M Company, Avrio Health L.P., BASF SE, Glide Chem Private Limited, Lasa Supergenerics Ltd., Luxica Pharma Inc, NIPPON SHOKUBAI CO., LTD., Samrat Pharmachem Limited, Thatcher Company, and Vishal Laboratories. Key strategies such as acquisitions, product launches, mergers, expansion etc. of the players operating in the povidone iodine market are also included in the report.
How are Market Dynamics Shaping Industry Competition
Rise in chronic diseases, such as diabetes, cancer, and cardiovascular conditions and associated surgeries is expected to drive the growth of the povidone iodine market during the forecast period. Chronic conditions often require regular medical interventions, including surgeries, to manage complications or improve patient outcomes. For instance, diabetes can lead to non-healing wounds or ulcers that often necessitate surgical treatment. In such cases, povidone iodine is widely used in wound care to prevent infections, which is critical for diabetic patients who are more prone to infections due to their compromised immune systems.
Similarly, cancer treatments frequently involve surgical procedures to remove tumors or manage complications associated with the disease. Patients undergoing cancer surgery are at high risk of postoperative infections due to weakened immune systems from chemotherapy or radiation. Here, povidone iodine serves as a reliable antiseptic agent in both preoperative and postoperative care, helping reduce the risk of infections and promoting better recovery outcomes. Cardiovascular surgeries, such as bypasses or valve replacements, also rely heavily on antiseptics like povidone iodine to maintain sterile environments and minimize the chances of infections during and after surgery. According to Dr. O'Brien, the continued use of 2.5% povidone-iodine could be considered a best practice, not only for combatting SARS-CoV-2 but also for preventing the spread of other transmissible viruses such as adenovirus, enterovirus, influenza, and certain bacteria.
However, the availability of alternative antiseptics is expected to restrain the growth of the povidone iodine market during the forecast period. The availability of alternative antiseptics presents a significant restraint on the growth of the povidone iodine industry. Products such as chlorhexidine, hydrogen peroxide, and alcohol-based solutions are widely used across various healthcare settings and often compete directly with povidone iodine. These alternatives offer similar antimicrobial properties, making them viable substitutes in preventing and treating infections. In many cases, chlorhexidine and alcohol-based products are preferred due to their rapid action, ease of use, and lower incidence of skin irritation compared to povidone iodine. This has led to their increased adoption, especially in clinical and surgical environments. In addition, some of these alternatives are associated with fewer side effects, which further enhances their appeal. For instance, povidone iodine is known to cause skin discoloration and, in some individuals, allergic reactions or sensitivity issues, limiting its use in specific patient groups. In contrast, alcohol-based antiseptics evaporate quickly, leaving no residue, and are less likely to cause skin staining. Chlorhexidine, on the other hand, offers prolonged antimicrobial activity, making it especially useful for longer-term infection prevention in surgical procedures, reducing the need for reapplication.
Povidone Iodine Market Segment Review:
The povidone iodine market is segmented on the basis of formulation type, application, and region. Depending on formulation type, the market is categorized into scrub, topical solution, ointments, and others (powder and gel). By application, it is segregated into skin sterilization, instrument sterilization, disinfectant, and others. Region wise, it is studied across North America, Europe, Asia-Pacific, and LAMEA.
Povidone iodine Market, by Formulation Type
By Formulation Type
Topical Solution segment holds major market share and is projected as the most lucrative segment.
By type, the topical solution segment dominated the povidone iodine market share in 2021 and is expected to grow with the CAGR of 4.9% during the forecast period. Povidone-iodine, commonly known as a topical antiseptic, is widely used to prevent and treat skin infections in wounds, cuts, and burns. As a combination of iodine and a water-soluble polymer, polyvinylpyrrolidone (PVP), povidone-iodine has potent antimicrobial properties, effective against a broad spectrum of bacteria, viruses, fungi, and protozoa. Its use as a topical solution makes it ideal for disinfecting skin before surgeries and other medical procedures, reducing the risk of post-operative infections.
Povidone iodine Market, by Application
By Application
Disinfectant has garner major share in the Povidone Iodine market in 2021 and Instrument Sterilization is projected as the most lucrative segment.
By application, the disinfectant segment dominated the povidone iodine market, with a CAGR of 5.1% during the forecast period. Povidone-iodine is a widely used antiseptic and disinfectant due to its broad-spectrum antimicrobial properties. It is an iodine-based solution that works by releasing free iodine when applied to the skin or mucous membranes, which disrupts the vital components of microorganisms such as bacteria, viruses, fungi, and protozoa. Its ability to act against a wide variety of pathogens makes it a valuable tool in both healthcare and household settings for preventing infections and maintaining cleanliness.
Povidone iodine Market, by Region
By Region
Europe holds a dominant position in 2021 and Asia-Pacifc region is projects as the most lucrative region growing at around CAGR of 5.3%.
Region-wise, Europe accounted for the largest share of the market in 2021, and Asia-Pacific is expected to grow with a CAGR of 5.3% during the forecast period. Povidone-iodine, a broad-spectrum antiseptic, is widely used across Europe for various applications due to its effective antimicrobial properties. It is primarily utilized in healthcare settings for preoperative skin disinfection, wound care, and as a surgical scrub for healthcare professionals. In the UK, povidone-iodine is a commonly used antiseptic in hospitals and clinics. It is primarily applied for preoperative skin preparation and wound care. The National Health Service (NHS) endorses its use due to its effectiveness in reducing the risk of surgical infections. In addition, povidone-iodine is available in retail pharmacies for treating minor injuries and infections, highlighting its accessibility for consumers.
Which are the Leading Companies in Povidone Iodine
Major players operating in the global povidone iodine market include 3M Company, Avrio Health L.P., BASF SE, Glide Chem Private Limited, Lasa Supergenerics Ltd., Luxica Pharma Inc, NIPPON SHOKUBAI CO., LTD., Samrat Pharmachem Limited, Thatcher Company, and Vishal Laboratories. Other players operating in the povidone iodine industry are Evonik Industries AG, LG Chem Ltd., Sumitomo Seika Chemicals Co. Ltd., Sanyo Chemical Industries, and KAO Corporation.
Historic Trends of Povidone Iodine Market
In 1952, povidone-iodine was first marketed under the brand name Betadine by the company Medi-chem, which was later acquired by Purdue Pharma. The formulation combines iodine with povidone (polyvinylpyrrolidone) to create a less irritating antiseptic.
In 1960, povidone-iodine gained significant attention as a surgical antiseptic. Its use in hospitals began to expand rapidly, becoming a standard practice in preoperative and postoperative care.
In 1990, povidone-iodine was studied extensively for its efficacy in preventing surgical site infections, particularly in orthopedic and cardiovascular surgeries.
In 2000, povidone-iodine was included in various guidelines by health organizations for infection control, particularly in surgical settings and wound management.
In 2008, the World Health Organization (WHO) recognized povidone-iodine as a critical antiseptic for hand hygiene and preoperative skin preparation.
What are the Key Benefits For Stakeholders
- The report provides in-depth analysis of the global povidone iodine market along with the current trends and future estimations.
- The report highlights the key drivers, opportunities, and restraints of the market along with the impact of the povidone iodine market analysis during the forecast period.
- The Porter’s five forces analysis helps to analyze the potential of the buyers & suppliers and the competitive scenario of the global povidone iodine market forecast for strategy building.
- A comprehensive market analysis covers the factors that drive and restrain the global povidone iodine market growth.
- The qualitative data about market dynamics, trends, and developments is provided in the report.
Povidone Iodine Market Report Highlights
| Aspects | Details |
| By Formulation Type |
|
| By Application |
|
| By Region |
|
| Key Market Players | Glide Chem Private Limited, Vishal Laboratories, BASF SE, NIPPON SHOKUBAI CO., LTD., Luxica Pharma Inc, 3M Company, Lasa Supergenerics Ltd., Avrio Health L.P., Thatcher Company, Samrat Pharmachem Limited |
Analyst Review
According to the insights of the CXOs of top-level companies, povidone iodine witnessed significant growth in recent years. This is attributed to increased demand for antiseptic and disinfectant products. In addition, the rising demand for skin antiseptic products is also propelling the market growth. The demand for skin antiseptic products has increased due to rise in awareness toward hospital-acquired diseases. This is consequently surging the demand for chemicals such as povidone iodine, as it is effective in killing germs and harmful bacteria, which are the most common cause of disease transmission in hospitals.
Moreover, it is used to sterilize the skin before blood test as well as in spinal and epidural anesthesia. As a result, the overall market outlook is likely to be driven by increase in the number of surgical procedures. Furthermore, for skin sterilization, povidone iodine is an effective and low-cost alternative to alcohol, which drives the demand from hospitals and clinics. In addition, povidone iodine serves as a potential endometritis prophylaxis medication, and has a high probability of becoming one of the most successful treatments overall. On the other hand, market players of povidone iodine are increasing their utilization of povidone iodine to prevent secondary outcomes such as surgical wound infections and fever linked with endometritis. Povidone iodine is being used to create incremental opportunities in applications, including presurgical vaginal irrigation to prevent postoperative wound infections and fever in women.
Increased demand from pharmaceutical industry is driving the demand for povidone iodine market.
The global povidone iodine market was valued at $152.6 million in 2021, and is projected to reach $242.2 million by 2031, growing at a CAGR of 4.7% from 2022 to 2031
3M Company, Avrio Health L.P., BASF SE are some of the most established players of the povidone iodine market.
Pharmaceutical industry is projected to increase the demand for povidone iodine.
By Formulation Type Scrub • Topical Solution • Ointments • Others By Application Skin Sterilization • Instrument Sterilization • Disinfectant • Others
Instrument sterilization application is expected to drive the adoption of povidone iodine market.
COVID-19 has increased the demand for povidone iodine owing to increased demand for instrument sterilization during COVID-19 pandemic.
Loading Table Of Content...

