0
2021
Power Distribution Unit Market

Power Distribution Unit Market

by Type (Metered, Monitored, Switched, Basic and Others), by Phase (Single and Three), and End Use Industry (IT & Telecom, Healthcare, Government & Defense, Banking, Financial Services, and Insurance (BFSI), and others): Global Opportunity Analysis and Industry Forecast, 2021-2030

Report Code: A13798
Nov 2021 | Pages: 244
Tables: 125
Charts: 61
  • Formats*:

  • pdf

    Single User License, Five User
    License & Enterprise User License

  • xls

    Data Pack Excel License

  • ppt

    It comes with the additional cost
    of $2500.00 contact sales.


COVID-19

Pandemic disrupted the entire world and affected many industries.

Get detailed COVID-19 impact analysis on the Power Distribution Unit Market

Request Now !

Power Distribution Unit Market Analysis-2030

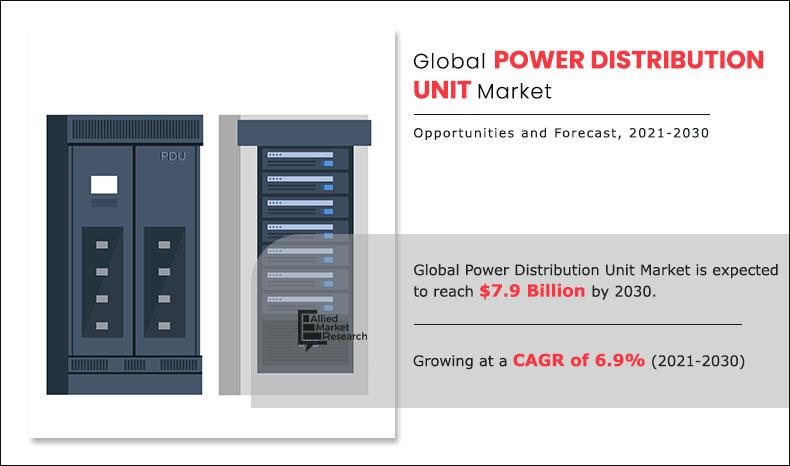
The power distribution unit market size was valued at $4.1 billion in 2020, and is projected to reach $7.9 billion by 2030, growing at a CAGR of 6.9% from 2021 to 2030. The power distribution unit (PDU) is in charge of supplying reliable network power to various devices. It cannot generate electricity and does not act as a secondary power source but it can provide AC or DC power to remote equipment from a UPS, a generator, or utility power. The power distribution unit is space saving and simple to transfer and adapt to future data center restructuring. The PDU provides greater power protection and monitoring, as well as the flexibility and scalability to meet specific power distribution needs. It not only increases availability, but it also lowers the cost of original investment.

The trend of work from has been effective for non-manufacturing sectors; which resulted in purchase and utilization of more spaces in data centers. This consequently increased the demand for power distribution units.

Numerous factors such as cost-effective IT operations, increasing requirement from end use industry, and growing data centers complexities drives growth of the market globally. In addition, cloud computing, virtualization, and evolution of alternating phased power are expected to drive the market during the forecast period. However, space constraint & complex wiring systems with increasing number of power distribution units is the major restraint for the power distribution unit market globally. Furthermore, increasing adoption in data centers is providing numerous opportunities for the market globally during the forecast period.

Power-Distribution-Unit-Market-2021-2030

The power distribution unit market is segmented on the basis of type, phase, end use industry, and region. Based on the type, the market is segmented into metered, monitored, switched, basic and others. By phase, the market is bifurcated into single and three. End use industry covered in the report are IT & telecom, healthcare, government & defense, banking, financial services and insurance (BFSI) and others. The report further outlines the details about the revenue generated through the sale of power distribution unit across North America, Europe, Asia-Pacific, and LAMEA. North America is expected to have a significant share in the power distribution unit market in 2020. Increased awareness of cloud computing in emerging markets such as India and China will boost the demand for power distribution units in Asia-Pacific.

Major players operating in the power distribution unit market include Eaton, Siemon, Leviton, Siemens, Powertek, Schneider, Cyber Power systems, Raritan, Vertiv group and Nvent.

Other players in the power distribution unit industry are Tripp Lite, Panduit Delta Electronics, Socomec, and others. 

Power Distribution Unit Market, by Type

The metered segment is expected to grow at a 6.7% rate of CAGR during the forecast period, while monitored segment is the fastest growing segment, growing around 7.4% CAGR during the forecast period. Metered PDU provides remote monitoring capabilities and access to power data whenever and wherever required. Because of which it is adopted in wide range of end-use industries. 

Power Distribution Unit Market
By Type

Your browser does not support the canvas element.

Metered PDU holds a dominant position in 2020 and Monitored PDU is projected as the most lucrative segment.

Get more information on this report : Request Sample Pages

Power Distribution Unit Market, by Phase

The three-phase segment accounted for the largest share i.e. 59.6% and is the fastest growing segment, growing around 7.0% CAGR over the forecasted period.

Power Distribution Unit Market
By Phase

Your browser does not support the canvas element.

Three Phase is projected as the most lucrative segment.

Get more information on this report : Request Sample Pages

Power Distribution Unit Market, by End Use Industry

The IT & Telecom industry accounted for the largest share i.e. 20.1% and is the fastest growing segment, growing around 8.8% CAGR over the forecasted period. IT & Telecom industry is expected to be the fastest growing segment growing at around CAGR of 8.8%. IT and Telecom includes various IT firms and telecommunication companies such as mobile number operator and wireless service provider. Data centers have become a more strategic asset for IT companies as well as telecom operators. These industries require PDUs to efficiently deliver power and thus expected to have high demand in coming years.

Power Distribution Unit Market
By End Use Industry

Your browser does not support the canvas element.

IT & Telecom is projected as the most lucrative segment.

Get more information on this report : Request Sample Pages

Power Distribution Unit Market, by Region

North America contributed the 37.3% market share in 2020 and is projected to grow at CAGR of 5.2% during the forecast period. Asia-Pacific is the fastest growing segment, growing around 9.2% CAGR over the forecasted period. This is attributed to rising IT and Telecommunication industry in India, China and others. Furthermore, the power distribution unit market share is analyzed across all the significant regions and countries.

Power Distribution Unit Market
By Region

2030
Europe 
North America
Asia-Pacific
LAMEA

North America holds a dominant position in 2020 and Asia-Pacific will register the highest CAGR during the forecast period.

Get more information on this report : Request Sample Pages

Key Benefits For Stakeholders

  • The report provides in-depth analysis of the power distribution unit market along with the current trends and future estimations. 
  • The power distribution market size is provided in terms of revenue.
  • This report highlights the key drivers, power distribution unit market opportunities, and restraints of the market along with the impact analysis during the forecast period.
  • Porter’s five forces analysis helps to analyze the potential of the buyers & suppliers and the competitive scenario of the power distribution unit market for strategy building.
  • A comprehensive market analysis covers the factors that drive and restrain the power distribution unit market growth.
  • The qualitative data about market dynamics, power distribution unit market trends, and developments is provided in the report.

Impact Of Covid-19 On The Global Power Distribution Unit Market

  • COVID-19 is an infectious disease that originated in Hubei province of the Wuhan city in China in late December. The highly contagious disease, caused by a virus, severe acute respiratory syndrome coronavirus 2 (SARS-CoV-2), is transmitted from human to human. Since the outbreak in December 2019, the disease has spread to almost 213 countries around the globe with the World Health Organization declaring it a public health emergency on March 11, 2020. 
  • The outbreak of COVID-19 pandemic had led to partial or complete shutdown of end use industries for power distribution unit. Furthermore, owing to the lockdown implemented across various countries, national and international transport were hampered in 2020, but some of the countries have begun vaccination drives which has positively impacted the supply chain of power distribution unit across the globe. In 2020, there was insufficiency in raw material which hampered the production rate of power distribution unit.
  • Moreover, People are being advised to stay at home as a precaution due to the ongoing COVID-19 outbreak. Several businesses have adopted a work-from-home policy to safeguard their staff as well as to better serve their clients. As a result, digital traffic and the use of online communication services has increased. During this uncertain period, data centers are playing a critical role in securing and maintaining secure digital infrastructure. This crisis is likely to shift attention to the significance of upgraded digital infrastructure, as well as data centers, opening the path for market expansion

Power Distribution Unit Market Report Highlights

Aspects Details
By Type
  • Metered PDU
  • Monitored PDU
  • Switched PDU
  • Basic PDU
  • Others
By Phase
  • Single
  • Three
By End-Use Industry
  • It & telecom
  • Healthcare
  • Government & Defense
  • Banking, Financial Services and Insurance (BFSI)
  • Others
By Region
  • North America  (U.S, Canada, Mexico)
  • Europe  (Germany, France, Spain, Italy, UK, Rest of Europe)
  • Asia-Pacific  (China, Japan, India, South Korea, Australia, Rest of Asia-Pacific)
  • LAMEA  (Brazil, UAE, South Africa, Saudi Arabia, Rest of LAMEA)
Key Market Players Leviton, Schneider Electric, Vertiv group Nvent, Powertek, Eaton, Cyber Power systems, Siemens, Siemon, Raritan
 

CHAPTER 1:INTRODUCTION

1.1.Report description
1.2.Key benefits for stakeholders
1.3.Key market segments
1.4.Research methodology

1.4.1.Primary research
1.4.2.Secondary research
1.4.3.Analyst tools and models

CHAPTER 2:EXECUTIVE SUMMARY

2.1.Key findings of the study
2.2.Key findings

2.2.1.Top investment pockets

2.3.CXO perspective

CHAPTER 3:MARKET OVERVIEW

3.1.Market definition and scope
3.2.Key forces shaping the power distribution unit market

3.2.1.Bargaining power of the suppliers
3.2.2.Bargaining power of the buyers
3.2.3.Threat of new entrants
3.2.4.Threat of substitutes
3.2.5.Competitive rivalry

3.3.Market dynamics

3.3.1.Drivers

3.3.1.1.Increase in demand for stable power
3.3.1.2.Increase in focus toward reducing energy losses

3.3.2.Restraint

3.3.2.1.Space constraint & complex wiring systems with increasing number of power distribution units

3.3.3.Opportunity

3.3.3.1.Rise in number of data centers across the globe

3.4.Value chain
3.5.Impact of COVID-19 outbreak on the power distribution unit market

CHAPTER 4:POWER DISTRIBUTION UNIT MARKET, BY TYPE

4.1.Overview

4.1.1.Market size and forecast

4.2.Metered PDU

4.2.1.Key market trends, growth factors, and opportunities
4.2.2.Market size and forecast, by region
4.2.3.Market analysis, by country

4.3.Monitored PDU

4.3.1.Key market trends, growth factors, and opportunities
4.3.2.Market size and forecast, by region
4.3.3.Market analysis, by country

4.4.Switched PDU

4.4.1.Key market trends, growth factors, and opportunities
4.4.2.Market size and forecast, by region
4.4.3.Market analysis, by country

4.5.Basic PDU

4.5.1.Key market trends, growth factors, and opportunities
4.5.2.Market size and forecast, by region
4.5.3.Market analysis, by country

4.6.Others

4.6.1.Key market trends, growth factors, and opportunities
4.6.2.Market size and forecast, by region
4.6.3.Market analysis, by country

CHAPTER 5:POWER DISTRIBUTION UNIT MARKET, BY PHASE

5.1.Overview

5.1.1.Market size and forecast

5.2.Single Phase

5.2.1.Key market trends, growth factors, and opportunities
5.2.2.Market size and forecast, by region
5.2.3.Market analysis, by country

5.3.Three phase

5.3.1.Key market trends, growth factors, and opportunities
5.3.2.Market size and forecast, by region
5.3.3.Market analysis, by country

CHAPTER 6:POWER DISTRIBUTION UNIT MARKET, BY END-USE INDUSTRY

6.1.Overview

6.1.1.Market size and forecast

6.2.IT & telecom

6.2.1.Key market trends, growth factors, and opportunities
6.2.2.Market size and forecast, by region
6.2.3.Market analysis, by country

6.3.Healthcare

6.3.1.Key market trends, growth factors, and opportunities
6.3.2.Market size and forecast, by region
6.3.3.Market analysis, by country

6.4.Government & Defense

6.4.1.Key market trends, growth factors, and opportunities
6.4.2.Market size and forecast, by region
6.4.3.Market analysis, by country

6.5.Banking, Financial Services, and Insurance (BFSI)

6.5.1.Key market trends, growth factors, and opportunities
6.5.2.Market size and forecast, by region
6.5.3.Market analysis, by country

6.6.Others

6.6.1.Key market trends, growth factors, and opportunities
6.6.2.Market size and forecast, by region
6.6.3.Market analysis, by country

CHAPTER 7:POWER DISTRIBUTION UNIT MARKET, BY REGION

7.1.Overview

7.1.1.Market size and forecast

7.2.North America

7.2.1.Key market trends, growth factors, and opportunities
7.2.2.Market size and forecast, by type
7.2.3.Market size and forecast, by phase
7.2.4.Market size and forecast, by end-use industry
7.2.5.Market size and forecast, by country

7.2.5.1.U.S.

7.2.5.1.1.Market size and forecast, by type
7.2.5.1.2.Market size and forecast, by phase
7.2.5.1.3.Market size and forecast, by end-use industry

7.2.5.2.Canada

7.2.5.2.1.Market size and forecast, by type
7.2.5.2.2.Market size and forecast, by phase
7.2.5.2.3.Market size and forecast, by end-use industry

7.2.5.3.Mexico

7.2.5.3.1.Market size and forecast, by type
7.2.5.3.2.Market size and forecast, by phase
7.2.5.3.3.Market size and forecast, by end-use industry

7.3.Europe

7.3.1.Key market trends, growth factors, and opportunities
7.3.2.Market size and forecast, by type
7.3.3.Market size and forecast, by phase
7.3.4.Market size and forecast, by end-use industry
7.3.5.Market size and forecast, by country

7.3.5.1.Germany

7.3.5.1.1.Market size and forecast, by type
7.3.5.1.2.Market size and forecast, by phase
7.3.5.1.3.Market size and forecast, by end-use industry

7.3.5.2.France

7.3.5.2.1.Market size and forecast, by type
7.3.5.2.2.Market size and forecast, by phase
7.3.5.2.3.Market size and forecast, by end-use industry

7.3.5.3.UK

7.3.5.3.1.Market size and forecast, by type
7.3.5.3.2.Market size and forecast, by phase
7.3.5.3.3.Market size and forecast, by end-use industry

7.3.5.4.Italy

7.3.5.4.1.Market size and forecast, by type
7.3.5.4.2.Market size and forecast, by phase
7.3.5.4.3.Market size and forecast, by end-use industry

7.3.5.5.Spain

7.3.5.5.1.Market size and forecast, by type
7.3.5.5.2.Market size and forecast, by phase
7.3.5.5.3.Market size and forecast, by end-use industry

7.3.5.6.Rest of Europe

7.3.5.6.1.Market size and forecast, by type
7.3.5.6.2.Market size and forecast, by phase
7.3.5.6.3.Market size and forecast, by end-use industry

7.4.Asia-Pacific

7.4.1.Key market trends, growth factors, and opportunities
7.4.2.Market size and forecast, by type
7.4.3.Market size and forecast, by phase
7.4.4.Market size and forecast, by end-use industry
7.4.5.Market size and forecast, by country

7.4.5.1.China

7.4.5.1.1.Market size and forecast, by type
7.4.5.1.2.Market size and forecast, by type
7.4.5.1.3.Market size and forecast, by end-use industry

7.4.5.2.Japan

7.4.5.2.1.Market size and forecast, by type
7.4.5.2.2.Market size and forecast, by phase
7.4.5.2.3.Market size and forecast, by end-use industry

7.4.5.3.India

7.4.5.3.1.Market size and forecast, by type
7.4.5.3.2.Market size and forecast, by type
7.4.5.3.3.Market size and forecast, by end-use industry

7.4.5.4.South Korea

7.4.5.4.1.Market size and forecast, by type
7.4.5.4.2.Market size and forecast, by type
7.4.5.4.3.Market size and forecast, by end-use industry

7.4.5.5.Australia

7.4.5.5.1.Market size and forecast, by type
7.4.5.5.2.Market size and forecast, by phase
7.4.5.5.3.Market size and forecast, by end-use industry

7.4.5.6.Rest of Asia-Pacific

7.4.5.6.1.Market size and forecast, by type
7.4.5.6.2.Market size and forecast, by phase
7.4.5.6.3.Market size and forecast, by end-use industry

7.5.LAMEA

7.5.1.Key market trends, growth factors, and opportunities
7.5.2.Market size and forecast, by type
7.5.3.Market size and forecast, by phase
7.5.4.Market size and forecast, by end-use industry
7.5.5.Market size and forecast, by country

7.5.5.1.Brazil

7.5.5.1.1.Market size and forecast, by type
7.5.5.1.2.Market size and forecast, by phase
7.5.5.1.3.Market size and forecast, by end-use industry

7.5.5.2.UAE

7.5.5.2.1.Market size and forecast, by type
7.5.5.2.2.Market size and forecast, by type
7.5.5.2.3.Market size and forecast, by end-use industry

7.5.5.3.SAUDI ARABIA

7.5.5.3.1.Market size and forecast, by type
7.5.5.3.2.Market size and forecast, by type
7.5.5.3.3.Market size and forecast, by end-use industry

7.5.5.4.South Africa

7.5.5.4.1.Market size and forecast, by type
7.5.5.4.2.Market size and forecast, by phase
7.5.5.4.3.Market size and forecast, by end-use industry

7.5.5.5.Rest of LAMEA

7.5.5.5.1.Market size and forecast, by type
7.5.5.5.2.Market size and forecast, by type
7.5.5.5.3.Market size and forecast, by end-use industry

CHAPTER 8:COMPETITIVE LANDSCAPE

8.1.Introduction

8.1.1.Market player positioning, 2020

8.2.Competitive Heatmap
8.3.Product mapping of top 10 players

CHAPTER 9:COMPANY PROFILES

9.1.NVent

9.1.1.Company overview
9.1.2.Company snapshot
9.1.3.Product portfolio
9.1.4.Business performance

9.2.Vertiv Group Corp

9.2.1.Company overview
9.2.2.Key executive
9.2.3.Company snapshot
9.2.4.Product portfolio
9.2.5.Business performance

9.3.Raritan Inc.

9.3.1.Company overview
9.3.2.Company snapshot
9.3.3.Product portfolio

9.4.Schneider Electric

9.4.1.Company overview
9.4.2.Company snapshot
9.4.3.Operating business segments
9.4.4.Product portfolio
9.4.5.Business performance

9.5.Siemens

9.5.1.Company overview
9.5.2.Company snapshot
9.5.3.Key executives
9.5.4.Product portfolio
9.5.5.Business performance

9.6.Cyber Power Systems

9.6.1.Company overview
9.6.2.Key executive
9.6.3.Company snapshot
9.6.4.Product portfolio

9.7.POWERTEK

9.7.1.Company overview
9.7.2.Key executive
9.7.3.Company snapshot
9.7.4.Product portfolio

9.8.LEVITON MANUFACTURING CO., INC

9.8.1.Company overview
9.8.2.Key executive
9.8.3.Company snapshot
9.8.4.Product portfolio

9.9.Siemon

9.9.1.Company overview
9.9.2.Key executive
9.9.3.Company snapshot
9.9.4.Product portfolio

9.10.Eaton Corporation Plc.

9.10.1.Company overview
9.10.2.Company snapshot
9.10.3.Operating business segments
9.10.4.Product portfolio
9.10.5.Business performance


LIST OF TABLES

TABLE 01.POWER DISTRIBUTION UNIT MARKET, BY TYPE, 2021–2030 ($MILLION)
TABLE 02.METERED POWER DISTRIBUTION UNIT MARKET, BY REGION, 2021–2030 ($MILLION)
TABLE 03.MONITORED POWER DISTRIBUTION UNIT MARKET, BY REGION, 2021–2030 ($MILLION)
TABLE 04.SWITCHED PDU POWER DISTRIBUTION UNIT MARKET, BY REGION, 2021–2030 ($MILLION)
TABLE 05.BASIC POWER DISTRIBUTION UNIT MARKET, BY REGION, 2021–2030 ($MILLION)
TABLE 06.OTHER POWER DISTRIBUTION UNIT MARKET, BY REGION, 2021–2030 ($MILLION)
TABLE 07.POWER DISTRIBUTION UNIT MARKET, BY PHASE, 2021–2030 ($MILLION)
TABLE 08.SINGLE PHASE POWER DISTRIBUTION UNIT MARKET, BY REGION, 2021–2030 ($MILLION)
TABLE 09.THREE PHASE POWER DISTRIBUTION UNIT MARKET, BY REGION, 2021–2030 ($MILLION)
TABLE 10.GLOBAL POWER DISTRIBUTION UNIT MARKET, BY END-USE INDUSTRY, 2021–2030 ($MILLION)
TABLE 11.POWER DISTRIBUTION UNIT MARKET FOR IT & TELECOM, BY REGION, 2020–2030 ($MILLION)
TABLE 12.POWER DISTRIBUTION UNIT MARKET FOR HEALTHCARE, BY REGION, 2020–2030 ($MILLION)
TABLE 13.POWER DISTRIBUTION UNIT MARKET FOR GOVERNMENT & DEFENSE, BY REGION, 2020–2030 ($MILLION)
TABLE 14.POWER DISTRIBUTION UNIT MARKET FOR BANKING, FINANCIAL SERVICES AND INSURANCE (BFSI), BY REGION, 2020–2030 ($MILLION)
TABLE 15.POWER DISTRIBUTION UNIT MARKET FOR OTHER END USE INDUSTRY, BY REGION, 2020–2030 ($MILLION)
TABLE 16.POWER DISTRIBUTION UNIT MARKET, BY REGION, 2020–2030 ($MILLION)
TABLE 17.NORTH AMERICA POWER DISTRIBUTION UNIT MARKET, BY TYPE, 2020–2030 ($MILLION)
TABLE 18.NORTH AMERICA POWER DISTRIBUTION UNIT MARKET, BY PHASE, 2020–2030 ($MILLION)
TABLE 19.NORTH AMERICA POWER DISTRIBUTION UNIT MARKET, BY END-USE INDUSTRY, 2020–2030 ($MILLION)
TABLE 20.NORTH AMERICA POWER DISTRIBUTION UNIT MARKET, BY COUNTRY, 2020–2030 ($MILLION)
TABLE 21.U.S. POWER DISTRIBUTION UNIT MARKET, BY TYPE, 2020–2030 ($MILLION)
TABLE 22.U.S. POWER DISTRIBUTION UNIT MARKET, BY PHASE, 2020–2030 ($MILLION)
TABLE 23.U.S. POWER DISTRIBUTION UNIT MARKET, BY END-USE INDUSTRY, 2020–2030 ($MILLION)
TABLE 24.CANADA POWER DISTRIBUTION UNIT MARKET, BY TYPE, 2020–2030 ($MILLION)
TABLE 25.CANADA POWER DISTRIBUTION UNIT MARKET, BY TYPE, 2020–2030 ($MILLION)
TABLE 26.CANADA POWER DISTRIBUTION UNIT MARKET, BY END-USE INDUSTRY, 2020–2030 ($MILLION)
TABLE 27.MEXICO POWER DISTRIBUTION UNIT MARKET, BY TYPE, 2020–2030 ($MILLION)
TABLE 28.MEXICO POWER DISTRIBUTION UNIT MARKET, BY TYPE, 2020–2030 ($MILLION)
TABLE 29.MEXICO POWER DISTRIBUTION UNIT MARKET, BY END-USE INDUSTRY, 2020–2030 ($MILLION)
TABLE 30.EUROPE POWER DISTRIBUTION UNIT MARKET, BY TYPE, 2020–2030 ($MILLION)
TABLE 31.EUROPE POWER DISTRIBUTION UNIT MARKET, BY TYPE, 2020–2030 ($MILLION)
TABLE 32.EUROPE POWER DISTRIBUTION UNIT MARKET, BY END-USE INDUSTRY, 2020–2030 ($MILLION)
TABLE 33.EUROPE POWER DISTRIBUTION UNIT MARKET, BY COUNTRY, 2020–2030 ($MILLION)
TABLE 34.GERMANY POWER DISTRIBUTION UNIT MARKET, BY TYPE, 2020–2030 ($MILLION)
TABLE 35.GERMANY POWER DISTRIBUTION UNIT MARKET, BY PHASE, 2020–2030 ($MILLION)
TABLE 36.GERMANY POWER DISTRIBUTION UNIT MARKET, BY END-USE INDUSTRY, 2020–2030 ($MILLION)
TABLE 37.FRANCE POWER DISTRIBUTION UNIT MARKET, BY TYPE, 2020–2030 ($MILLION)
TABLE 38.FRANCE POWER DISTRIBUTION UNIT MARKET, BY PHASE, 2020–2030 ($MILLION)
TABLE 39.FRANCE POWER DISTRIBUTION UNIT MARKET, BY END-USE INDUSTRY, 2020–2030 ($MILLION)
TABLE 40.UK POWER DISTRIBUTION UNIT MARKET, BY TYPE, 2020–2030 ($MILLION)
TABLE 41.UK POWER DISTRIBUTION UNIT MARKET, BY PHASE, 2020–2030 ($MILLION)
TABLE 42.UK POWER DISTRIBUTION UNIT MARKET, BY END-USE INDUSTRY, 2020–2030 ($MILLION)
TABLE 43.ITALY POWER DISTRIBUTION UNIT MARKET, BY TYPE, 2020–2030 ($MILLION)
TABLE 44.ITALY POWER DISTRIBUTION UNIT MARKET, BY PHASE, 2020–2030 ($MILLION)
TABLE 45.ITALY POWER DISTRIBUTION UNIT MARKET, BY END-USE INDUSTRY, 2020–2030 ($MILLION)
TABLE 46.SPAIN POWER DISTRIBUTION UNIT MARKET, BY TYPE, 2020–2030 ($MILLION)
TABLE 47.SPAIN POWER DISTRIBUTION UNIT MARKET, BY PHASE, 2020–2030 ($MILLION)
TABLE 48.SPAIN POWER DISTRIBUTION UNIT MARKET, BY END-USE INDUSTRY, 2020–2030 ($MILLION)
TABLE 49.REST OF EUROPE POWER DISTRIBUTION UNIT MARKET, BY TYPE, 2020–2030 ($MILLION)
TABLE 50.REST OF EUROPE POWER DISTRIBUTION UNIT MARKET, BY PHASE, 2020–2030 ($MILLION)
TABLE 51.REST OF EUROPE POWER DISTRIBUTION UNIT MARKET, BY END-USE INDUSTRY, 2020–2030 ($MILLION)
TABLE 52.ASIA-PACIFIC POWER DISTRIBUTION UNIT MARKET, BY TYPE, 2020–2030 ($MILLION)
TABLE 53.ASIA-PACIFIC POWER DISTRIBUTION UNIT MARKET, BY TYPE, 2020–2030 ($MILLION)
TABLE 54.ASIA-PACIFIC POWER DISTRIBUTION UNIT MARKET, BY END-USE INDUSTRY, 2020–2030 ($MILLION)
TABLE 55.ASIA-PACIFIC POWER DISTRIBUTION UNIT MARKET, BY COUNTRY, 2020–2030 ($MILLION)
TABLE 56.CHINA POWER DISTRIBUTION UNIT MARKET, BY TYPE, 2020–2030 ($MILLION)
TABLE 57.CHINA POWER DISTRIBUTION UNIT MARKET, BY TYPE, 2020–2030 ($MILLION)
TABLE 58.CHINA POWER DISTRIBUTION UNIT MARKET, BY END-USE INDUSTRY, 2020–2030 ($MILLION)
TABLE 59.JAPAN POWER DISTRIBUTION UNIT MARKET, BY TYPE, 2020–2030 ($MILLION)
TABLE 60.JAPAN POWER DISTRIBUTION UNIT MARKET, BY PHASE, 2020–2030 ($MILLION)
TABLE 61.JAPAN POWER DISTRIBUTION UNIT MARKET, BY END-USE INDUSTRY, 2020–2030 ($MILLION)
TABLE 62.INDIA POWER DISTRIBUTION UNIT MARKET, BY TYPE, 2020–2030 ($MILLION)
TABLE 63.INDIA POWER DISTRIBUTION UNIT MARKET, BY TYPE, 2020–2030 ($MILLION)
TABLE 64.INDIA POWER DISTRIBUTION UNIT MARKET, BY END-USE INDUSTRY, 2020–2030 ($MILLION)
TABLE 65.SOUTH KOREA POWER DISTRIBUTION UNIT MARKET, BY TYPE, 2020–2030 ($MILLION)
TABLE 66.SOUTH KOREA POWER DISTRIBUTION UNIT MARKET, BY TYPE, 2020–2030 ($MILLION)
TABLE 67.SOUTH KOREA POWER DISTRIBUTION UNIT MARKET, BY END-USE INDUSTRY, 2020–2030 ($MILLION)
TABLE 68.AUSTRALIA POWER DISTRIBUTION UNIT MARKET, BY TYPE, 2020–2030 ($MILLION)
TABLE 69.AUSTRALIA POWER DISTRIBUTION UNIT MARKET, BY PHASE, 2020–2030 ($MILLION)
TABLE 70.AUSTRALIA POWER DISTRIBUTION UNIT MARKET, BY END-USE INDUSTRY, 2020–2030 ($MILLION)
TABLE 71.REST OF ASIA-PACIFIC POWER DISTRIBUTION UNIT MARKET, BY TYPE, 2020–2030 ($MILLION)
TABLE 72.REST OF ASIA-PACIFIC POWER DISTRIBUTION UNIT MARKET, BY PHASE, 2020–2030 ($MILLION)
TABLE 73.REST OF ASIA-PACIFIC POWER DISTRIBUTION UNIT MARKET, BY END-USE INDUSTRY, 2020–2030 ($MILLION)
TABLE 74.LAMEA POWER DISTRIBUTION UNIT MARKET, BY TYPE, 2020–2030 ($MILLION)
TABLE 75.LAMEA POWER DISTRIBUTION UNIT MARKET, BY PHASE, 2020–2030 ($MILLION)
TABLE 76.LAMEA POWER DISTRIBUTION UNIT MARKET, BY END-USE INDUSTRY, 2020–2030 ($MILLION)
TABLE 77.LAMEA POWER DISTRIBUTION UNIT MARKET, BY COUNTRY, 2020–2030 ($MILLION)
TABLE 78.BRAZIL POWER DISTRIBUTION UNIT MARKET, BY TYPE, 2020–2030 ($MILLION)
TABLE 79.BRAZIL POWER DISTRIBUTION UNIT MARKET, BY TYPE, 2020–2030 ($MILLION)
TABLE 80.BRAZIL POWER DISTRIBUTION UNIT MARKET, BY END-USE INDUSTRY, 2020–2030 ($MILLION)
TABLE 81.UAE POWER DISTRIBUTION UNIT MARKET, BY TYPE, 2020–2030 ($MILLION)
TABLE 82.UAE POWER DISTRIBUTION UNIT MARKET, BY TYPE, 2020–2030 ($MILLION)
TABLE 83.UAE POWER DISTRIBUTION UNIT MARKET, BY END-USE INDUSTRY, 2020–2030 ($MILLION)
TABLE 84.SAUDI ARABIA POWER DISTRIBUTION UNIT MARKET, BY TYPE, 2020–2030 ($MILLION)
TABLE 85.SAUDI ARABIA POWER DISTRIBUTION UNIT MARKET, BY TYPE, 2020–2030 ($MILLION)
TABLE 86.SAUDI ARABIA POWER DISTRIBUTION UNIT MARKET, BY END-USE INDUSTRY, 2020–2030 ($MILLION)
TABLE 87.SOUTH AFRICA POWER DISTRIBUTION UNIT MARKET, BY TYPE, 2020–2030 ($MILLION)
TABLE 88.SOUTH AFRICA POWER DISTRIBUTION UNIT MARKET, BY PHASE, 2020–2030 ($MILLION)
TABLE 89.SOUTH AFRICA POWER DISTRIBUTION UNIT MARKET, BY END-USE INDUSTRY, 2020–2030 ($MILLION)
TABLE 90.REST OF LAMEA POWER DISTRIBUTION UNIT MARKET, BY TYPE, 2020–2030 ($MILLION)
TABLE 91.REST OF LAMEA POWER DISTRIBUTION UNIT MARKET, BY TYPE, 2020–2030 ($MILLION)
TABLE 92.REST OF LAMEA POWER DISTRIBUTION UNIT MARKET, BY END-USE INDUSTRY, 2020–2030 ($MILLION)
TABLE 93.NVENT: COMPANY SNAPSHOT
TABLE 94.NVENT: PRODUCT PORTFOLIO
TABLE 95.NVENT: NET SALES, 2018–2020 ($MILLION)
TABLE 96.VERTIV GROUP CORP: KEY EXECUTIVES
TABLE 97.VERTIV GROUP CORP: COMPANY SNAPSHOT
TABLE 98.VERTIV GROUP CORP: PRODUCT PORTFOLIO
TABLE 99.VERTIS: NET SALES, 2018–2020 ($MILLION)
TABLE 100.RARITAN: COMPANY SNAPSHOT
TABLE 101.RARITAN: PRODUCT PORTFOLIO
TABLE 102.SCHNEIDER ELECTRIC: COMPANY SNAPSHOT
TABLE 103.SCHNEIDER ELECTRIC.: OPERATING SEGMENTS
TABLE 104.SCHNEIDER ELECTRIC: PRODUCT PORTFOLIO
TABLE 105.OVERALL FINANCIAL STATUS ($MILLION)
TABLE 106.SIEMENS: COMPANY SNAPSHOT
TABLE 107.SIEMENS: KEY EXECUTIVES
TABLE 108.SIEMENS: PRODUCT PORTFOLIO
TABLE 109.OVERALL FINANCIAL STATUS ($MILLION)
TABLE 110.CYBER POWER SYSTEMS: KEY EXECUTIVES
TABLE 111.CYBER POWER SYSTEMS (USA), INC.: COMPANY SNAPSHOT
TABLE 112.CYBER POWER SYSTEMS : PRODUCT PORTFOLIO
TABLE 113.POWERTEK: KEY EXECUTIVES
TABLE 114.POWERTEK: COMPANY SNAPSHOT
TABLE 115.POWERTEK: PRODUCT PORTFOLIO
TABLE 116.LEVITON: KEY EXECUTIVES
TABLE 117.LEVITON: COMPANY SNAPSHOT
TABLE 118.LEVITON: PRODUCT PORTFOLIO
TABLE 119.SIEMON: KEY EXECUTIVES
TABLE 120.SIEMON: COMPANY SNAPSHOT
TABLE 121.SIEMON: PRODUCT PORTFOLIO
TABLE 122.EATON CORPORATION PLC: COMPANY SNAPSHOT
TABLE 123.EATON CORPORATION PLC: OPERATING SEGMENTS
TABLE 124.EATON CORPORATION PLC: PRODUCT PORTFOLIO
TABLE 125.OVERALL FINANCIAL STATUS ($MILLION)

LIST OF FIGURES

FIGURE 01.KEY MARKET SEGMENTS
FIGURE 02.POWER DISTRIBUTION UNIT MARKET SNAPSHOT, BY SEGMENTION, 2021-2030
FIGURE 03.POWER DISTRIBUTION UNIT MARKET SNAPSHOT, BY COUNTRY, 2021-2030
FIGURE 04.TOP INVESTMENT POCKETS, BY COUNTRY
FIGURE 05.MODERATE BARGAINING POWER OF SUPPLIERS
FIGURE 06.MODERATE BARGAINING POWER OF BUYERS
FIGURE 07.MODERATE THREAT OF NEW ENTRANTS
FIGURE 08.MODERATE THREAT OF SUBSTITUTES
FIGURE 09.MODERATE INTENSITY OF RIVALRY
FIGURE 10.GLOBAL POWER DISTRIBUTION UNIT MARKET DYNAMICS
FIGURE 11.POWER DISTRIBUTION UNIT MARKET: VALUE CHAIN
FIGURE 12.POWER DISTRIBUTION UNIT MARKET, BY TYPE, 2020–2030 ($MILLION)
FIGURE 13.COMPARATIVE ANALYSIS OF METERED POWER DISTRIBUTION UNIT MARKET, BY COUNTRY, 2020 & 2030 ($MILLION)
FIGURE 14.COMPARATIVE ANALYSIS OF MONITORED PDU POWER DISTRIBUTION UNIT MARKET, BY COUNTRY, 2020 & 2030 ($MILLION)
FIGURE 15.COMPARATIVE ANALYSIS OF SWITCHED PDU POWER DISTRIBUTION UNIT MARKET, BY COUNTRY, 2020 & 2030 ($MILLION)
FIGURE 16.COMPARATIVE ANALYSIS OF BASIC POWER DISTRIBUTION UNIT MARKET, BY COUNTRY, 2020 & 2030 ($MILLION)
FIGURE 17.COMPARATIVE ANALYSIS OF OTHER POWER DISTRIBUTION UNIT MARKET, BY COUNTRY, 2020 & 2030 ($MILLION)
FIGURE 18.POWER DISTRIBUTION UNIT MARKET, BY PHASE, 2020–2030 ($MILLION)
FIGURE 19.COMPARATIVE ANALYSIS OF SINGLE PHASE POWER DISTRIBUTION UNIT MARKET, BY COUNTRY, 2020 & 2030 ($MILLION)
FIGURE 20.COMPARATIVE ANALYSIS OF THREE PHASE POWER DISTRIBUTION UNIT MARKET, BY COUNTRY, 2020 & 2030 ($MILLION)
FIGURE 21.POWER DISTRIBUTION UNIT MARKET, BY END-USE INDUSTRY, 2021–2030 ($MILLION)
FIGURE 22.COMPARATIVE ANALYSIS OF POWER DISTRIBUTION UNIT MARKET FOR IT & TELECOM, BY COUNTRY, 2020 & 2030 ($MILLION)
FIGURE 23.COMPARATIVE ANALYSIS OF POWER DISTRIBUTION UNIT MARKET FOR HEALTHCARE, BY COUNTRY, 2020 & 2030 ($MILLION)
FIGURE 24.COMPARATIVE ANALYSIS OF POWER DISTRIBUTION UNIT MARKET FOR GOVERNMENT & DEFENSE, BY COUNTRY, 2020 & 2030 ($MILLION)
FIGURE 25.COMPARATIVE ANALYSIS OF POWER DISTRIBUTION UNIT MARKET FOR BANKING, FINANCIAL SERVICES AND INSURANCE (BFSI), BY COUNTRY, 2020 & 2030 ($MILLION)
FIGURE 26.COMPARATIVE ANALYSIS OF POWER DISTRIBUTION UNIT MARKET FOR OTHER END USE INDUSTRY, BY COUNTRY, 2020 & 2030 ($MILLION)
FIGURE 27.POWER DISTRIBUTION UNIT MARKET, BY REGION, 2020–2030 ($MILLION)
FIGURE 28.U.S. POWER DISTRIBUTION UNIT MARKET REVENUE, 2020–2030 ($MILLION)
FIGURE 29.CANADA POWER DISTRIBUTION UNIT MARKET REVENUE, 2020–2030 ($MILLION)
FIGURE 30.MEXICO POWER DISTRIBUTION UNIT MARKET REVENUE, 2020–2030 ($MILLION)
FIGURE 31.GERMANY POWER DISTRIBUTION UNIT MARKET REVENUE, 2020–2030 ($MILLION)
FIGURE 32.FRANCE POWER DISTRIBUTION UNIT MARKET REVENUE, 2020–2030 ($MILLION)
FIGURE 33.UK POWER DISTRIBUTION UNIT MARKET REVENUE, 2020–2030 ($MILLION)
FIGURE 34.ITALY POWER DISTRIBUTION UNIT MARKET REVENUE, 2020–2030 ($MILLION)
FIGURE 35.SPAIN POWER DISTRIBUTION UNIT MARKET REVENUE, 2020–2030 ($MILLION)
FIGURE 36.REST OF EUROPE POWER DISTRIBUTION UNIT MARKET REVENUE, 2020–2030 ($MILLION)
FIGURE 37.CHINA POWER DISTRIBUTION UNIT MARKET REVENUE, 2020–2030 ($MILLION)
FIGURE 38.JAPAN POWER DISTRIBUTION UNIT MARKET REVENUE, 2020–2030 ($MILLION)
FIGURE 39.INDIA POWER DISTRIBUTION UNIT MARKET REVENUE, 2020–2030 ($MILLION)
FIGURE 40.SOUTH KOREA POWER DISTRIBUTION UNIT MARKET REVENUE, 2020–2030 ($MILLION)
FIGURE 41.AUSTRALIA POWER DISTRIBUTION UNIT MARKET REVENUE, 2020–2030 ($MILLION)
FIGURE 42.REST OF ASIA-PACIFIC POWER DISTRIBUTION UNIT MARKET REVENUE, 2020–2030 ($MILLION)
FIGURE 43.BRAZIL POWER DISTRIBUTION UNIT MARKET REVENUE, 2020–2030 ($MILLION)
FIGURE 44.UAE POWER DISTRIBUTION UNIT MARKET REVENUE, 2020–2030 ($MILLION)
FIGURE 45.SAUDI ARABIA POWER DISTRIBUTION UNIT MARKET REVENUE, 2020–2030 ($MILLION)
FIGURE 46.SOUTH AFRICA POWER DISTRIBUTION UNIT MARKET REVENUE, 2020–2030 ($MILLION)
FIGURE 47.REST OF LAMEA POWER DISTRIBUTION UNIT MARKET REVENUE, 2020–2030 ($MILLION)
FIGURE 48.MARKET PLAYER POSITIONING, 2020
FIGURE 49.COMPETITIVE HEATMAP
FIGURE 50.PRODUCT MAPPING OF TOP 10 PLAYERS
FIGURE 51.NVENT: NET SALES, 2018–2020 ($MILLION)
FIGURE 52.NVENT: REVENUE SHARE BY SEGMENT, 2020 (%)
FIGURE 53.NVENT: REVENUE SHARE BY REGION, 2020 (%)
FIGURE 54.VERTIS: NET SALES, 2018–2020 ($MILLION)
FIGURE 55.SCHNEIDER ELECTRIC: NET SALES, 2018–2020 ($MILLION)
FIGURE 56.SCHNEIDER ELECTRIC: REVENUE SHARE, BY REGION, 2020 (%)
FIGURE 57.SIEMENS: REVENUE, 2018-2020 ($MILLION)
FIGURE 58.SIEMENS: REVENUE SHARE BY SEGMENT, 2020 (%)
FIGURE 59.SIEMENS: REVENUE SHARE BY REGION, 2020 (%)
FIGURE 60.EATON CORPORATION PLC: NET SALES, 2018–2020 ($MILLION)
FIGURE 61.EATON CORPORATION PLC: REVENUE SHARE, BY SEGMENT, 2020 (%)


According to CXOs of leading companies, the power distribution unit market is anticipated to witness growth during the forecast period, driven by increased demand for end-use industries such as IT & telecom, energy, government & defense, and manufacturing & processing. One of the primary factors driving growth of the power distribution unit (PDU) market is the rise in number of data centers across the globe. The market for PDU is growing primarily due to increase in concerns about power stability for uninterrupted commercial operations and increased power distribution unit installations to reduce energy losses. In addition, acceptance of advanced technology with increased urbanization & digitization and high investments by governments positively impact the market. Furthermore, during the forecast period, the market players are expected to be benefited from shift of enterprises to cloud applications and containerized power solutions for edge data centers.

However, complex wiring systems with increasing number of power distribution units and space constraints in old data centers leading to heating up of spaces is expected to hinder the market growth. Integration of old power distribution units with data management software platform is projected to challenge the power distribution unit (PDU) market during the forecast period.

PURCHASE OPTIONS

Call or Email us

U.S.-Canada Toll-free: +1-800-792-5285
Int'l : +1-503-894-6022
Europe : +44-845-528-1300
Email : help@alliedmarketresearch.com
 
FREQUENTLY ASKED QUESTIONS?

A. • Increased demand for stable power from various end use industries including IT & telecom, healthcare, banking and other government industries is driving the demand for power distribution units.

A. Acquisition and product launch are the key growth strategies for power distribution unit market player.

A. The report sample for global power distribution unit market report can be obtained on demand from the website. Also, the 24*7 chat support and direct call services are provided to procure the sample report.

A. Asia-Pacific is going to provide more business opportunities for power distribution unit market in future owing to increasing number of IT industries in the region.

A. Nvent, Siemen, Eaton and Schneider Electric are some of the major players in the power distribution unit market.

A. The top ten market players are selected based on two key attributes - competitive strength and market positioning.

A. Metered PDU hold the maximum share of the power distribution unit market i.e. around 27.9%.

A. Potential customers for the power distribution units are data centers, IT & telecom Industries, automobiles & BFSI sectors.

A. Increasing number of data centers across the globe and focus of various industries to reduce energy losses will influence the power distribution unit market in next few years.

A. Application of power distribution unit like increasing uptime, minimization of the downtime of servers, reduced overall power consumption and tracking power usage In order to maintain application performance and efficiency. These application of PDUs are expected to drive the market.

Looking for Customization?

 Customization Request

Have a Question?

 Speak with Analyst

Any Confusion?

 Inquire Before Buying

Have a glance of the Report

  Request Sample
RELATED TAGS

Purchase Full Report of
Power Distribution Unit Market

Start reading instantly.
This Report and over 66,966+ more Reports, Available with Avenue Library. T&C*.

  • Online Only
  • $3,712
  • Online cloud access only
  • Restricted print, copy, paste & download
  • Read only
  • Free industry update
    (Within 180 days)
  • Free report update in next update cycle
    (Nov 2022 - Nov 2023)
  • Data Pack
  • $4,125
  • Restricted to one authorized user
  • One print only
  • Available in
    Excel
  • Free industry update
    (Within 180 days)
  •   Free report update in next update cycle
    (Nov 2022 - Nov 2023)
  • Single User
  • $5,769
  • Restricted to one authorized user
  • One print only
  • Available in
    PDF
  • Free industry update
    (Within 180 days)
  •   Free report update in next update cycle
    (Nov 2022 - Nov 2023)
  • Five Users
  • $6,929
  • Limited to five authorized users
  • Print upto five copies
  • Available in
    PDF
  • Free industry update
    (Within 180 days)
  •   Free report update in next update cycle
    (Nov 2022 - Nov 2023)
  • Enterprise
    License/PDF

  • $10,663
  • Unlimited
    within
    company/enterprise
  • Available in Excel & PDF
  • Free industry update
    (Within 180 days)
  •   Free report update in next update cycle
    (Nov 2022 - Nov 2023)
  • Library
    Membership

  • $999 $ 1,175
    Per User/ Per month/ Billed annually
  • Published Content
    E-access
  • Company Profiles
    E-access
  • Newly Added Content Access
  • 10 PDF
    Downloads
  • 5 Excel Data
    Pack Downloads
  • 250 Company Profiles PDF Downloads
  • Buy Now

*Taxes/Fees, if applicable will be added during checkout. All prices in USD

RELATED REPORTS
 

Why Allied Market Research?


Infallible Methodology

To ensure high-level data integrity, accurate analysis, and impeccable forecasts

Analyst Support

For complete satisfaction

Customization

On-demand customization of scope of the report to exactly meet your needs

TARGETED MARKET VIEW

Targeted market view to provide pertinent information and save time of readers

Get fresh content delivered

Get insights on topics that are crucial for your business. Stay abreast of your interest areas.

Get Industry Data Alerts

Why Allied Market Research?

Infallible Methodology

To ensure high-level data integrity, accurate analysis, and impeccable forecasts

Analyst Support

For complete satisfaction

Customization

On-demand customization of scope of the report to exactly meet your needs

TARGETED MARKET VIEW

Targeted market view to provide pertinent information and save time of readers