0
2016
Global Power Line Communication (plc) Systems Market

Global Power Line Communication (PLC) Systems Market

by Type (Narrowband PLC and Broadband PLC), Solution (PLC Over AC Lines and PLC Over DC Lines), Component (Coupling Capacitor, Line Trap Unit, Transmitters & Receivers, Line Tuners, and Others), and Application (Commercial, Residential, Automotive, Oil & Gas, Telecommunication, Power Distribution, and Healthcare) - Opportunity Analysis and Industry Forecast, 2014-2022

Report Code: A01460
Dec 2016 | Pages: 235
Tables: 49
Charts: 78
  • Formats*:

  • pdf

    Single User License, Five User
    License & Enterprise User License

  • xls

    Data Pack Excel License

  • ppt

    It comes with the additional cost
    of $2500.00 contact sales.


COVID-19

Pandemic disrupted the entire world and affected many industries.

Get detailed COVID-19 impact analysis on the Global Power Line Communication (plc) Systems Market

Request Now !

Power Line Communication (PLC) Systems Market Overview:

The global power line communication (PLC) systems market is anticipated to reach around $14 billion by 2022, growing at a CAGR of 18.4% from 2016 to 2022. Power line communications is a comparatively new area of telecommunication. It is a communication technology that allows transfer of data over existing power cables. Using the power line as a communication medium is also a cost-effective way as compared to other methods because it uses an existing infrastructure, and wires subsist to every household connected to the power line network. The potential implementation of PLC, with the main emphasis on Internet access, is being adopted in various European and Asian countries as well as in the U.S.

Increase in adoption of PLC in residential, commercial, and industrial sectors is due to cost-efficiency of PLC infrastructure as compared to traditional or competitive technologies. Therefore, the global PLC market is expected to witness moderate growth in the near future, owing to space efficiency and additional power circulation by this technology. However, dependency of the user for power and data over the same line increases the centralized risk factor and this could hamper the market growth. Proactive government initiatives to promote PLC and smart grids utilizing PLC are expected to provide lucrative opportunities to the market.

Segment Overview

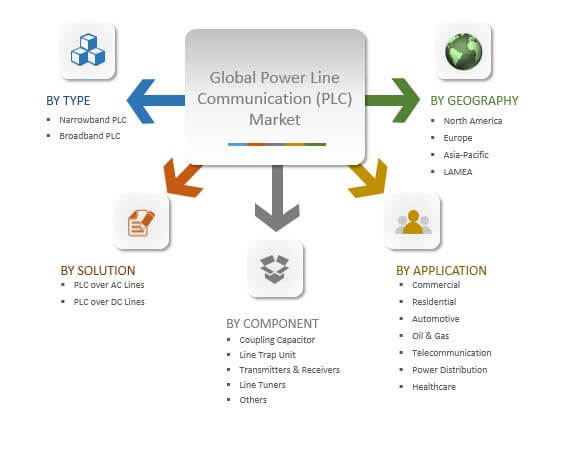
The global PLC systems market is segmented based on type, solution, component, application, and geography. The type segment is bifurcated into narrowband PLC and broadband PLC. In 2015, broadband PLC segment dominated the global market, in terms of revenue, and is expected to maintain this trend throughout the forecast period, owing to evasion from expense for maintaining a dedicated network of antennas, radios, and routers in a wireless network.

The solution segment is classified as PLC over AC lines and PLC over DC lines. The PLC over AC lines segment dominated the global market, in terms of revenue, and is expected to maintain this trend head as well. However, the PLC over DC lines is also witnessing rapid growth in home networking, lighting, and solar applications as well as in transportation vehicles.

Market Segmentation

Power Line Communication (PLC) Systems Market Segmentation

Geographical Scenario

Power Line Communication Systems Market Geographical Scenario

Competition Analysis

Comprehensive competitive analyses and profiles of major market players, including Cypress Semiconductor, ST Microelectronics, Texas Instruments, Maxim Integrated, Marvell, Qualcomm Atheros, Microchip, Sigma Designs, Inc., Broadcom Corporation, and Echelon Corporation are provided in this report. Currently, these players have adopted growth strategies such as product launch and acquisition. Companies, such as Broadcom Corporation and Qualcomm Atheros, have launched new power modules to expand their customer base and increase their market shares.

Top Impacting Factors

Power Line Communication Systems Market Top Impacting Factors

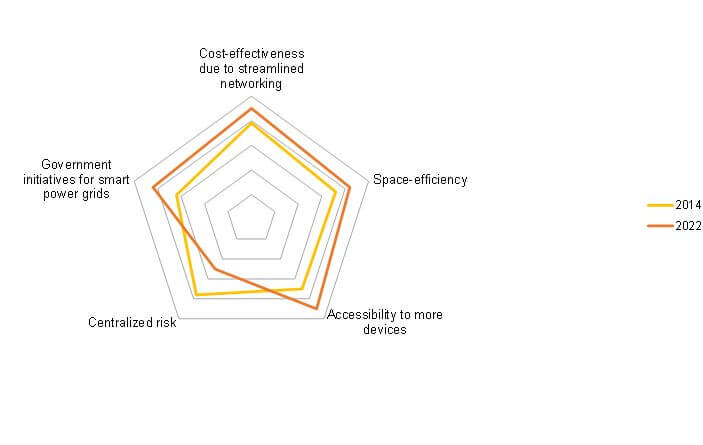
Cost-effectiveness due to streamlined networking

Rise in concerns regarding distribution issues and extra cost for setting up a data communication network have enforced various organizations to invest for improving the infrastructure of data networking techniques. PLC plays a crucial role in smart grids to control power distribution at high voltages and enhance efficiency. It can be a method of extending an existing network into new areas without adding new cables. Currently, U.S. possesses the most number of grids with smart grid capabilities, owing to the technological development in the region.

Centralized risk

PLC allows one to transmit and receive data by moving a controlled carrier signal over existing power lines. Interconnection has increased with the arrival of the Internet and new networking technologies like PLC. This collectively increases the risk of failure and security breaching in the system. Network security has become more important to personal computer users, organizations, and the military. However, technological developments would like to eradicate the effect of this factor in the near future.

 Buy this report from $2765 Global Power Line Communication (PLC) Systems Market

Key Benefits:

  • The study provides an in-depth analysis of the global power line communication systems market to elucidate the prominent investment pockets.
  • Current trends and future estimations are outlined to determine the overall market potential, and single out profitable trends to gain a stronger foothold in the market.
  • The report provides information regarding key drivers, restraints, and opportunities along with their impact analyses.
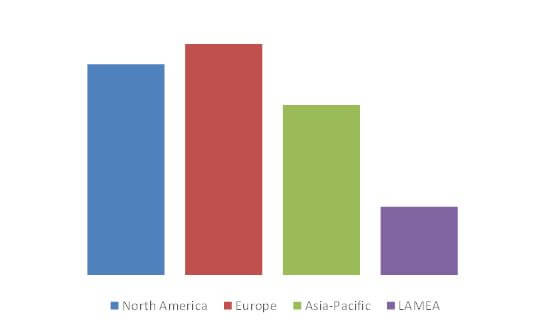
  • The market is analyzed based on various regions, namely, North America, Europe, Asia-Pacific, and LAMEA.

Global Power Line Communication (PLC) Systems Market Report Highlights

Aspects Details
By Type
  • Narrowband PLC
  • Broadband PLC
By Solution
  • PLC Over AC lines
  • PLC Over DC lines
By Component
  • Coupling Capacitor
  • Line Trap Unit
  • Transmitters & Receivers
  • Line Tuners
  • Others
By Application
  • Commercial
  • Residential
  • Automotive
  • Oil & Gas
  • Telecommunication
  • Power Distribution
  • Healthcare
By Geography
  • North America
    • U.S.
    • Mexico
    • Canada
  • Europe
    • UK
    • Germany
    • France
    • Rest of Europe
  • Asia-Pacific
    • China
    • Rest of Asia-Pacific
  • LAMEA
    • Latin America
    • Middle East
    • Africa
Key Market Players MAXIM INTEGRATED, TEXAS INSTRUMENTS INC., QUALCOMM ATHEROS INC., STMICROELECTRONICS, MARVELL, BROADCOM LIMITED, CYPRESS SEMICONDUCTOR CORPORATION, SIGMA DESIGNS, INC., ECHELON CORPORATION, MICROCHIP TECHNOLOGY INC.
 

CHAPTER 1 INTRODUCTION

1.1. REPORT DESCRIPTION
1.2. KEY MARKET SEGMENTS
1.3. RESEARCH METHODOLOGY

1.3.1. Secondary research
1.3.2. Primary research
1.3.3. Analyst tools and models

CHAPTER 2 EXECUTIVE SUMMARY

2.1. CXO PERSPECTIVE

CHAPTER 3 MARKET OVERVIEW

3.1. MARKET DEFINITION AND SCOPE
3.2. KEY FINDINGS

3.2.1. Top Impacting factors
3.2.2. Top winning strategies
3.2.3. Top investment pockets

3.3. PORTERS FIVE FORCES ANALYSIS

3.3.1. Bargaining power of suppliers
3.3.2. Bargaining power of buyers
3.3.3. Threat of substitutes
3.3.4. Threat of new entrants
3.3.5. Intensity of competitive rivalry

3.4. MARKET SHARE ANALYSIS, 2015
3.5. MARKET DYNAMICS

3.5.1. Drivers
3.5.2. Restraints
3.5.3. Opportunities

CHAPTER 4 GLOBAL POWER LINE COMMUNICATION SYSTEMS MARKET, BY TYPE

4.1. OVERVIEW

4.1.1. Market size and forecast

4.2. NARROWBAND PLC

4.2.1. Introduction
4.2.2. Key market trends, growth factors and opportunities
4.2.3. Key Players Positioning
4.2.3. Market size and forecast

4.3. BROADBAND PLC

4.3.1. Introduction
4.3.2. Key market trends, growth factors and opportunities
4.3.3. Key Players Positioning
4.3.3. Market size and forecast

CHAPTER 5 GLOBAL POWER LINE COMMUNICATION SYSTEMS MARKET, BY SOLUTION

5.1. OVERVIEW

5.1.1. Market size and forecast

5.2. PLC OVER AC LINES

5.2.1. Introduction
5.2.2. Key market trends, growth factors and opportunities
5.2.3. Market size and forecast

5.3. PLC OVER DC LINES

5.3.1. Introduction
5.3.2. Key market trends, growth factors and opportunities
5.3.3. Market size and forecast

CHAPTER 6 GLOBAL POWER LINE COMMUNICATION SYSTEMS MARKET, BY COMPONENT

6.1. OVERVIEW

6.1.1. Market size and forecast

6.2. COUPLING CAPACITOR

6.2.1. Introduction
6.2.2. Key market trends, growth factors and opportunities
6.2.3. Market size and forecast

6.3. LINE TRAP UNIT

6.3.1. Introduction
6.3.2. Key market trends, growth factors and opportunities
6.3.3. Market size and forecast

6.4. TRANSMITTERS & RECEIVERS

6.4.1. Introduction
6.4.2. Key market trends, growth factors and opportunities
6.4.3. Market size and forecast

6.5. LINE TUNERS

6.5.1. Introduction
6.5.2. Key market trends, growth factors and opportunities
6.5.3. Market size and forecast

6.6. OTHERS

6.6.1. Introduction
6.6.2. Key market trends, growth factors and opportunities
6.6.3. Market size and forecast

CHAPTER 7 GLOBAL POWER LINE COMMUNICATION SYSTEMS MARKET, BY APPLICATION

7.1. OVERVIEW

7.1.1. Market size and forecast

7.2. COMMERCIAL

7.2.1. Introduction
7.2.2. Key market trends, growth factors and opportunities
7.2.3. Market size and forecast

7.3. RESIDENTIAL

7.3.1. Introduction
7.3.2. Key market trends, growth factors and opportunities
7.3.3. Market size and forecast

7.4. AUTOMOTIVE

7.4.1. Introduction
7.4.2. Key market trends, growth factors and opportunities
7.4.3. Market size and forecast

7.5. OIL & GAS

7.5.1. Introduction
7.5.2. Key market trends, growth factors and opportunities
7.5.3. Market size and forecast

7.6. TELECOMMUNICATION

7.6.1. Introduction
7.6.2. Key market trends, growth factors and opportunities
7.6.3. Market size and forecast

7.7. POWER DISTRIBUTION

7.7.1. Introduction
7.7.2. Key market trends, growth factors and opportunities
7.7.3. Market size and forecast

7.8. HEALTHCARE

7.8.1. Introduction
7.8.2. Key market trends, growth factors and opportunities
7.8.3. Market size and forecast

CHAPTER 8 GLOBAL POWER LINE COMMUNICATION SYSTEMS MARKET, BY GEOGRAPHY

8.1. OVERVIEW

8.1.1. Market size and forecast

8.2. NORTH AMERICA

8.2.1. Key market trends
8.2.2. Growth factors and opportunities
8.2.3. Market size and forecast
8.2.4. U.S.

8.2.4.1. Market size and forecast

8.2.5. Canada

8.2.5.1. Market size and forecast

8.2.6. Mexico

8.2.6.1. Market size and forecast

8.3. EUROPE

8.3.1. Key market trends
8.3.2. Growth factors and opportunities
8.3.3. Market size and forecast
8.3.4. UK

8.3.4.1. Market size and forecast

8.3.5. Germany

8.3.5.1. Market size and forecast

8.3.6. France

8.3.6.1. Market size and forecast

8.3.7. Rest of Europe

8.3.7.1. Market size and forecast

8.4 ASIA-PACIFIC

8.4.1. Key market trends
8.4.2. Growth factors and opportunities
8.4.3. Market size and forecast
8.4.4. China

8.4.4.1. Marke  forecast

8.4.8. Rest of Asia-Pacific

8.4.8.1. Market size and forecast

8.5. LAMEA

8.5.1. Key market trends
8.5.2. Growth factors and opportunities
8.5.3. Market size and forecast
8.5.4. Latin America

8.5.4.1. Market size and forecast

8.5.5. Middle East

8.5.5.1. Market size and forecast

8.5.6. Africa

8.5.6.1. Market size and forecast

CHAPTER 9 RELATED INDUSTRY INSIGHTS

CHAPTER 10 COMPANY PROFILES

10.1. CYPRESS SEMICONDUCTOR CORPORATION

10.1.1. Company overview
10.1.2. Operating business segments
10.1.3. Business performance
10.1.4. Key strategic moves and developments

10.2. STMICROELECTRONICS

10.2.1. Company overview
10.2.2. Operating business segments
10.2.3. Business performance
10.2.4. Key strategic moves and developments

10.3. TEXAS INSTRUMENTS INC.

10.3.1. Company overview
10.3.2. Operating business segments
10.3.3. Business performance
10.3.4. Key strategic moves and developments

10.4. MAXIM INTEGRATED

10.4.1. Company overview
10.4.2. Business performance
10.4.3. Key strategic moves and developments

10.5. MARVELL

10.5.1. Company overview
10.5.2. Operating business segments
10.5.3. Business performance
10.5.4. Key strategic moves and developments

10.6. QUALCOMM ATHEROS INC.

10.6.1. Company overview
10.6.2. Operating business segments
10.6.3. Business performance
10.6.4. Key strategic moves and developments

10.7. MICROCHIP TECHNOLOGY INC.

10.7.1. Company overview
10.7.2. Operating business segments
10.7.3. Business performance
10.7.4. Key strategic moves and developments

10.8. SIGMA DESIGNS, INC.

10.8.1. Company overview
10.8.2. Business performance
10.8.3. Key strategic moves and developments

10.9. BROADCOM LIMITED

10.9.1. Company overview
10.9.2. Key strategic moves and developments

10.10. ECHELON CORPORATION

10.10.1. Company overview
10.10.2. Business performance
10.10.3. Key strategic moves and developments

LIST OF TABLES

TABLE 1. GLOBAL POWER LINE COMMUNICATION SYSTEMS MARKET, BY TYPE, 20142022 ($MILLION)
TABLE 2. GLOBAL NARROWBAND PLC MARKET, BY GEOGRAPHY, 20142022 ($MILLION)
TABLE 3. GLOBAL BROADBAND PLC MARKET, BY GEOGRAPHY, 20142022 ($MILLION)
TABLE 4. GLOBAL POWER LINE COMMUNICATION SYSTEMS MARKET, BY SOLUTION, 20142022 ($MILLION)
TABLE 5. GLOBAL PLC OVER AC LINES MARKET, BY GEOGRAPHY, 20142022 ($MILLION)
TABLE 6. GLOBAL PLC OVER DC LINES MARKET, BY GEOGRAPHY, 20142022 ($MILLION)
TABLE 7. GLOBAL POWER LINE COMMUNICATION SYSTEMS MARKET, BY COMPONENT, 20142022 ($MILLION)
TABLE 8. GLOBAL COUPLING CAPACITOR MARKET, BY GEOGRAPHY, 20142022 ($MILLION)
TABLE 9. GLOBAL LINE TRAP UNIT MARKET, BY GEOGRAPHY, 20142022 ($MILLION)
TABLE 10. GLOBAL TRANSMITTERS & RECEIVERS MARKET, BY GEOGRAPHY, 20142022 ($MILLION)
TABLE 11. GLOBAL LINE TUNERS MARKET, BY GEOGRAPHY, 20142022 ($MILLION)
TABLE 12. GLOBAL OTHERS MARKET, BY GEOGRAPHY, 20142022 ($MILLION)
TABLE 13. GLOBAL POWER LINE COMMUNICATION SYSTEMS MARKET, BY APPLICATION, 20142022 ($MILLION)
TABLE 14. GLOBAL COMMERCIAL POWER LINE COMMUNICATION SYSTEMS MARKET, BY GEOGRAPHY, 20142022 ($MILLION)
TABLE 15. GLOBAL RESIDENTIAL POWER LINE COMMUNICATION SYSTEMS MARKET, BY GEOGRAPHY, 20142022 ($MILLION)
TABLE 16. GLOBAL AUTOMOTIVE POWER LINE COMMUNICATION SYSTEMS MARKET, BY GEOGRAPHY, 20142022 ($MILLION)
TABLE 17. GLOBAL OIL & GAS POWER LINE COMMUNICATION SYSTEMS MARKET, BY GEOGRAPHY, 20142022 ($MILLION)
TABLE 18. GLOBAL TELECOMMUNICATION POWER LINE COMMUNICATION SYSTEMS MARKET, BY GEOGRAPHY, 20142022 ($MILLION)
TABLE 19. GLOBAL POWER DISTRIBUTION POWER LINE COMMUNICATION SYSTEMS MARKET, BY GEOGRAPHY, 20142022 ($MILLION)
TABLE 20. GLOBAL HEALTHCARE POWER LINE COMMUNICATION SYSTEMS MARKET, BY GEOGRAPHY, 20142022 ($MILLION)
TABLE 21. GLOBAL POWER LINE COMMUNICATION SYSTEMS MARKET, BY GEOGRAPHY, 20142022 ($MILLION)
TABLE 22. NORTH AMERICA: POWER LINE COMMUNICATION SYSTEMS MARKET, BY TYPE, 20142022 ($MILLION)
TABLE 23. NORTH AMERICA: POWER LINE COMMUNICATION SYSTEMS MARKET, BY APPLICATION, 20142022 ($MILLION)
TABLE 24. NORTH AMERICA: POWER LINE COMMUNICATION SYSTEMS MARKET, BY COUNTRY, 20142022 ($MILLION)
TABLE 25. EUROPE: POWER LINE COMMUNICATION SYSTEMS MARKET, BY TYPE, 20142022 ($MILLION)
TABLE 26. EUROPE: POWER LINE COMMUNICATION SYSTEMS MARKET, BY APPLICATION, 20142022 ($MILLION)
TABLE 27. EUROPE: POWER LINE COMMUNICATION SYSTEMS MARKET, BY COUNTRY, 20142022 ($MILLION)
TABLE 28. ASIA-PACIFIC: POWER LINE COMMUNICATION SYSTEMS MARKET, BY TYPE, 20142022 ($MILLION)
TABLE 29. ASIA-PACIFIC: POWER LINE COMMUNICATION SYSTEMS MARKET, BY APPLICATION, 20142022 ($MILLION)
TABLE 30. ASIA-PACIFIC: POWER LINE COMMUNICATION SYSTEMS MARKET, BY COUNTRY, 20142022 ($MILLION)
TABLE 31. LAMEA: POWER LINE COMMUNICATION SYSTEMS MARKET, BY TYPE, 20142022 ($MILLION)
TABLE 32. LAMEA: POWER LINE COMMUNICATION SYSTEMS MARKET, BY APPLICATION, 20142022 ($MILLION)
TABLE 33. LAMEA: POWER LINE COMMUNICATION SYSTEMS MARKET, BY COUNTRY, 20142022 ($MILLION)
TABLE 34. CYPRESS SEMICONDUCTOR CORPORATION:COMPANY SNAPSHOT
TABLE 35. CYPRESS SEMICONDUCTOR CORPORATION: OPERATING SEGMENTS
TABLE 36. STMICROELECTRONICS: COMPANY SNAPSHOT
TABLE 37. STMICROELECTRONICS: OPERATING SEGMENTS
TABLE 38. TEXAS INSTRUMENTS INC.: COMPANY SNAPSHOT
TABLE 39. TEXAS INSTRUMENTS INC.: OPERATING SEGMENTS
TABLE 40. MAXIM INTEGRATED: COMPANY SNAPSHOT
TABLE 41. MARVELL: COMPANY SNAPSHOT
TABLE 42. MARVELL: OPERATING SEGMENTS
TABLE 43. QUALCOMM ATHEROS INC.: COMPANY SNAPSHOT
TABLE 44. QUALCOMM ATHEROS INC.: OPERATING SEGMENTS
TABLE 45. MICROCHIP TECHNOLOGY INC.: COMPANY SNAPSHOT
TABLE 46. MICROCHIP TECHNOLOGY INC.: OPERATING SEGMENTS
TABLE 47. SIGMA DESIGNS, INC.: COMPANY SNAPSHOT
TABLE 48. BROADCOM LIMITED: COMPANY SNAPSHOT
TABLE 49. ECHELON CORPORATION: COMPANY SNAPSHOT

LIST OF FIGURES

FIGURE 1. SEGMENTATIONS
FIGURE 2. TOP IMPACTING FACTORS
FIGURE 3. TOP WINNING STRATEGIES: PERCENTAGE DISTRIBUTION (20132016)
FIGURE 4. TOP INVESTMENT POCKETS IN GLOBAL POWER LINE COMMUNICATION (PLC) SYSTEMS MARKET, BY APPLICATION
FIGURE 5. PORTERS FIVE FORCES ANALYSIS
FIGURE 6. MARKET SHARE ANALYSIS, 2015
FIGURE 7. COMPARATIVE REGIONAL MARKET SHARE ANALYSIS OF GLOBAL NARROWBAND PLC MARKET, 2015 & 2022 (%)
FIGURE 8. MARKET REVENUE & FORECAST OF GLOBAL NARROWBAND PLC MARKET, 20142022 ($MILLION)
FIGURE 9. GLOBAL NARROWBAND PLC MARKET ANALYSIS, 2015 & 2022
FIGURE 10. COMPARATIVE REGIONAL MARKET SHARE ANALYSIS OF GLOBAL BROADBAND PLC MARKET, 2015 & 2022 (%)
FIGURE 11. MARKET REVENUE & FORECAST OF GLOBAL BROADBAND PLC MARKET, 20142022 ($MILLION)
FIGURE 12. GLOBAL BROADBAND PLC MARKET ANALYSIS, 2015 & 2022
FIGURE 13. COMPARATIVE REGIONAL MARKET SHARE ANALYSIS OF GLOBAL PLC OVER AC LINES MARKET, 2015 & 2022 (%)
FIGURE 14. MARKET REVENUE & FORECAST OF GLOBAL PLC OVER AC LINES MARKET, 20142022 ($MILLION)
FIGURE 15. GLOBAL PLC OVER AC LINES MARKET ANALYSIS, 2015 & 2022
FIGURE 16. COMPARATIVE REGIONAL MARKET SHARE ANALYSIS OF GLOBAL PLC OVER DC LINES MARKET, 2015 & 2022 (%)
FIGURE 17. MARKET REVENUE & FORECAST OF GLOBAL PLC OVER DC LINES MARKET, 20142022 ($MILLION)
FIGURE 18. GLOBAL PLC OVER DC LINES MARKET ANALYSIS, 2015 & 2022
FIGURE 19. COMPARATIVE REGIONAL MARKET SHARE ANALYSIS OF GLOBAL COUPLING CAPACITOR MARKET, 2015 & 2022 (%)
FIGURE 20. MARKET REVENUE & FORECAST OF GLOBAL COUPLING CAPACITOR MARKET, 20142022 ($MILLION)
FIGURE 21. GLOBAL COUPLING CAPACITOR MARKET ANALYSIS, 2015 & 2022
FIGURE 22. COMPARATIVE REGIONAL MARKET SHARE ANALYSIS OF GLOBAL LINE TRAP UNIT MARKET, 2015 & 2022 (%)
FIGURE 23. MARKET REVENUE & FORECAST OF GLOBAL LINE TRAP UNIT MARKET, 20142022 ($MILLION)
FIGURE 24. GLOBAL LINE TRAP UNIT MARKET ANALYSIS, 2015 & 2022
FIGURE 25. COMPARATIVE REGIONAL MARKET SHARE ANALYSIS OF GLOBAL TRANSMITTERS & RECEIVERS MARKET, 2015 & 2022 (%)
FIGURE 26. MARKET REVENUE & FORECAST OF GLOBAL TRANSMITTERS & RECEIVERS MARKET, 20142022 ($MILLION)
FIGURE 27. GLOBAL TRANSMITTERS & RECEIVERS MARKET ANALYSIS, 2015 & 2022
FIGURE 28. COMPARATIVE REGIONAL MARKET SHARE ANALYSIS OF GLOBAL LINE TUNERS MARKET, 2015 & 2022 (%)
FIGURE 29. MARKET REVENUE & FORECAST OF GLOBAL LINE TUNERS MARKET, 20142022 ($MILLION)
FIGURE 30. GLOBAL LINE TUNERS MARKET ANALYSIS, 2015 & 2022
FIGURE 31. COMPARATIVE REGIONAL MARKET SHARE ANALYSIS OF GLOBAL OTHERS MARKET, 2015 & 2022 (%)
FIGURE 32. MARKET REVENUE & FORECAST OF GLOBAL OTHERS MARKET, 20142022 ($MILLION)
FIGURE 33. GLOBAL OTHERS MARKET ANALYSIS, 2015 & 2022
FIGURE 34. COMPARATIVE REGIONAL MARKET SHARE ANALYSIS OF GLOBAL COMMERCIAL POWER LINE COMMUNICATION SYSTEMS MARKET, 2015 & 2022 (%)
FIGURE 35. MARKET REVENUE & FORECAST OF GLOBAL COMMERCIAL POWER LINE COMMUNICATION SYSTEMS MARKET, 20142022 ($MILLION)
FIGURE 36. GLOBAL COMMERCIAL POWER LINE COMMUNICATION SYSTEMS MARKET ANALYSIS, 2015 & 2022
FIGURE 37. COMPARATIVE REGIONAL MARKET SHARE ANALYSIS OF GLOBAL RESIDENTIAL POWER LINE COMMUNICATION SYSTEMS MARKET, 2015 & 2022 (%)
FIGURE 38. MARKET REVENUE & FORECAST OF GLOBAL RESIDENTIAL POWER LINE COMMUNICATION SYSTEMS MARKET, 20142022 ($MILLION)
FIGURE 39. GLOBAL RESIDENTIAL POWER LINE COMMUNICATION SYSTEMS MARKET ANALYSIS, 2015 & 2022
FIGURE 40. COMPARATIVE REGIONAL MARKET SHARE ANALYSIS OF GLOBAL AUTOMOTIVE POWER LINE COMMUNICATION SYSTEMS MARKET, 2015 & 2022 (%)
FIGURE 41. MARKET REVENUE & FORECAST OF GLOBAL AUTOMOTIVE POWER LINE COMMUNICATION SYSTEMS MARKET, 20142022 ($MILLION)
FIGURE 42. GLOBAL AUTOMOTIVE POWER LINE COMMUNICATION SYSTEMS MARKET ANALYSIS, 2015 & 2022
FIGURE 43. COMPARATIVE REGIONAL MARKET SHARE ANALYSIS OF GLOBAL OIL & GAS POWER LINE COMMUNICATION SYSTEMS MARKET, 2015 & 2022 (%)
FIGURE 44. MARKET REVENUE & FORECAST OF GLOBAL OIL & GAS POWER LINE COMMUNICATION SYSTEMS MARKET, 20142022 ($MILLION)
FIGURE 45. GLOBAL OIL & GAS POWER LINE COMMUNICATION SYSTEMS MARKET ANALYSIS, 2015 & 2022
FIGURE 46. COMPARATIVE REGIONAL MARKET SHARE ANALYSIS OF GLOBAL TELECOMMUNICATION POWER LINE COMMUNICATION SYSTEMS MARKET, 2015 & 2022 (%)
FIGURE 47. MARKET REVENUE & FORECAST OF GLOBAL TELECOMMUNICATION POWER LINE COMMUNICATION SYSTEMS MARKET, 20142022 ($MILLION)
FIGURE 48. GLOBAL TELECOMMUNICATION POWER LINE COMMUNICATION SYSTEMS MARKET ANALYSIS, 2015 & 2022
FIGURE 49. COMPARATIVE REGIONAL MARKET SHARE ANALYSIS OF GLOBAL POWER DISTRIBUTION POWER LINE COMMUNICATION SYSTEMS MARKET, 2015 & 2022 (%)
FIGURE 50. MARKET REVENUE & FORECAST OF GLOBAL POWER DISTRIBUTION POWER LINE COMMUNICATION SYSTEMS MARKET, 20142022 ($MILLION)
FIGURE 51. GLOBAL POWER DISTRIBUTION POWER LINE COMMUNICATION SYSTEMS MARKET ANALYSIS, 2015 & 2022
FIGURE 52. COMPARATIVE REGIONAL MARKET SHARE ANALYSIS OF GLOBAL HEALTHCARE POWER LINE COMMUNICATION SYSTEMS MARKET, 2015 & 2022 (%)
FIGURE 53. MARKET REVENUE & FORECAST OF GLOBAL HEALTHCARE POWER LINE COMMUNICATION SYSTEMS MARKET, 20142022 ($MILLION)
FIGURE 54. GLOBAL HEALTHCARE POWER LINE COMMUNICATION SYSTEMS MARKET ANALYSIS, 2015 & 2022
FIGURE 55. U.S.: POWER LINE COMMUNICATION SYSTEMS MARKET SIZE, 20142022 ($MILLION)
FIGURE 56. CANADA: POWER LINE COMMUNICATION SYSTEMS MARKET SIZE, 20142022 ($MILLION)
FIGURE 57. MEXICO: POWER LINE COMMUNICATION SYSTEMS MARKET SIZE, 20142022 ($MILLION)
FIGURE 58. UK: POWER LINE COMMUNICATION SYSTEMS MARKET SIZE, 20142022 ($MILLION)
FIGURE 59. GERMANY: POWER LINE COMMUNICATION SYSTEMS MARKET SIZE, 20142022 ($MILLION)
FIGURE 60. FRANCE: POWER LINE COMMUNICATION SYSTEMS MARKET SIZE, 20142022 ($MILLION)
FIGURE 61. REST OF EUROPE: POWER LINE COMMUNICATION SYSTEMS MARKET SIZE, 20142022 ($MILLION)
FIGURE 62. CHINA: POWER LINE COMMUNICATION SYSTEMS MARKET SIZE, 20142022 ($MILLION)
FIGURE 63. JAPAN: POWER LINE COMMUNICATION SYSTEMS MARKET SIZE, 20142022 ($MILLION)
FIGURE 64. INDIA: POWER LINE COMMUNICATION SYSTEMS MARKET SIZE, 20142022 ($MILLION)
FIGURE 65. SOUTH KOREA: POWER LINE COMMUNICATION SYSTEMS MARKET SIZE, 20142022 ($MILLION)
FIGURE 66. REST OF ASIA-PACIFIC: POWER LINE COMMUNICATION SYSTEMS MARKET SIZE, 20142022 ($MILLION)
FIGURE 67. LATIN AMERICA: POWER LINE COMMUNICATION SYSTEMS MARKET SIZE, 20142022 ($MILLION)
FIGURE 68. MIDDLE EAST: POWER LINE COMMUNICATION SYSTEMS MARKET SIZE, 20142022 ($MILLION)
FIGURE 69. AFRICA: POWER LINE COMMUNICATION SYSTEMS MARKET SIZE, 20142022 ($MILLION)
FIGURE 70. CYPRESS SEMICONDUCTOR CORPORATION: COMPANY SNAPSHOT
FIGURE 71. STMICROELECTRONICS: COMPANY SNAPSHOT
FIGURE 72. TEXAS INSTRUMENTS INC.: COMPANY SNAPSHOT
FIGURE 73. MAXIM INTEGRATED: COMPANY SNAPSHOT
FIGURE 74. MARVELL: COMPANY SNAPSHOT
FIGURE 75. QUALCOMM ATHEROS INC.: COMPANY SNAPSHOT
FIGURE 76. MICROCHIP TECHNOLOGY INC.: COMPANY SNAPSHOT
FIGURE 77. SIGMA DESIGNS, INC.: COMPANY SNAPSHOT
FIGURE 78. ECHELON CORPORATION: COMPANY SNAPSHOT


The global power line communication (PLC) systems market is expected to witness significant growth in the near future owing to increase in need for power management technologies. Earlier, PLC was used in medium- and low-voltage application industries; however, other industries, such as heavy industries, energy & power, oil & gas, and automotive, have adopted it to efficiently manage power, owing to the advent of advanced technology and increase in awareness about the benefits of PLC. Market players focus on developing innovative products for applications in smart grids and healthcare sector to enhance their efficiency. It enables power management to improve energy efficiency and prevent power loss. Low power consumption and intense competition in the market have enforced industries to adopt PLC technology, which has stimulated the market growth.

PLC has the ability of proposing the data rate, performance, flexibility, consistency, and cost-efficiency required to support whole-home multimedia networking. As transmissions are sent over a wired medium, lower latencies can be attained benefiting real-time streaming applications such as VoIP and IPTV and interactive services. However, prominent players have developed low-cost, compact, affordable, and energy-efficient PLC systems to increase the efficiency of the applications. Proactive government initiatives to establish high-voltage direct current (HVDC) and smart grid provide growth opportunities to market players. Public and private organizations have substantially invested in R&D activities to develop technologies and applications for PLC. Europe is the major revenue contributor to the global market, followed by North America. It is projected that the market growth in Asia-Pacific and LAMEA is expected to significantly increase during the forecast period.

PURCHASE OPTIONS

Call or Email us

U.S.-Canada Toll-free: +1-800-792-5285
Int'l : +1-503-894-6022
Europe : +44-845-528-1300
Email : help@alliedmarketresearch.com

Looking for Customization?

 Customization Request

Have a Question?

 Speak with Analyst

Any Confusion?

 Inquire Before Buying

Have a glance of the Report

  Request Sample

Purchase Full Report of
Global Power Line Communication (plc) Systems Market

Start reading instantly.
This Report and over 66,965+ more Reports, Available with Avenue Library. T&C*.

  • Online Only
  • $3,217
  • Online cloud access only
  • Restricted print, copy, paste & download
  • Read only
  • Free industry update
    (Within 180 days)
  • Free report update in next update cycle
    (Dec 2017 - Dec 2018)
  • Data Pack
  • $3,574
  • Restricted to one authorized user
  • One print only
  • Available in
    Excel
  • Free industry update
    (Within 180 days)
  •   Free report update in next update cycle
    (Dec 2017 - Dec 2018)
  • Single User
  • $4,999
  • Restricted to one authorized user
  • One print only
  • Available in
    PDF
  • Free industry update
    (Within 180 days)
  •   Free report update in next update cycle
    (Dec 2017 - Dec 2018)
  • Five Users
  • $6,004
  • Limited to five authorized users
  • Print upto five copies
  • Available in
    PDF
  • Free industry update
    (Within 180 days)
  •   Free report update in next update cycle
    (Dec 2017 - Dec 2018)
  • Enterprise
    License/PDF

  • $9,373
  • Unlimited
    within
    company/enterprise
  • Available in Excel & PDF
  • Free industry update
    (Within 180 days)
  •   Free report update in next update cycle
    (Dec 2017 - Dec 2018)
  • Library
    Membership

  • $999 $ 1,175
    Per User/ Per month/ Billed annually
  • Published Content
    E-access
  • Company Profiles
    E-access
  • Newly Added Content Access
  • 10 PDF
    Downloads
  • 5 Excel Data
    Pack Downloads
  • 250 Company Profiles PDF Downloads
  • Buy Now

*Taxes/Fees, if applicable will be added during checkout. All prices in USD

RELATED REPORTS
 

Why Allied Market Research?


Infallible Methodology

To ensure high-level data integrity, accurate analysis, and impeccable forecasts

Analyst Support

For complete satisfaction

Customization

On-demand customization of scope of the report to exactly meet your needs

TARGETED MARKET VIEW

Targeted market view to provide pertinent information and save time of readers

Get fresh content delivered

Get insights on topics that are crucial for your business. Stay abreast of your interest areas.

Get Industry Data Alerts

Why Allied Market Research?

Infallible Methodology

To ensure high-level data integrity, accurate analysis, and impeccable forecasts

Analyst Support

For complete satisfaction

Customization

On-demand customization of scope of the report to exactly meet your needs

TARGETED MARKET VIEW

Targeted market view to provide pertinent information and save time of readers