Report Code: A00093 | Apr 2020 | Pages: 165 | ||
Tables: 69 | Charts: 42 |
|
Pandemic disrupted the entire world and affected many industries.
Get detailed COVID-19 impact analysis on the Power Transformer Market
Request Now !
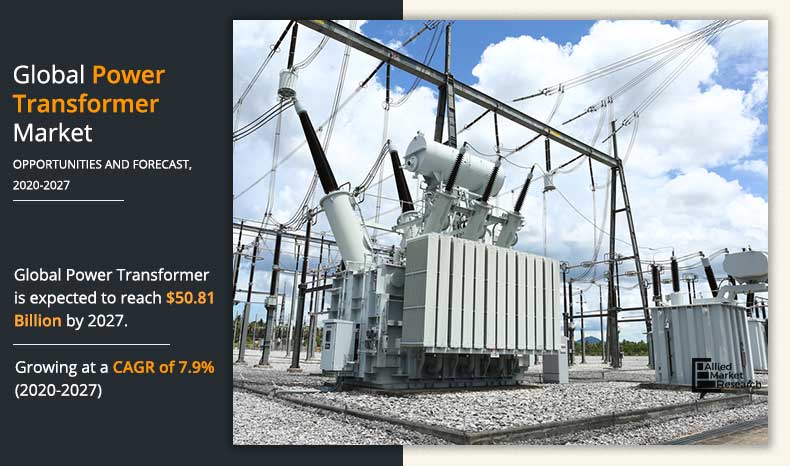
The global power transformer market size was valued at $27.7 billion in 2019, and is expected to reach $50.8 billion by 2027, registering a CAGR of 7.9% from 2020 to 2027. Power transformer is a type of transformer used primarily to receive low voltage generator electric power and transmit it across distribution channels across the power grid network. It forms a crucial part of the power grid and helps in transmission of power from one network to the other without change in frequency. Generation of electric power in low voltage is cost effective, but it leads to high line current. The transmission of high current leads to more line losses. But if the voltage of the incoming power is increased then efficient power transmission is enabled. Hence, a power transformer is mainly used to step-up the voltage. Power transformers thus play a vital role in power transmission. These transformers operate at peak load and are designed to have maximum efficiency at full load. Decades of research in the transmission networks has led to an increase in the transmission voltages. Power transformers enable the power transmission low-voltage to high-voltages.
Various factors drive the global power transformer market. Apart from the growing consumption of electricity, the increasing focus on renewable electric power generation, deployment of smart grids and smart transformers, replacement of existing aged power transformers are some other factors responsible for the global power transformer market growth. As power sector is the key indicator of economic growth, countries are investing in strengthening their power infrastructure and meeting the growing demand for electricity. Investments include new power grid projects that integrate electric power generated through renewable sources to the main power grid. Increase in renewable power generation such as hydro, wind, and solar are prominent drivers for the global market of power transformer.
Power transformers are necessary devices, which help connect generating stations to transmission networks. It is anticipated that increase in utilization of renewable and non-conventional energy resources will drive the global power transformer market in the forecast period. Power transformers form a critical part of a power grid. With the increase in awareness related to CO2 emissions, the adoption of smart grids is expected to grow. Smart grid facilitates the remote access monitoring of grid instruments and respond to fluctuating power demand instantly. Smart power transformers are increasingly being used due to their advantages. It gives optimized power supply, responds to voltage fluctuations quickly, offers efficient cooling, and is energy efficient; thus, it reduces CO2 emissions. Stringent government regulations related to carbon emissions are expected to remain strict throughout the analysis period, thereby supporting the growth of the global power transformer market. Increase in demand for electricity and emergence of renewable power sources increases the adoption of high voltage transmission technologies such as UHV, HVAC and HVDC power transformers. Utilization of ultra-high-voltage transmission technology is already being used in many countries such as China.
Price is the most significant factor that affects the whole power system throughout the world. Manufacturing of power transformers requires longer construction time as well as huge capital investment. Also, high quality electrical grade steel is manufactured by only selected few companies. Moreover, constructing the supporting infrastructures needed for stable and life-long transformer operation makes power transformers expensive and unaffordable. However, overall cost of transformers can be reduced with better supervision techniques and use of better materials. This also improves their overall life expectancy. On the contrary, meeting future electricity demands requires the setup of more high voltage transmission networks. Further, the technologies concerning power transformers are dynamic. Such factors will be conducive to the replacement of aging transformers with modernized versions.
Global power transformer market is segmented based on transformer rating and region. Based on rating, the market is divided in low, medium, and high rating power transformers. Based on geography, it is divided into North America, Europe, Asia-Pacific, and LAMEA. Region wise, the market is analyzed across North America, Europe, Asia-Pacific, and LAMEA.
Major players in the power transformer industry include Bharat Heavy Electricals Ltd., CG Power and Industrial Solutions Ltd., EMCO Ltd., General Electric Company, Hitachi Ltd., Kirloskar Electric Co. Ltd., Schneider Electric SE, Siemens AG, TBEA Co. Ltd., and Toshiba Corporation.
Asia-Pacific accounted for a major revenue share in 2019 in the global power transformer market, owing to upcoming power grid expansion projects and upsurge in renewable power generation.
The medium power transformer segment garnered the largest power transformer market share of 45.85% in 2019 and is expected to increase to 48.45% in 2027, growing at a CAGR of 8.7%. The growth is mainly attributed to surge in electrification globally, mainly by industries that need stable electric power.
Key Benefits For Stakeholders
Power Transformer Market Report Highlights
Aspects | Details |
---|---|
By Rating |
|
By Region |
|
Key Market Players | TBEA Co. Ltd., Toshiba Corporation, CG Power and Industrial Solutions Ltd., Bharat Heavy Electricals Ltd., Siemens AG, Kirloskar Electric Co. Ltd., Hitachi Ltd., General Electric Company, Schneider Electric SE, EMCO Ltd. |
CHAPTER1: INTRODUCTION
1.1.Report description
1.1.1.Key benefits for stakeholders
1.2.Key market segments
1.3.Research methodology
1.3.1.Primary research
1.3.2.Secondary research
1.3.3.Analyst tools and models
CHAPTER 2:EXECUTIVE SUMMARY
2.1.CXO Perspective
CHAPTER 3:MARKET LANDSCAPE
3.1.Market definition and scope
3.2.Key findings
3.2.1.Top investment pockets
3.2.2.Porter's five forces analysis
3.3.Market Dynamics
3.3.1.Drivers
3.3.1.1.Increasing demand for electricity throughout the world
3.3.1.2.Replacement of existing transmission networks
3.3.1.3.Increasing adoption of smart grids
3.3.2.Restraint
3.3.2.1.High installation, logistics and supporting infrastructure cost of transformer
3.3.3.Opportunities
3.3.3.1.Increasing use of renewable and non-conventional energy sources
CHAPTER 4:POWER TRANSFORMER MARKET, BY RATING
4.1.Overview
4.1.1.Market size and forecast
4.2.Low (5 MVA to 100 MVA)
4.2.1.Key market trends, growth factors, and opportunities
4.2.2.Market size and forecast, by region
4.3.Medium (100MVA to 500 MVA)
4.3.1.Key market trends, growth factors, and opportunities
4.3.2.Market size and forecast, by region
4.4.High (above 500 MVA)
4.4.1.Key market trends, growth factors, and opportunities
4.4.2.Market size and forecast, by region
CHAPTER 5:POWER TRANSFORMER MARKET, BY REGION
5.1.Overview
5.1.1.Market size and forecast
5.2.North America
5.2.1.Key market trends, growth factors, and opportunities
5.2.2.Market size and forecast, by rating
5.2.3.Market share analysis, by country
5.2.4.U.S.
5.2.4.1.Market size and forecast, by rating
5.2.5.CANADA
5.2.5.1.Market size and forecast, by rating
5.2.6.MEXICO
5.2.6.1.Market size and forecast, by rating
5.3.Europe
5.3.1.Key market trends, growth factors, and opportunities
5.3.2.Market size and forecast, by rating
5.3.3.Market share analysis, by country
5.3.4.RUSSIA
5.3.4.1.Market size and forecast, by rating
5.3.5.GERMANY
5.3.5.1.Market size and forecast, by rating
5.3.6.FRANCE
5.3.6.1.Market size and forecast, by rating
5.3.7.UK
5.3.7.1.Market size and forecast, by rating
5.3.8.ITALY
5.3.8.1.Market size and forecast, by rating
5.3.9.REST OF EUROPE
5.3.9.1.Market size and forecast, by rating
5.4.Asia-Pacific
5.4.1.Key market trends, growth factors, and opportunities
5.4.2.Market size and forecast, by rating
5.4.3.Market share analysis, by country
5.4.4.CHINA
5.4.4.1.Market size and forecast, by rating
5.4.5.INDIA
5.4.5.1.Market size and forecast, by rating
5.4.6.JAPAN
5.4.6.1.Market size and forecast, by rating
5.4.7.AUSTRALIA
5.4.7.1.Market size and forecast, by rating
5.4.8.REST OF ASIA-PACIFIC
5.4.8.1.Market size and forecast, by rating
5.5.LAMEA
5.5.1.Key market trends, growth factors, and opportunities
5.5.2.Market size and forecast, by rating
5.5.3.Market share analysis, by country
5.5.4.BRAZIL
5.5.4.1.Market size and forecast, by rating
5.5.5.SOUTH AFRICA
5.5.5.1.Market size and forecast, by rating
5.5.6.MIDDLE EAST
5.5.6.1.Market size and forecast, by rating
5.5.7.REST OF LAMEA
5.5.7.1.Market size and forecast, by rating
CHAPTER 6:COMPETITIVE LANDSCAPE
6.1.INTRODUCTION
6.1.1.MARKET PLAYER POSITIONING, 2019
6.2.TOP WINNING STRATEGIES
6.3.PRODUCT MAPPING OF TOP 10 PLAYER
6.4.COMPETITIVE HEATMAP
6.5.KEY DEVELOPMENTS
6.5.1.Mergers and acquisition
CHAPTER 7:COMPETITIVE LANDSCAPE
7.1.INTRODUCTION
7.1.1.MARKET PLAYER POSITIONING, 2019
7.2.TOP WINNING STRATEGIES
7.3.PRODUCT MAPPING OF TOP 10 PLAYER
7.4.COMPETITIVE HEATMAP
7.5.KEY DEVELOPMENTS
7.5.1.Mergers and acquisition
CHAPTER 8:COMPANY PROFILES:
8.1.CG Power and Industrial Solutions Ltd.
8.1.1.Company overview
8.1.2.Company snapshot
8.1.3.Operating business segments
8.1.4.Product portfolio
8.1.5.Business performance
8.2.Siemens AG
8.2.1.Company overview
8.2.2.Company snapshot
8.2.3.Operating business segments
8.2.4.Product portfolio
8.2.5.Business performance
8.3.Schneider Electric SE
8.3.1.Company overview
8.3.2.Company snapshot
8.3.3.Operating business segments
8.3.4.Product portfolio
8.3.5.Business performance
8.4.TBEA Co. Ltd.
8.4.1.Company overview
8.4.2.Company snapshot
8.4.3.Product portfolio
8.5.EMCO Ltd.
8.5.1.Company overview
8.5.2.Company snapshot
8.5.3.Product portfolio
8.5.4.Business performance
8.6.Kirloskar Electric Co. Ltd.
8.6.1.Company overview
8.6.2.Company snapshot
8.6.3.Product portfolio
8.7.Toshiba Corporation
8.7.1.Company overview
8.7.2.Company snapshot
8.7.3.Operating business segments
8.7.4.Product portfolio
8.7.5.Business performance
8.8.Hitachi Ltd.
8.8.1.Company overview
8.8.2.Company snapshot
8.8.3.Operating business segments
8.8.4.Product portfolio
8.8.5.Business performance
8.8.6.Key strategic moves and developments
8.9.Bharat Heavy Electricals Ltd.
8.9.1.Company overview
8.9.2.Company snapshot
8.9.3.Operating business segments
8.9.4.Product portfolio
8.9.5.Business performance
8.10.General Electric Company
8.10.1.Company overview
8.10.2.Company snapshot
8.10.3.Operating business segments
8.10.4.Product portfolio
8.10.5.Business performance
LIST OF TABLES
TABLE 01.GLOBALPOWER TRANFORMERS MARKET, BY RATING, 2019–2027 ($BILLION)
TABLE 02.POWER TRANSFORMERMARKET FOR LOW (5 MVA TO 100 MVA), BY REGION, 2019–2027 ($BILLION)
TABLE 03.POWER TRANSFORMERMARKET FOR MEDIUM (100 MVA TO 500 MVA), BY REGION, 2019–2027 ($BILLION)
TABLE 04.POWER TRANSFORMERMARKET FOR HIGH (ABOVE 500 MVA), BY REGION, 2019–2027 ($BILLION)
TABLE 05.GLOBAL POWER TRANSFORMERMARKET FOR, BY REGION, 2019–2027 ($BILLION)
TABLE 06.NORTH AMERICA POWER TRANFORMERS MARKET, BY RATING, 2019–2027 ($BILLION)
TABLE 07.NORTH AMERICA POWER TRANSFORMER MARKET, BY COUNTRY, 2018–2026 ($BILLION)
TABLE 08.U.S. POWER TRANFORMERS MARKET, BY RATING, 2019–2027 ($BILLION)
TABLE 09.CANADA POWER TRANFORMERS MARKET, BY RATING, 2019–2027 ($BILLION)
TABLE 10.MEXICO POWER TRANFORMERS MARKET, BY RATING, 2019–2027 ($BILLION)
TABLE 11.EUROPE POWER TRANFORMERS MARKET, BY RATING, 2019–2027 ($BILLION)
TABLE 12.EUROPE POWER TRANSFORMER MARKET, BY COUNTRY, 2019–2027 ($BILLION)
TABLE 13.RUSSIA POWER TRANFORMERS MARKET, BY RATING, 2019–2027 ($BILLION)
TABLE 14.GERMANY POWER TRANFORMERS MARKET, BY RATING, 2019–2027 ($BILLION)
TABLE 15.FRANCE POWER TRANFORMERS MARKET, BY RATING, 2019–2027 ($BILLION)
TABLE 16.UK POWER TRANFORMERS MARKET, BY RATING, 2019–2027 ($BILLION)
TABLE 17.ITALY POWER TRANFORMERS MARKET, BY RATING, 2019–2027 ($BILLION)
TABLE 18.REST OF EUROPE POWER TRANFORMERS MARKET, BY RATING, 2019–2027 ($BILLION)
TABLE 19.ASIA-PACIFICPOWER TRANFORMERS MARKET, BY RATING, 2019–2027 ($BILLION)
TABLE 20.ASIA-PACIFICPOWER TRANSFORMER MARKET, BY COUNTRY, 2018–2026 ($BILLION)
TABLE 21.CHINA POWER TRANFORMERS MARKET, BY RATING, 2019–2027 ($BILLION)
TABLE 22.INDIA POWER TRANFORMERS MARKET, BY RATING, 2019–2027 ($BILLION)
TABLE 23.JAPAN POWER TRANFORMERS MARKET, BY RATING, 2019–2027 ($BILLION)
TABLE 24.AUSTRALIAPOWER TRANFORMERS MARKET, BY RATING, 2019–2027 ($BILLION)
TABLE 25.REST OF ASIA-PACIFICPOWER TRANFORMERS MARKET, BY RATING, 2019–2027 ($BILLION)
TABLE 26.LAMEA POWER TRANFORMERS MARKET, BY RATING, 2019–2027 ($BILLION)
TABLE 27.LAMEA POWER TRANSFORMER MARKET, BY COUNTRY, 2019–2027 ($BILLION)
TABLE 28.BRAZIL POWER TRANFORMERS MARKET, BY RATING, 2019–2027 ($BILLION)
TABLE 29.SOUTH AFRICAPOWER TRANFORMERS MARKET, BY RATING, 2019–2027 ($BILLION)
TABLE 30.MIDDLE EAST POWER TRANFORMER MARKET, BY RATING, 2019–2027 ($BILLION)
TABLE 31.REST OF LAMEA POWER TRANFORMERS MARKET, BY RATING, 2019–2027 ($BILLION)
TABLE 32.KEY MERGERS AND ACQUISITION (2016-2019)
TABLE 33.KEY MERGERS AND ACQUISITION (2016-2019)
TABLE 34.CG: COMPANY SNAPSHOT
TABLE 35.AECI: OPERATING SEGMENTS
TABLE 36.CG: PRODUCT PORTFOLIO
TABLE 37.OVERALL FINANCIAL STATUS ($BILLION)
TABLE 38.SIEMENS: COMPANY SNAPSHOT
TABLE 39.SIEMENS: OPERATING SEGMENTS
TABLE 40.SIEMENS: PRODUCT PORTFOLIO
TABLE 41.OVERALL FINANCIAL STATUS ($BILLION)
TABLE 42.SCHNEIDER: COMPANY SNAPSHOT
TABLE 43.SCHNEIDER: OPERATING SEGMENTS
TABLE 44.SCHNEIDER: PRODUCT PORTFOLIO
TABLE 45.OVERALL FINANCIAL STATUS ($BILLION)
TABLE 46.TBEA: COMPANY SNAPSHOT
TABLE 47.TBEA: PRODUCT PORTFOLIO
TABLE 48.EMCO: COMPANY SNAPSHOT
TABLE 49.EMCO: PRODUCT PORTFOLIO
TABLE 50.OVERALL FINANCIAL STATUS ($BILLION)
TABLE 51.KIRLOSKAR: COMPANY SNAPSHOT
TABLE 52.KIRLOSKAR: PRODUCT PORTFOLIO
TABLE 53.TOSHIBA: COMPANY SNAPSHOT
TABLE 54.TOSHIBA: OPERATING SEGMENTS
TABLE 55.TOSHIBA: PRODUCT PORTFOLIO
TABLE 56.OVERALL FINANCIAL STATUS ($BILLION)
TABLE 57.HITACHI: COMPANY SNAPSHOT
TABLE 58.HITACHI: OPERATING SEGMENTS
TABLE 59.HITACHI: PRODUCT PORTFOLIO
TABLE 60.OVERALL FINANCIAL STATUS ($BILLION)
TABLE 61.HITACHI: KEY STRATEGIC MOVES AND DEVELOPMENTS
TABLE 62.BHEL: COMPANY SNAPSHOT
TABLE 63.BHEL: OPERATING SEGMENTS
TABLE 64.BHEL: PRODUCT PORTFOLIO
TABLE 65.OVERALL FINANCIAL STATUS ($BILLION)
TABLE 66.GE: COMPANY SNAPSHOT
TABLE 67.GE: OPERATING SEGMENTS
TABLE 68.GE: PRODUCT PORTFOLIO
TABLE 69.OVERALL FINANCIAL STATUS ($BILLION)
LIST OF FIGURES
FIGURE 01.KEY MARKET SEGMENTS
FIGURE 02.EXECUTIVE SUMMARY, BY RATING
FIGURE 03.EXECUTIVE SUMMARY, BY COUNTRY
FIGURE 04.TOP INVESTMENT POCKETS
FIGURE 05.BARGAINING POWER OF SUPPLIERS
FIGURE 06.THREAT OF NEW ENTRANTS
FIGURE 07.THREAT OF SUBSTITUTES
FIGURE 08.INTENSITY OF RIVALRY
FIGURE 09.BARGAINING POWER OF BUYERS
FIGURE 10.POWER TRANSFORMER MARKET DYNAMICS
FIGURE 11.GLOBAL POWER TRANSFORMER MARKET, BY RATING, 2019–2027 ($BILLION)
FIGURE 12.COMPARATIVE SHARE ANALYSIS OF POWER TRANSFORMER MARKET FOR LOW, BY COUNTRY, 2019 & 2027 ($BILLION)
FIGURE 13.COMPARATIVE SHARE ANALYSIS OF POWER TRANSFORMER MARKET FOR MEDIUM, BY COUNTRY, 2019 & 2027 ($BILLION)
FIGURE 14.COMPARATIVE SHARE ANALYSIS OF POWER TRANSFORMER MARKET FOR HIGH, BY COUNTRY, 2019& 2027 ($BILLION)
FIGURE 15.MARKET PLAYER POSITIONING, 2019
FIGURE 16.PRODUCT MAPPING OF TOP 10 PLAYERS
FIGURE 17.COMPETITIVE HEATMAP OF KEY PLAYERS
FIGURE 18.MARKET PLAYER POSITIONING, 2019
FIGURE 19.PRODUCT MAPPING OF TOP 10 PLAYERS
FIGURE 20.COMPETITIVE HEATMAP OF KEY PLAYERS
FIGURE 21.CG: REVENUE, 2016–2018($BILLION)
FIGURE 22.CG: REVENUE SHARE BY SEGMENT, 2018 (%)
FIGURE 23.CG: REVENUE SHARE BY REGION, 2018 (%)
FIGURE 24.SIEMENS: REVENUE, 2017–2019 ($BILLION)
FIGURE 25.SIEMENS: REVENUE SHARE BY SEGMENT, 2019 (%)
FIGURE 26.SIEMENS: REVENUE SHARE BY REGION, 2019 (%)
FIGURE 27.SCHNEIDER: NET SALES, 2017–2019 ($BILLION)
FIGURE 28.SCHNEIDER: REVENUE SHARE BY SEGMENT, 2019 (%)
FIGURE 29.SCHNEIDER: REVENUE SHARE BY REGION, 2019 (%)
FIGURE 30.EMCO: REVENUE, 2015–2017 ($BILLION)
FIGURE 31.EMCO: REVENUE SHARE BY REGION, 2017 (%)
FIGURE 32.TOSHIBA: REVENUE, 2016–2018 ($BILLION)
FIGURE 33.TOSHIBA: REVENUE SHARE BY SEGMENT, 2018 (%)
FIGURE 34.HITACHI: REVENUE, 2016–2018 ($BILLION)
FIGURE 35.HITACHI: REVENUE SHARE BY SEGMENT, 2018 (%)
FIGURE 36.HITACHI: REVENUE SHARE BY REGION, 2018 (%)
FIGURE 37.BHEL: REVENUE, 2016–2018 ($BILLION)
FIGURE 38.BHEL: REVENUE SHARE BY SEGMENT, 2018 (%)
FIGURE 39.BHEL: REVENUE SHARE BY REGION, 2018 (%)
FIGURE 40.GE: REVENUE, 2017–2019 ($BILLION)
FIGURE 41.GE: REVENUE SHARE BY SEGMENT, 2019 (%)
FIGURE 42.GE: REVENUE SHARE BY REGION, 2019 (%)
Power transformer market provides a substantial scope for growth. Demand for electricity, increase in cross-country power transmission networks, advancements in transmission lines as well as replacement of old units provide growth opportunities for this market. High cost is a major limitation for purchasing and installation of power transformers. However, no power system is complete without power transformers and hence, a lot of governments provide subsidies in various forms. Further, investments made in the power transformer will enable high amounts of electric power to be transmitted reliably and safely over long distances.
Major segments in power transformer market are low rating, medium rating, and high rating power transformers. Most of this market is grabbed by low rating power transformers because of their utilization in widely used medium and high-voltage transmission networks. As power transformer requires high manufacturing capacity and an established research experience, power transformer market is dominated by few key players. However, increase in electricity demand provides sufficient incentives for new players once they overcome the technological barriers.
A. Increasing demand for electric power, replacement of existing transmission networks, and increasing adoption of smart grids
A. Acquisition is the key growth strategy of power transformer market players
A. To get latest version of power transformer market report can be obtained on demand from the website.
A. Low and medium power transformers are in use due to its application in power transmission projects
A. Asia-Pacific region has more business opportunities for power transformer in future.
A. The top ten market players are selected based on two key attributes - competitive strength and market positioning
A. Bharat Heavy Electricals Ltd., CG Power and Industrial Solutions Ltd., EMCO Ltd., General Electric Company, Hitachi Ltd., Kirloskar Electric Co. Ltd., Schneider Electric SE, Siemens AG, TBEA Co. Ltd.and Toshiba Corp. are some of the leading players in the global power transformer market.
A. Medium rating power transformer holds the maximum share of the power transformer market.
A. "The expected market value of power transformer by 2027 is $50.8 billion. "
A. Power Utility companies are one of the potential customers of power transformer industry
Start reading instantly.
This Report and over 66,905+ more Reports, Available with Avenue Library. T&C*.
Enterprise
License/PDF
Library
Membership
*Taxes/Fees, if applicable will be added during checkout. All prices in USD
To ensure high-level data integrity, accurate analysis, and impeccable forecasts
For complete satisfaction
On-demand customization of scope of the report to exactly meet your needs
Targeted market view to provide pertinent information and save time of readers
Get insights on topics that are crucial for your business. Stay abreast of your interest areas.
Get Industry Data AlertsTo ensure high-level data integrity, accurate analysis, and impeccable forecasts
For complete satisfaction
On-demand customization of scope of the report to exactly meet your needs
Targeted market view to provide pertinent information and save time of readers