
PPE Detection Market Research - 2027
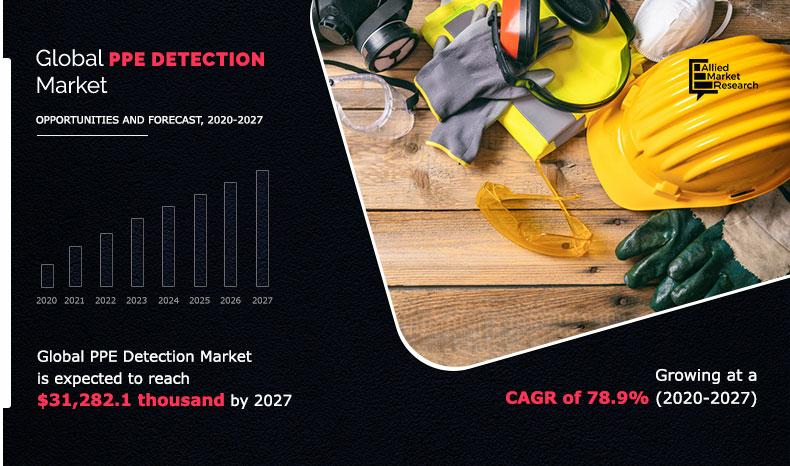
The PPE detection market was valued at $31,282.1 thousand in 2019, and is expected to reach $ 1,979,851.9 thousand by 2027, registering a CAGR of 78.9% from 2020 to 2027
Market Dynamics
PPE stands for Personal Protective Equipment, which is a body protection kit. It includes head covers like helmets, hand covers like gloves, face covers like goggles and masks, body cover like jackets or fluid resistant gown and feet cover like shoes. These PPE kits are used to protect the body parts from injury in industries such as oil & gas, construction and heavy manufacturing factories. In addition, PPE kits are used in healthcare industries such as pharmaceutical and hospitals to avoid exposure to drugs or harmful chemicals in laboratories and germs & viruses respectively. PPE detection systems use video or imaging technology to capture real-time images and footage and verify if the person is wearing PPE in restricted and enforced areas. A software connected to camera detects the PPE on the body of a person and then sends a signal that alerts the supervisor or the system, further restricting the opening of the door or forcing the person to wear the PPE.
There has been a rise in injuries as well as increase in death of workers in heavy industries such as oil & gas and construction over the last few years. Worker safety has thus become a major issue in the heavy industries. Therefore, governments in several countries have made its compulsory to provide the workers with appropriate PPE kits while working for their safety. In addition, the companies have installed PPE detection systems at their production sites to verify if the worker is wearing the PPE while working or not. In addition, there has been rise in healthcare industry with several new hospitals in developing nations as well as new R&D laboratories and manufacturing plants in the pharmaceutical industry. Thus, increase in usage of PPE kits in the healthcare sector is in turn giving rise to installation of PPE detection systems.
Further, some of the PPE detection system developing companies have made the system compatible with the existing CCTV that are installed at the working sites for surveillance and security purpose. This makes it economical and time saving to install the PPE detection systems. These are some of the major factors currently driving the PPE detection market around the globe. However, PPE kits are majorly used in developed countries on a large scale as compared to that in developing countries. Awareness about using PPE has not yet developed in emerging countries; thus, restricting the growth of installation of PPE detection markets. In addition, several technical issues such as failure in detection of PPE in real-time surveillance, is another factor that restricts the growth of the PPE detection market. Moreover, outbreak of COVID-19 led to stoppage or halt in construction and manufacturing activities, which stopped the installation of PPE detection in heavy industries. However, it was compulsory to wear PPEs in hospitals that were treating the COVID patients. This however led to installation of PPE detection systems in hospitals to verify whether the doctors are wearing the PPE or not. Furthermore, advancement in technology to aptly detect whether the people are using PPEs, while working will further boost the PPE detection market growth during the forecast period.
Segmental Overview
The PPE detection market is segmented into type, deployment, end-user industry, and region.
On the basis of type, the market is divided into eye, face & head, hand, body and other. Depending on deployment, it is classified into on-premises and cloud.
By end-user industry, it is segregated into oil & gas, construction, healthcare, food processing and others.
By region, PPE detection market is analyzed across North America (the U.S., Canada, and Mexico), Europe (Germany, the UK, France, Italy and rest of Europe), Asia-Pacific (China, Japan, South Korea, India, and Rest of Asia-Pacific), and LAMEA (Latin America, Middle East, and Africa).
By Type
Eye face & head segment holds the largest share in PPE detection market
By type, in 2019, the eye, face & face segment dominated the PPE detection market, in terms of revenue and the hand segment is expected to witness growth at the highest CAGR during the forecast period.
On the basis of deployment, the on-premise segment led the market in 2019, in terms of revenue and cloud is anticipated to register highest CAGR during the forecast period.
By end-user industry, the construction segment led the market in 2019, in terms of revenue and healthcare is anticipated to register the highest CAGR during the forecast period.
By End User
Construction segment holds dominant position in 2019
Competition Analysis
The major players profiled in the market include Agile Lab (AIM2), Axis Communications AB, Intenseye, OptiSol Business Solution, Pervasive Technologies, Skyl.ai, System One Digital, Uncanny Vision Solutions Pvt. Ltd., Vehant Technologies, VITech and Wipro Limited. Major companies in the market have adopted strategies such as business expansion, and product launch, to offer better products and services to customers in the PPE detection market.
By Region
North America holds a dominant position in 2019 and LAMEA is expected to grow at a highest rate during the forecast period.
Key Benefits For Stakeholders
- The report provides an extensive analysis of the current and emerging PPE detection market trends and dynamics.
- In-depth PPE detection market analysis is conducted by estimations for the key segments between 2020 and 2027.
- Extensive analysis of the market is conducted by following key product positioning and monitoring of top competitors within the PPE detection market framework.
- A comprehensive analysis of four major regions is provided to determine the prevailing of PPE detection market opportunities.
- The market forecast analysis from 2020 to 2027 is included in the report.
- The key market players operating in the PPE detection market share are profiled in this report and their strategies are analyzed thoroughly, which help understand the competitive outlook of the industry.
PPE Detection Market Report Highlights
| Aspects | Details |
| By TYPE |
|
| By DEPLOYMENT |
|
| By END-USER INDUSTRY |
|
| By Region |
|
| Key Market Players | VITECH, INTENSEYE, OPTISOL BUSINESS SOLUTIONS, WIPRO LIMITED, AGILE LAB (AIM2), VEHANT TECHNOLOGIES, PERVASIVE TECHNOLOGIES, AXIS COMMUNICATIONS AB, SYSTEM ONE DIGITAL, SKYL.AI, UNCANNY VISION SOLUTIONS PVT. LTD. |
Analyst Review
The PPE detection market is mainly driven by rise in government regulations and industrial norms of using PPE kits in industries such as oil & gas and construction. In addition, rise in infrastructures for R&D and manufacturing in the healthcare industry has led to rise in installation of PPE detection systems to monitor PPE on the body of people working in the facility. Further, compatibility of PPE detection systems with the existing CCTV systems reduces initial installation cost for new PPE detection systems. The PPE detection market was valued at $31,282.1 thousand in 2019, and is expected to reach $ 1,979,851.9 thousand by 2027, registering a CAGR of 78.9% from 2020 to 2027.
However, lack of awareness and usage of PPE in emerging countries has led to restriction of growth of the PPE detection market in developing countries. In addition, technical issues while verifying the PPE in real time is still a challenge in complex conditions and therefore, does not give 100% efficiency, thus restricting the growth of the PPE detection market. On the contrary, advancement in technology to achieve maximum efficiency in detecting usage of PPE is expected to boost the PPE detection market during the forecast period.
Major companies in the market have adopted strategies such as business expansion, and product launch, to offer better services to customers in the PPE detection market.
The global PPE Detection market size was valued at $31,282.1 thousand in 2019, and is projected to reach $1,979,851.9 thousand by 2027, growing at a CAGR of 78.9% from 2020 to 2027.
The forecast period considered for the global PPE Detection market is 2020 to 2027, wherein, 2019 is the base year, 2020 is the estimated year, and 2027 is the forecast year.
To get latest version of global PPE Detection market report can be obtained on demand from the website.
The base year considered in the global PPE Detection market report is 2019.
The top companies holding the market share in the global PPE Detection market report include Agile Lab (AIM2), Axis Communications AB, Intenseye, OptiSol Business Solution, Pervasive Technologies, Skyl.ai, System One Digital, Uncanny Vision Solutions Pvt. Ltd., Vehant Technologies, VITech and Wipro Limited.
The top ten market players are selected based on two key attributes - competitive strength and market positioning
The top ten market players are selected based on two key attributes - competitive strength and market positioning
By type, in 2019 the eye, face & head segment dominated the global PPE Detection market, in terms of revenue and is expected to maintain this trend during the forecast period.
By end user, the construction segment is the highest share holder of global PPE Detection market.
The report contains an exclusive company profile section, where leading 10 companies in the market are profiled. These profiles typically cover company overview, geographical presence, market dominance (in terms of revenue and volume sales), various strategies and recent developments.
The market value of the global PPE Detection market is $33,784.6 thousand in 2020.
Loading Table Of Content...

