
Press Brakes Market Research, 2032
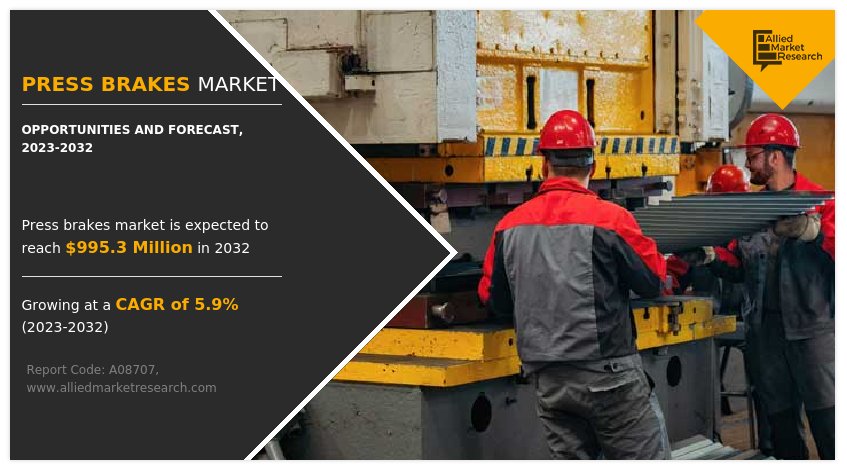
The global press brakes market size was valued at $568.2 million in 2022, and is projected to reach $995.3 million by 2032, growing at a CAGR of 5.9% from 2023 to 2032.A press brake is an important system in metallic fabrication, designed for bending and shaping sheet steel with precision. Operating at the precept of making use of pressure to a workpiece, the clicking brake utilizes a punch and die set to deform the material right into a favored shape. It offers versatility in developing various angles, bends, and forms, making it a fundamental device in industries which include production, building, and automobile. The operator controls the bending process, adjusting parameters along with tonnage and back gauge position, allowing the manufacturing of intricately formed components with accuracy and efficiency in diverse metalworking applications.
Technological Aspect
Modern press brakes are increasingly more geared up with modern technologies, along with Computer Numerical Control (CNC) systems, superior servo-hydraulic mechanisms, and complex bending software programs. These technological enhancements make contributions to superior accuracy, repeatability, and efficiency in metal bending approaches. CNC controls enable operators to program complicated bending sequences with excessive precision, ensuring the consistent manufacturing of crucial components. In addition, key market players are launching new advanced press brake machine to fulfil customers' demand. For instance, in August 2022, Accurl displayed the eB Ultra Series, the heavy duty full electric servo press brake. At the Hannover exhibition, the models shown were New servo electric press brake eB Ultra 35tx1250 and Hybrid Servo Press Brake EuroMaster B32.175. These press brakes offer four characteristics of “environmental protection, energy saving, high precision, and high efficiency”. Such instances are expected to drive the growth of press brakes market . Furthermore, the integration of servo-hydraulic systems enhances speed control, reduces electricity consumption, and enables smoother bending operations. This technological ability isn't only a motive force but additionally facilitates the belief of different industry developments, inclusive of the adoption of Industry 4.0 standards, paving the way for smart, connected press brake systems capable of actual-time monitoring, information analytics, and predictive protection, thereby positioning the press brakes market at the forefront of manufacturing innovative products.
Market dynamics
The rising demand for metal fabrication across numerous industries, such as automotive, aerospace, construction and other industries. This surge in demand for press brakes in shaping and forming sheet metal additives, a crucial step within the production strategies of several end-products. Technological advancements in press brake designs have brought about the introduction of extraordinarily efficient machines able to precision bending and forming, catering to the exacting requirements of modern-day business programs. For instance, in September 2023, Ursviken Technology installed the largest press brake they have built at the customers location. The machine is equipped with 73 ft bending length and 5,500 tons of bending force and is fully programmable and automatic upper tool changing. Such factors are expected to drive the growth of press brakes market.
Press brakes, equipped with innovative features inclusive of Computer Numerical Control (CNC) systems, laser-based positioning, and adaptive bending technologies, provide manufacturers unparalleled manipulate over the steel shaping system. The automotive sector relies on press brakes for producing complex and crucial components used in vehicle construction, whilst the construction enterprise uses them for manufacturing structural elements. Press brakes are expected to become increasingly in demand as infrastructure development projects spread throughout the world, making them essential instruments in the changing field of metal production. The adaptability of press brakes allows producers to meet a wide range of client requests and adjust to the changing demands of various industries, which emphasizes this tendency even more. This is turn is expected to increase deamnd of press brakes machines and drive the growth of the press brakes market.

Moreover, growing adoption of automation in manufacturing process is driving the press brakes market. Press brakes prepared with superior automation functions are at the forefront of revolutionizing sheet metal bending operations. Automation in press brakes entails the integration of robot systems for material handling, tool changing, and even the execution of complex bending sequences. The implementation of robot arms complements general performance by lowering manual intervention, increasing production speed, and minimizing the risk of errors. For instance, in May 2022, Universal Robots gave a demo of collaborative robots configured to use press brake machines at Automate 2022 trade show. Such instances are expected to drive the growth of press brakes industry.
Additionally, computerized press brakes contribute to work safety by mitigating the need for human operators to handle heavy substances and repetitive tasks. The synergy of automation and press brake technology is evident within the usage of Computer Numerical Control (CNC) systems, allowing for specific programming and execution of bending sequences. This not only guarantees constant and extremely good output but also enables the seamless adoption of press brakes to various manufacturing necessities. The trajectory towards more automation aligns with the broader industry trends of enhancing operational efficiency, lowering labor wages, and embracing smart production standards, positioning automatic press brakes as necessary assets inside the current landscape of steel fabrication.

However, the high initial cost of acquiring press brake is a restraint for the growth of press brakes market. The average cost of press brake ranges from $12,000 to $16,000. The modern press brakes, especially the ones prepared with superior capabilities including Computer Numerical Control (CNC) systems, automation, and precision bending competencies, often entails a substantial upfront cost. This financial barrier can pose a challenging situation for small and medium-sized firms (SMEs) or organizations with financial constraints, restricting their capability to spend money on the latest press brake technology.
Moreover, press brake manufacturers are in a great position to benefit from the growing need for customized solutions that meet a range of industry needs and applications. The versatility of press brake technology, which enables the exact bending and forming of sheet metal components in accordance with unique project specifications, is what drives this opportunity in particular. Manufacturers can carve out a place in the market and offer specialized press brake models that are tailored for specific industries like automotive, aerospace, or architectural fabrication. For instance, in July 2023, Airbus C-295 aircraft production is growing in India, with plans for the manufacturing of 40 plane in collaboration with Tata in India. The initiative entails the manufacture of 16 plane in fly-away condition at the Airbus facility in Seville, Spain. Additionally, Airbus aims to industrialize around 3,500 parts in India annually as a part of the manufacturing method. This move represents a great step in the direction of increasing Airbus' footprint in India and fostering a collaborative aerospace production, bringing together know-how from each Airbus and Tata. Such factors are expected to increase the demand for press brakes machine, which in turn is expected to drive the growth of the press brakes market.
Furthermore, the clients receive greater value. The range of customized solutions is further increased by the ability to customize bending tools for materials and geometries because of developments in tooling technologies. Such factors are expected to offer lots of opportunities for the press brakes market growth during the forecast period.

Segmental Overview
The press brakes market is segmented on the basis of product type, power source, and axis and region. By product type, the market is categorized into hydraulic, hybrid, servo-electric, and others. On the basis of power source, it is bifurcated into electric and hydraulic. As per axis, the market is categorized into 2 to 4 axis, 4 to 6 axis, 6 to 8 axis. Region wise, the market is analyzed across North America, Europe, Asia-Pacific, Latin America, Middle East and Africa.
By product type: The press brakes market is divided into hydraulic, hybrid, servo-electric, and others. In 2022, the segment encompassing servo-electric dominated the market, in terms of revenue and is predicted to grow with a higher CAGR during the forecast duration.
By power source: The market is categorized into electric, and hydraulic. In 2022, the electric segment dominated the press brakes market share, in terms of revenue, and is expected to maintain this trend during the forecast period and is segment is expected to grow with a higher CAGR during the forecast period.
By axis: The market is categorized into 2 to 4 axis, 4 to 6 axis, 6 to 8 axis. In 2022, the 2 to 4 axis segment dominated the press brakes market, in terms of revenue, and is expected to maintain this trend during the forecast period. However, the 4 to 6 axis segment is expected to grow with a 6.3% CAGR during the forecast period.
By region: The Press brakes market forecast is analyzed across North America, Europe, Asia-Pacific, Latin America, and the Middle East & Africa. Asia-Pacific accounted for the highest market share in 2022 and North America expected to exhibit the highest CAGR during the forecast period. Asia-Pacific is one of the world’s fastest growing regions, increasing at a rate of 5% annually. Rapid industrialization has led to expansion of the manufacturing industry, which eventually has boosted the economy's GDP. The manufacturing industry is likewise flourishing because of the lenient industrial regulations of the countries, which aim to attract foreign investment. For instance, in October 2022, Main Street Capital Corporation disclosed a $31 million investment in MetalForming LLC to support the recapitalization of the company. MetalForming is globally recognized as the largest distributor of metal folding machines and holds the position of the largest supplier of high-end architectural sheet metal machines in North America. The investment by Main Street Capital Corporation is expected to contribute to the growth and strategic development of MetalForming, reinforcing its standing in the industry as a key player in the distribution of metal folding and architectural sheet metal machines.

Moreover, various initiatives have boosted the manufacturing industry as well as R&D initiatives in Asia-Pacific. For instance, Make in India an initiative was launched by Indian government, and Made in China 2025 launched by the Chinese government to aid the manufacturing industry in China. These factors are expected to provide advantageous opportunities for the growth of the press brakes market.
Competition Analysis
Competitive analysis and profiles of the major players in the Press brakes market, such as Durmazlar Machinery Inc., Accurl CNC Machine Anhui Manufactory Co., Ltd., Amada Company, Ltd., Baykal Makina Sanayi ve Ticaret A.S., ADH Machine Tool, Cincinnati Incorporated, Dener Makina, Ermaksan, and LVD Company nv, are provided in this report. Major players have adopted product launch and acquisition as key developmental strategies to improve the product portfolio of the press brakes market.
For example, in May 2022, METALfx, a prominent provider of sheet metal fabrications, enclosures, assemblies, and wood composite components, has announced the successful acquisition of J&M Manufacturing, Inc. This strategic move is expected to enhance METALfx's capacity, facilitating accelerated growth. The acquisition aims to strengthen support for METALfx's existing core customers while also welcoming and serving the clientele of J&M Manufacturing, Inc. This development signifies a strategic expansion for METALfx, broadening its capabilities and market presence within various industries.
Key Benefits For Stakeholders
- This report provides a quantitative analysis of the market segments, current trends, estimations, and dynamics of the press brakes market analysis from 2022 to 2032 to identify the prevailing press brakes market opportunity.
- The market research is offered along with information related to key drivers, restraints, and opportunities.
- Porter's five forces analysis highlights the potency of buyers and suppliers to enable stakeholders make profit-oriented business decisions and strengthen their supplier-buyer network.
- In-depth analysis of the press brakes market segmentation assists to determine the prevailing market opportunities.
- Major countries in each region are mapped according to their revenue contribution to the global market.
- Market player positioning facilitates benchmarking and provides a clear understanding of the present position of the market players.
- The report includes the analysis of the regional as well as global press brakes market trends, key players, market segments, application areas, and market growth strategies.
Press Brakes Market Report Highlights
| Aspects | Details |
| Market Size By 2032 | USD 995.3 million |
| Growth Rate | CAGR of 5.9% |
| Forecast period | 2022 - 2032 |
| Report Pages | 220 |
| By Product Type |
|
| By Power Source |
|
| By Axis |
|
| By Region |
|
| Key Market Players | Baykal Makina Sanayi ve Ticaret A.S., Accurl CNC Machine Anhui Manufactory Co., Ltd., ERMAKSAN, LVD Company NV, ADH Machine Tool, Cincinnati Incorporated, Prima Industrie SpA, Amada Company, Ltd., Dener Makina, Durmazlar Machinery Inc. |
Analyst Review
Advancements in press brake technology, including automation, CNC controls, and precision bending capabilities, are driving adoption among manufacturers seeking improved efficiency and accuracy. Growing manufacturing and industrial sector in Asia-Pacific is driving the growth of press brakes market.
Manufacturers are increasingly looking for versatile press brake solutions that allow for a high degree of customization to meet specific project requirements, contributing to market growth. The trend toward automation in manufacturing processes, including press brake operations, is driven by the need for higher efficiency, reduced labor costs, and improved safety.
In addition, a lack of skilled professionals is expected to restrain market growth. Moreover, the integration of Industry 4.0 technologies, such as IoT (Internet of Things) and data analytics, into press brake systems presents opportunities for enhanced monitoring, predictive maintenance, and overall process optimization. are anticipated to provide lucrative opportunities for market growth.
The global press brakes market was valued at $568.1 million in 2022, and is projected to reach $995.3 million by 2032, registering a CAGR of 5.88% from 2023 to 2032.
The forecast period considered for the global press brake market is 2022 to 2032, wherein, 2022 is the base year, 2023 is the estimated year, and 2032 is the forecast year.
The latest version of global press brake market report can be obtained on demand from the website.
The base year considered in the global press brake market report is 2022.
The major players profiled in the press brake market include Durmazlar Machinery Inc., Accurl CNC Machine Anhui Manufactory Co., Ltd., Amada Company, Ltd., Baykal Makina Sanayi ve Ticaret A.S., ADH Machine Tool, Cincinnati Incorporated, Dener Makina, Ermaksan, and LVD Company NV.
The top ten market players are selected based on two key attributes - competitive strength and market positioning.
The report contains an exclusive company profile section, where leading companies in the market are profiled. These profiles typically cover company overview, geographical presence, market dominance (in terms of revenue and volume sales), various strategies, and recent developments.
Based on product type, the servo-electric segment was the largest revenue generator in 2022.
Loading Table Of Content...
Loading Research Methodology...

