
Pressure Sensor Market Research, 2032
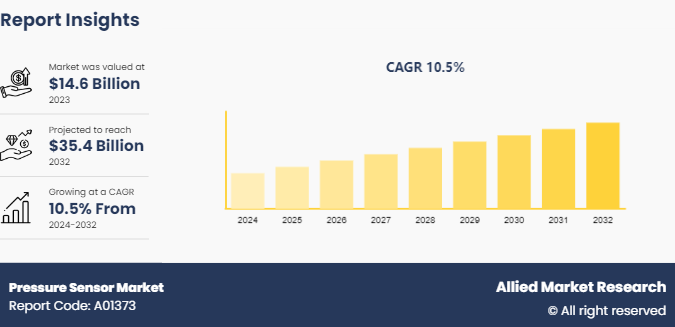
The Global Pressure Sensor Market was valued at $14.6 billion in 2023, and is projected to reach $35.4 billion by 2032, growing at a CAGR of 10.5% from 2024 to 2032.
Market Introduction and Definition
Pressure sensors are devices used to measure the pressure of gases or liquids and convert the pressure into an electrical signal for monitoring and control purposes. These sensors play a critical role in many applications across multiple industries, including automotive, healthcare, aerospace, industrial, and consumer electronics. The increase in demand for pressure sensors is driven by their essential functions in ensuring safety, efficiency, and reliability in systems and processes.
In the automotive industry, pressure sensors are vital for monitoring tire pressure, engine performance, and emission control. In healthcare, they are used in devices such as ventilators and blood pressure monitors. Industrial applications include monitoring and controlling pressure in manufacturing processes, while in aerospace, they are used in altitude and cabin pressure measurement.
The market for pressure sensors has grown rapidly due to advancements in technology, such as miniaturization and improved accuracy. The rise in integration of Internet of Things (IoT) further propels market growth, as pressure sensors are integral components in smart devices and systems. The market is characterized by continuous innovation and a wide array of applications, making pressure sensors indispensable in modern technology.
Key Takeaways:
- The pressure sensor industry study covers 20 countries. The research includes a segment analysis of each country in terms of value ($Billion) for the projected period 2024-2032.
- More than 1, 500 product literatures, industry releases, annual reports, and other such documents of major pressure sensors industry participants along with authentic industry journals, trade associations' releases, and government websites have been reviewed for generating high-value industry insights.
- The pressure sensor industry study integrated high-quality data, professional opinions and analysis, and critical independent perspectives. The research approach is intended to provide a balanced view of global markets and to assist stakeholders in making educated decisions to achieve their most ambitious growth objectives.
Industry Trends:
- In January 2024, the Center of Excellence (CoE) in IIoT Sensors, established at Makers Village Kochi by MeitY, the Government of India, and the Government of Kerala, is a distinctive facility aimed to develop sensors within the domain of Intelligent IoT systems. This center focuses on a wide range of applications involving intelligent sensors in networks, devices, and sensor systems.
- In August 2023, the National Science Foundation announced monetary funding for 18 research teams based at U.S. universities, with each team receiving approximately $1 million to $2 million over a four-year period. The monetary funding by National Science Foundation is for research focusing on innovation in quantum sensing technologies, which provide advanced and precise measurements of changes in temperature, movement, direction, and other characteristics of subatomic particles.
Key Market Dynamics
The pressure sensors market growth is primarily driven by advancements in automotive technology. In this automotive industry, pressure sensors are essential for applications such as monitoring tire pressure, optimizing engine performance, and controlling emissions. The increase in emphasis on vehicle safety and efficiency, along with stringent emission regulations, has propelled the demand for sophisticated pressure sensor solutions. Another significant driver is the rise in adoption of Internet of Things (IoT) . As smart devices and connected systems become more prevalent, the need for accurate and reliable pressure measurement has grown. Pressure sensors are integral components in various IoT applications, ranging from smart home devices to industrial automation systems, enhancing operational efficiency and data accuracy.
Moreover, the rapid growth of the healthcare sector contributes to market expansion. Pressure sensors are critical in medical devices such as ventilators, blood pressure monitors, and infusion pumps, where precise pressure measurement is vital for patient care. The ongoing advancements in medical technology and the increasing focus on healthcare quality further boost the demand for pressure sensors.
One of the main challenges in the pressure sensors market is the high cost of advanced pressure sensor technologies. The development and manufacturing of highly accurate and reliable pressure sensors often requires sophisticated materials and complex fabrication processes, leading to higher costs. This is a significant barrier for small and medium-sized enterprises (SMEs) , which limits the adoption of pressure sensors in cost-sensitive applications. In addition, integrating these sensors into existing systems requires significant modifications and investments, further deterring potential users.
Despite these challenges, the pressure sensors market presents substantial opportunities, particularly with the rise of Industry 4.0 and increase in implementation of smart manufacturing practices. As industries across the globe move toward automation and smart factory setups, the demand for pressure sensors is expected to surge. These sensors play a critical role in monitoring and controlling industrial processes, ensuring operational efficiency and safety. The integration of Internet of Things (IoT) offers immense potential for market expansion. Pressure sensors are essential components in IoT networks, enabling real-time data collection and analysis, which is crucial for predictive maintenance, energy management, and other smart applications.
Moreover, advancements in MEMS (Micro-Electro-Mechanical Systems) technology augment the development of miniaturized, cost-effective pressure sensors, opening new avenues in consumer electronics, healthcare, and wearable devices. This ongoing innovation is poised to mitigate cost concerns and expand the applicability of pressure sensors across various sectors.
Patent Analysis of Pressure Sensors Market
The global pressure sensors market is segmented according to the patents filed in the China, U.S., Japan, PCT, European Patent Office, Republic of Korea, Russian Federation, Germany, UK, and Canada. China has the largest number of patent filings, owing to suitable research infrastructure. Approvals from these authorities are followed/accepted by registration authorities in many of the developing regions/countries. The patents registered by these countries are from 2015 to 2023.

Market Segmentation
The pressure sensor industry report is segmented on the basis of type, sensor type, technology, end-use industry, and region. On the basis of type, market is classified into absolute pressure sensors, gauge pressure sensor, and differential pressure sensors. On the basis of sensor type, the market is bifurcated into wired and wireless. On the basis of end-use industry, the market is divided into automotive, oil & gas, consumer electronics, medical, industrial, and others. On the basis of technology, the market is categorized into piezoresistive, electromagnetic, capacitive, resonant solid state, optical, and others. Region wise, the pressure sensors market trends are analyzed across North America (U.S., Canada, and Mexico) , Europe (Germany, France, Italy, UK, and rest of Europe) , Asia-Pacific (China, Japan, India, South Korea, and rest of Asia-Pacific) , and LAMEA (Latin America, Middle East, and Africa) .
Regional/Country Market Outlook
Asia-Pacific led the pressure sensor market in 2023 and is expected to continue its dominance over the forecast period. The region's growth is driven by large-scale electronic component production and rising investments in research and development. The rising demand for consumer electronics, including tablets, wearable devices, and smartphones, boosts demand for pressure sensors in this region. India and China significantly contribute to the regional market, with China being a mature marketplace offering robust business opportunities. For example, in July 2021, Danfoss Group, a leader in software and engineering technologies, announced substantial investments aimed at accelerating the growth of China's pressure sensors market.
Competitive Landscape
The pressure sensor company list include AlphaSense, City Technology Ltd., Dynament Ltd., Membrapor Figaro Engineering Inc., Nemoto Kyorindo co., Ltd., ABB Ltd., Robert Bosch GmbH, Siemens, and GfG Europe Ltd. Market players have adopted various strategies such as product launch, expansion, collaboration, partnership, and acquisition to strengthen their foothold in the pressure sensors industry.
Recent Key Strategies and Developments
In June 2023, Infineon Technologies AG launched two advanced XENSIV barometric air pressure (BAP) sensors, the KP464 and KP466, specifically designed for automotive applications. The KP464 sensor is crafted for accurate engine control management, whereas the KP466 BAP sensor is designed to improve seat comfort functions.
Key Sources Referred
- AMA Association for Sensors and Measurement
- IEEE Sensors Council
- International Frequency Sensor Association
- American Public Works Association
- The Royal Society of Chemistry
- Lighting Control Associations
- The National Institute of Health
- Union of International Association
Key Benefits For Stakeholders
- This report provides a quantitative analysis of the market segments, current trends, estimations, and dynamics of the pressure sensor market. Pressure Sensor Market Forecast is from 2024 to 2032 to identify the prevailing pressure sensor market opportunities.
- The market research is offered along with information related to key drivers, restraints, and opportunities.
- Porter's five forces analysis highlights the potency of buyers and suppliers to enable stakeholders make profit-oriented business decisions and strengthen their supplier-buyer network.
- In-depth analysis of the pressure sensor market segmentation assists to determine the prevailing market opportunities.
- Pressure Sensor Market Size by Country in each region are mapped according to their revenue contribution to the global market.
- Market player positioning facilitates benchmarking and provides a clear understanding of the present position of the market players. Pressure Sensor Company list includes various players at global level.
- The report includes the analysis of the regional as well as global pressure sensor market trends, pressure sensor market share by companies, air pressure sensor, water pressure sensor, pressure sensor sector analysis, market segments, application areas, and market growth strategies.
Pressure Sensor Market Report Highlights
| Aspects | Details |
| Market Size By 2032 | USD 35.4 Billion |
| Growth Rate | CAGR of 10.5% |
| Forecast period | 2024 - 2032 |
| Report Pages | 250 |
| By Sensor Type |
|
| By Type |
|
| By End Use Industry |
|
| By Technology |
|
| By Region |
|
| Key Market Players | Siemens A.G., City Technology Ltd, GfG Europe Ltd., ABB Ltd, Dynament Ltd, AlphaSense, Nemoto Kyorindo co., Ltd, Membrapor Figaro Engineering Inc., Robert Bosch GmbH |
Analyst Review
Pressure sensors market is anticipated to showcase potential growth over the coming 4 – 5 years, driven by the growing adoption of these sensors by different end use verticals such as automotive, consumer electronics, and healthcare among others.
Increase in demand of smart programs such as trip optimizers used in trucks, which utilize various sensors (including position sensors), is expected to increase, especially in the U.S. and Europe during the forecast period. Technologies such as prognostics are projected to help the consumers to monitor real-time data through online connectivity. However, high development cost restrains the market growth.
Increase in demand of different types of sensors, especially in autonomous cars, is expected to drive the market during the forecast period. Advanced technologies and innovations such as Advanced Driver Assistance Systems (ADAS) and Emission Control Sensors are projected to open new opportunities for the pressure sensors market in the automotive industry.
Asia-Pacific and North America are expected to provide lucrative growth opportunities to the market players owing to the high projected growth of the pressure sensor market in these regions. Prominent players such as Emerson Electric, ABB Group, Robert Bosch GmbH, Analog Devices, and Denso Corporation are largely engaged in the process of product innovation, collaboration, and acquisition to further expand their services across various geographies.
The pressure sensors market was valued at $14.6 billion in 2023 and is estimated to reach $35.4 billion by 2032, exhibiting a CAGR of 10.5% from 2024 to 2032.
Asia-Pacific is expected to continue its dominance over the forecast period. Asia Pacific segment is fueled by expanding industrialization, increasing automotive production, and rising demand for consumer electronics
Automotive segment is expected to continue its dominance over the forecast period due to the increasing integration of pressure sensors in modern vehicles for applications such as tire pressure monitoring, engine management, and airbag systems. Additionally, advancements in autonomous driving technology further drive the demand for pressure sensors in this sector.
The pressure sensor market is driven by technological advancements, increased automotive and IoT applications, growing healthcare uses, and regional demand in Asia-Pacific. Miniaturization, wireless sensors, and MEMS technology are key trends boosting market growth?
The key players of the pressure sensors market include AlphaSense, City Technology Ltd., Dynament Ltd., Membrapor Figaro Engineering Inc., Nemoto Kyorindo co., Ltd., ABB Ltd., Robert Bosch GmbH, Siemens, and GfG Europe Ltd.
Loading Table Of Content...

