0
2023
Prosthetics Market

Prosthetics Market

by Product (Upper Extremity Prosthetics, Lower Extremity Prosthetics, Others), by Design (Exoskeletal Design, Endoskeletal Design), by End User (Prosthetics Clinics, Hospitals, Others): Global Opportunity Analysis and Industry Forecast, 2021-2031

Report Code: A08292
Jan 2023 | Pages: 220
Tables: 125
Charts: 60
  • Formats*:

  • pdf

    Single User License, Five User
    License & Enterprise User License

  • xls

    Data Pack Excel License

  • ppt

    It comes with the additional cost
    of $2500.00 contact sales.


Prosthetics Market Research, 2031

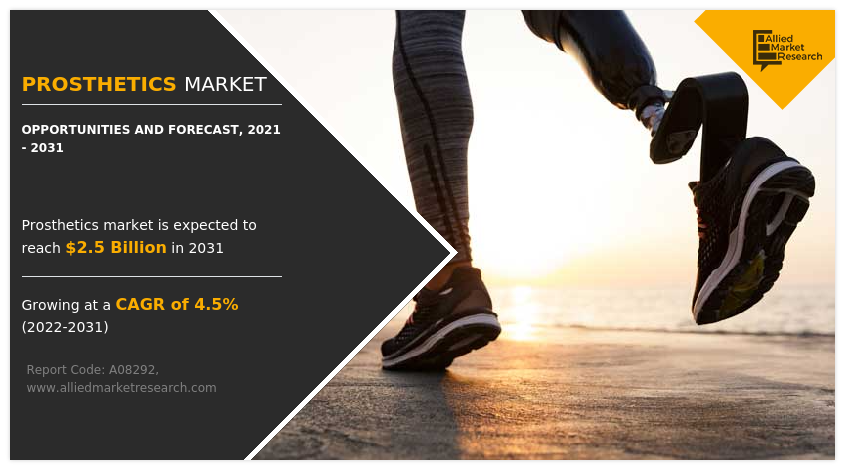
The global prosthetics market was valued at $1.6 billion in 2021, and is projected to reach $2.5 billion by 2031, growing at a CAGR of 4.5% from 2022 to 2031. Prosthetics is a device designed to replace a missing body part or to make a part of the bodywork better. Missing limbs and joints are commonly replaced by prosthetic devices. These devices are worn by people who have lost limbs or those born with congenital limb differences. There are many types of prosthetic devices to help people regain mobility. Each serves a different function depending on what body part is missing. Artificial limbs attach to the amputee's residual limb (stump) by belts, cuffs, or suction. Either the residual limb fits directly into a socket on the prosthetic, or a liner is used that’s fixed to the socket by vacuum or a pin lock. The current prosthesis options improve quality of life by providing mobility needed to manage daily activities. Lower extremity prosthetics allow people to walk, run, and play sports. With increased movement, people gain greater independence and confidence and live fuller lives without feeling socially anxious or burdened by physical challenges.

The COVID-19 pandemic witnessed a negative impact on the prosthetics industry, owing to the reduction in the number of patients of prosthetic implantation. This reduction is of concern since the elevate prevalence of disease like edentulism normally was linked to more vulnerable and marginalized people, which could worsen oral health conditions, impairing the oral health?related quality of life and increasing the already disparities.

Prosthetics Market

Historical Overview

The market has been analyzed qualitatively and quantitatively from 2021 to 2031. The prosthetics market witnessed growth at a CAGR of around 4.5% from 2022 to 2031. Most of the growth during this period was from North America owing to the increase in the adoptions of prosthetics, rise in incidences of injuries and trauma, as well as well-established presence of domestic market players in the region.

Market Dynamics

Growth & innovations in the medical devices industry for the adoption of prosthetics device technology is driven by the massive pool of chronic diseases like bone and joint cancer. The rise in the number of injuries due to accidents or sports that lead to the procedure of amputation creates an opportunity for the Prosthetics Industry. Moreover, the rise in the number of strategies adopted like agreements by various key players across the globe is set to affect Prosthetics Market Growth positively. For instance, in November 2019, Össur and Alfred Mann Foundation (AMF) signed a milestone agreement that allowed Össur to further develop and license AMF’s implanted myoelectric sensor (IMES) system as both organizations continue exploring the potential of mind-controlled prosthetic technologies. The growth of the prosthetics market is also expected to be driven by high potential in adoption of the technology in developing countries due to increase in the incidences of accidents, increase in practice of amputation, and surge in demand for prosthetics devices. Furthermore, the healthcare industry in emerging economies is developing at a significant rate, owing to rise in demand for enhanced medical technologies, significant investments by government to develop prosthetics, and strong foothold of medical device industries in emerging countries. In addition, the cost effectiveness of the prosthetic devices may also decide the demand for adoption of the devices. It's because the high cost of the devices makes it unaffordable for the facilities or hospitals that generate low revenues for the adoption of healthcare devices. Hence, the cost effectiveness factor for the prosthetics is attributed to further support the market growth. The demand for prosthetics is not only limited to developed countries but is also being witnessed in the developing countries, such as China, Brazil, and India, which fuel the growth of the market. Factors such as rise in the number amputation procedures performed and increase in awareness toward benefits of prosthetics further drive the growth of the market. Furthermore, rise in consumer awareness related to advanced healthcare options boosts the adoption of prosthetics. In addition, an increase in research activities by manufacturers for developing innovative solutions in prosthetics technology is expected to fuel their adoption in the near future.
However, the high cost associated with the prosthetics & greater maintenance associated with the prosthetics are hampering the Prosthetics Market Size growth.

Segmental Overview

The prosthetics market is segmented on the basis of product, design, end user, and region. On the basis of product, the market is classified into upper extremity prosthetics, lower extremity prosthetics and others. On the basis of design, the market is bifurcated into exoskeletal design and endoskeletal design. On the basis of end user, the market is categorized into prosthetics clinics, hospitals, and others. Region wise, the market is studied across North America (the U.S., Canada, and Mexico), Europe (Germany, France, UK, Italy, Spain, and Rest of Europe), Asia-Pacific (Japan, China, Australia, India, South Korea and rest of Asia-Pacific), and LAMEA (Brazil, South Africa, Saudi Arabia, and rest of LAMEA).

The prosthetics market is segmented into Product, Design and End User.

Prosthetics Market

By Product

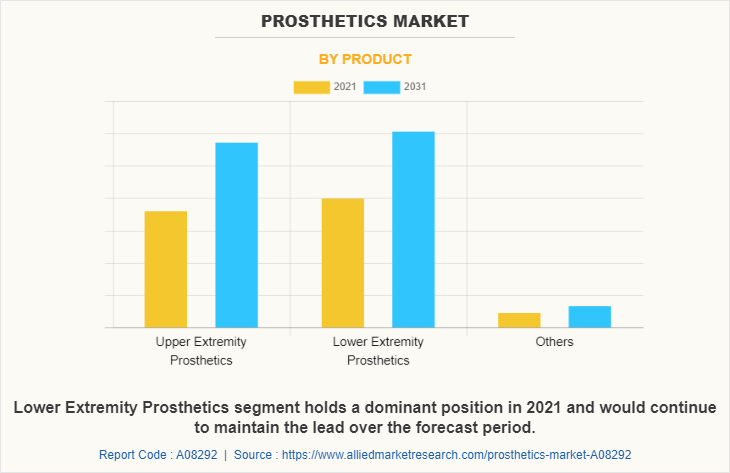
The lower extremity prosthetics segment dominated the global Prosthetics Market Size in 2021 and is expected to remain dominant throughout the Prosthetics Market Forecast period, owing to an increase in the adoption of lower extremity prosthetics for implantation and the availability of several types of devices that are developed by various key players in the market. Moreover, the rise in the practice of amputation also boosts the demand for prosthetics devices.
Prosthetics Market

By Design

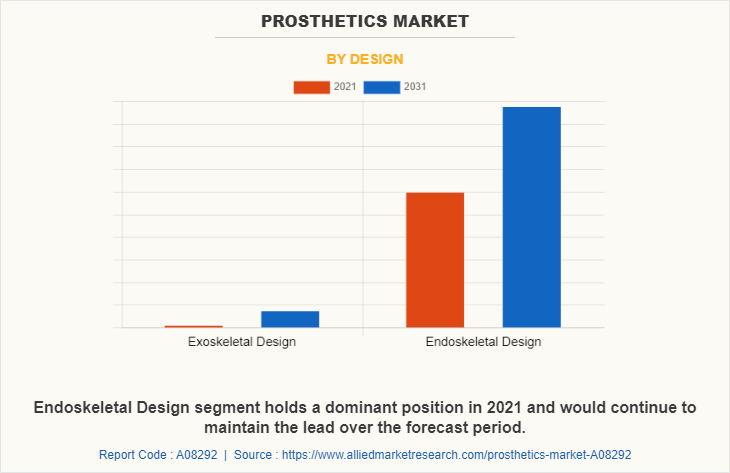
The endoskeletal design segment dominated the global Prosthetics Market Share in 2021 and is anticipated to continue this trend during the forecast period. This is attributed to the increase in prevalence of chronic bone disorders among the population like osteoporosis and osteopenia. In addition, growth in awareness regarding the prosthetics benefits and rise in adoption of advanced prosthetics drives the growth of market.
Prosthetics Market

By End User

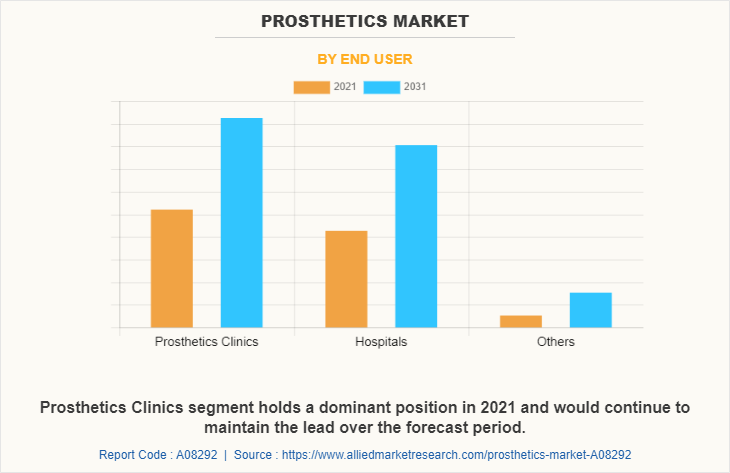
The prosthetics clinics segment held the largest market share in 2021 and is expected to remain dominant throughout the forecast period, owing to the preference of population for the intrapartum monitoring in hospitals and the ease of accessibility of the patients to the hospitals and clinics post-COVID-19 pandemic situation.
Prosthetics Market

By Region

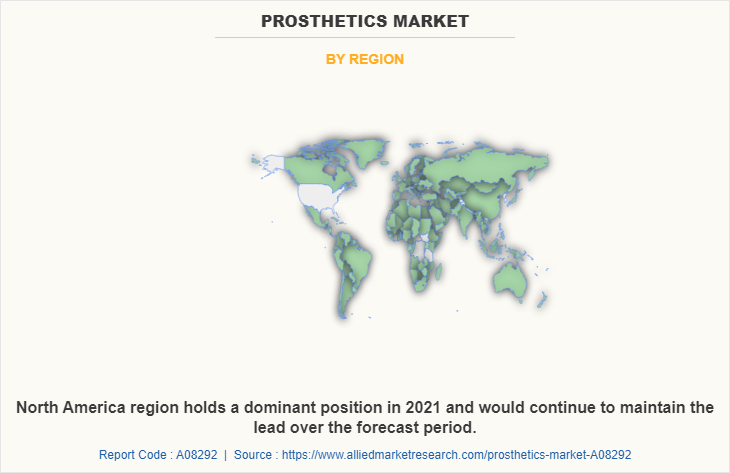
The prosthetics market is analyzed across North America, Europe, Asia-Pacific, and LAMEA. In 2021, North America was the dominant region and is expected to remain dominant throughout the forecast period, owing to high prevalence rate of bone disorders like osteosarcoma, an increase in the number of market players, and a surge in the number of devices available in the region. However, Asia-Pacific is expected to witness the highest CAGR during the analysis period, owing to the presence of high populace countries such as India and China, which in turn increases the number of chances of suffering from accidents and trauma conditions and the increasing number of strategies and trends adopted by the market players.
COMPETITION ANALYSIS

Competitive analysis and profiles of the major players in the prosthetics, such as Aesthetic Prosthetics Inc., Aether Biomedical, B. Braun Melsungen AG, Blatchford Limited, Integra Lifesciences Holdings, Mobius Bionics LLC, Ossur, Ottobock SE and Co. KGaA, Steeper Group, Stryker Corporation, are provided in this report. There are some important players in the market such as B. Braun Melsungen AG, Blatchford Limited, Mobius Bionics LLC, Ossur, Ottobock SE and Co. KGaA. Various players have adopted strategies like product launch and acquisition as key developmental strategies to improve the product portfolio of the prosthetics market.  

Product Launch in the market

In June 2020, Unlimited Tomorrow, Inc., announced the launch of TrueLimb, a next-generation prosthetic arm that is available through a completely remote process that amputees can initiate online, broadening access to customized devices like this for the first time.

In September 2019, PSYONIC, announced the launch of its first product, the Ability Hand, at the American Orthotic & Prosthetic Association (AOPA) National Assembly.

Acquisitions in the market

In June 2020, Steeper Group, completed the acquisition of the Espire ElbowTM prostheses range from the U.S. based College Park Industries. Steeper Group intended to continue growth in the UK and the U.S. to provide more manufacturing and technical support for the Espire range.

In June 2020, Ossur had announced the completion of acquisition of College Park Industries. College Park is a global provider of prosthetic devices and supporting services headquartered in Michigan, U.S.

In February 2019, Össur acquired the technology related to the development of a powered ankle prosthesis from SpringActive, Inc., a privately held engineering firm that specializes in computer controlled prosthetic devices and industrial exo-systems. This acquisition concludes a multi-year collaboration where the teams from Össur and SpringActive explored the technology’s potential to spread across multiple product platforms within Össur.

Key Benefits For Stakeholders

  • This report provides a quantitative analysis of the market segments, current trends, estimations, and dynamics of the prosthetics market analysis from 2021 to 2031 to identify the prevailing Prosthetics Market Opportunity.
  • The market research is offered along with information related to key drivers, restraints, and opportunities.
  • Porter's five forces analysis highlights the potency of buyers and suppliers to enable stakeholders make profit-oriented business decisions and strengthen their supplier-buyer network.
  • In-depth analysis of the prosthetics market segmentation assists to determine the prevailing market opportunities.
  • Major countries in each region are mapped according to their revenue contribution to the global market.
  • Market player positioning facilitates benchmarking and provides a clear understanding of the present position of the market players.
  • The report includes the analysis of the regional as well as global prosthetics market trends, key players, market segments, application areas, and market growth strategies.

Prosthetics Market Report Highlights

Aspects Details
Market Size By 2031 USD 2.5 billion
Growth Rate CAGR of 4.5%
Forecast period 2021 - 2031
Report Pages 220
By Product
  • Upper Extremity Prosthetics
  • Lower Extremity Prosthetics
  • Others
By Design
  • Exoskeletal Design
  • Endoskeletal Design
By End User
  • Prosthetics Clinics
  • Hospitals
  • Others
By Region
  • North America  (U.S., Canada, Mexico)
  • Europe  (Germany, France, UK, Italy, Spain, Rest of Europe)
  • Asia-Pacific  (China, Japan, India, Australia, South Korea, Rest of Asia-Pacific)
  • LAMEA  (Brazil, Saudi Arabia, South Africa, Rest of LAMEA)
Key Market Players Mobius Bionics LLC, Stryker Corporation, Össur, Aesthetic Prosthetics Inc., Aether Biomedical , Steeper Group, Blatchford Limited, Ottobock SE & Co. KGaA (suit X), Integra LifeSciences Holdings, B. Braun Melsungen AG
 
  • CHAPTER 1: INTRODUCTION

    • 1.1. Report description

    • 1.2. Key market segments

    • 1.3. Key benefits to the stakeholders

    • 1.4. Research Methodology

      • 1.4.1. Primary research

      • 1.4.2. Secondary research

      • 1.4.3. Analyst tools and models

  • CHAPTER 2: EXECUTIVE SUMMARY

    • 2.1. CXO Perspective

  • CHAPTER 3: MARKET OVERVIEW

    • 3.1. Market definition and scope

    • 3.2. Key findings

      • 3.2.1. Top impacting factors

      • 3.2.2. Top investment pockets

    • 3.3. Porter’s five forces analysis

      • 3.3.1. Bargaining power of suppliers

      • 3.3.2. Bargaining power of buyers

      • 3.3.3. Threat of substitutes

      • 3.3.4. Threat of new entrants

      • 3.3.5. Intensity of rivalry

    • 3.4. Market dynamics

      • 3.4.1. Drivers

        • 3.4.1.1. Increase in advancements in prosthetics
        • 3.4.1.2. Increase in the number of accidents and trauma
        • 3.4.1.3. Increase in prevalence of bone conditions

      • 3.4.2. Restraints

        • 3.4.2.1. High cost associated with prosthetics and greater maintenance associated with these device
        • 3.4.2.2. Lack in the reimbursement policies for amputation

      • 3.4.3. Opportunities

        • 3.4.3.1. Increase in the government support for the amputees

    • 3.5. COVID-19 Impact Analysis on the market

  • CHAPTER 4: PROSTHETICS MARKET, BY PRODUCT

    • 4.1. Overview

      • 4.1.1. Market size and forecast

    • 4.2. Upper Extremity Prosthetics

      • 4.2.1. Key market trends, growth factors and opportunities

      • 4.2.2. Market size and forecast, by region

      • 4.2.3. Market share analysis by country

    • 4.3. Lower Extremity Prosthetics

      • 4.3.1. Key market trends, growth factors and opportunities

      • 4.3.2. Market size and forecast, by region

      • 4.3.3. Market share analysis by country

    • 4.4. Others

      • 4.4.1. Key market trends, growth factors and opportunities

      • 4.4.2. Market size and forecast, by region

      • 4.4.3. Market share analysis by country

  • CHAPTER 5: PROSTHETICS MARKET, BY DESIGN

    • 5.1. Overview

      • 5.1.1. Market size and forecast

    • 5.2. Exoskeletal Design

      • 5.2.1. Key market trends, growth factors and opportunities

      • 5.2.2. Market size and forecast, by region

      • 5.2.3. Market share analysis by country

    • 5.3. Endoskeletal Design

      • 5.3.1. Key market trends, growth factors and opportunities

      • 5.3.2. Market size and forecast, by region

      • 5.3.3. Market share analysis by country

  • CHAPTER 6: PROSTHETICS MARKET, BY END USER

    • 6.1. Overview

      • 6.1.1. Market size and forecast

    • 6.2. Prosthetics Clinics

      • 6.2.1. Key market trends, growth factors and opportunities

      • 6.2.2. Market size and forecast, by region

      • 6.2.3. Market share analysis by country

    • 6.3. Hospitals

      • 6.3.1. Key market trends, growth factors and opportunities

      • 6.3.2. Market size and forecast, by region

      • 6.3.3. Market share analysis by country

    • 6.4. Others

      • 6.4.1. Key market trends, growth factors and opportunities

      • 6.4.2. Market size and forecast, by region

      • 6.4.3. Market share analysis by country

  • CHAPTER 7: PROSTHETICS MARKET, BY REGION

    • 7.1. Overview

      • 7.1.1. Market size and forecast By Region

    • 7.2. North America

      • 7.2.1. Key trends and opportunities

      • 7.2.2. Market size and forecast, by Product

      • 7.2.3. Market size and forecast, by Design

      • 7.2.4. Market size and forecast, by End User

      • 7.2.5. Market size and forecast, by country

        • 7.2.5.1. U.S.
          • 7.2.5.1.1. Key market trends, growth factors and opportunities
          • 7.2.5.1.2. Market size and forecast, by Product
          • 7.2.5.1.3. Market size and forecast, by Design
          • 7.2.5.1.4. Market size and forecast, by End User
        • 7.2.5.2. Canada
          • 7.2.5.2.1. Key market trends, growth factors and opportunities
          • 7.2.5.2.2. Market size and forecast, by Product
          • 7.2.5.2.3. Market size and forecast, by Design
          • 7.2.5.2.4. Market size and forecast, by End User
        • 7.2.5.3. Mexico
          • 7.2.5.3.1. Key market trends, growth factors and opportunities
          • 7.2.5.3.2. Market size and forecast, by Product
          • 7.2.5.3.3. Market size and forecast, by Design
          • 7.2.5.3.4. Market size and forecast, by End User
    • 7.3. Europe

      • 7.3.1. Key trends and opportunities

      • 7.3.2. Market size and forecast, by Product

      • 7.3.3. Market size and forecast, by Design

      • 7.3.4. Market size and forecast, by End User

      • 7.3.5. Market size and forecast, by country

        • 7.3.5.1. Germany
          • 7.3.5.1.1. Key market trends, growth factors and opportunities
          • 7.3.5.1.2. Market size and forecast, by Product
          • 7.3.5.1.3. Market size and forecast, by Design
          • 7.3.5.1.4. Market size and forecast, by End User
        • 7.3.5.2. France
          • 7.3.5.2.1. Key market trends, growth factors and opportunities
          • 7.3.5.2.2. Market size and forecast, by Product
          • 7.3.5.2.3. Market size and forecast, by Design
          • 7.3.5.2.4. Market size and forecast, by End User
        • 7.3.5.3. UK
          • 7.3.5.3.1. Key market trends, growth factors and opportunities
          • 7.3.5.3.2. Market size and forecast, by Product
          • 7.3.5.3.3. Market size and forecast, by Design
          • 7.3.5.3.4. Market size and forecast, by End User
        • 7.3.5.4. Italy
          • 7.3.5.4.1. Key market trends, growth factors and opportunities
          • 7.3.5.4.2. Market size and forecast, by Product
          • 7.3.5.4.3. Market size and forecast, by Design
          • 7.3.5.4.4. Market size and forecast, by End User
        • 7.3.5.5. Spain
          • 7.3.5.5.1. Key market trends, growth factors and opportunities
          • 7.3.5.5.2. Market size and forecast, by Product
          • 7.3.5.5.3. Market size and forecast, by Design
          • 7.3.5.5.4. Market size and forecast, by End User
        • 7.3.5.6. Rest of Europe
          • 7.3.5.6.1. Key market trends, growth factors and opportunities
          • 7.3.5.6.2. Market size and forecast, by Product
          • 7.3.5.6.3. Market size and forecast, by Design
          • 7.3.5.6.4. Market size and forecast, by End User
    • 7.4. Asia-Pacific

      • 7.4.1. Key trends and opportunities

      • 7.4.2. Market size and forecast, by Product

      • 7.4.3. Market size and forecast, by Design

      • 7.4.4. Market size and forecast, by End User

      • 7.4.5. Market size and forecast, by country

        • 7.4.5.1. China
          • 7.4.5.1.1. Key market trends, growth factors and opportunities
          • 7.4.5.1.2. Market size and forecast, by Product
          • 7.4.5.1.3. Market size and forecast, by Design
          • 7.4.5.1.4. Market size and forecast, by End User
        • 7.4.5.2. Japan
          • 7.4.5.2.1. Key market trends, growth factors and opportunities
          • 7.4.5.2.2. Market size and forecast, by Product
          • 7.4.5.2.3. Market size and forecast, by Design
          • 7.4.5.2.4. Market size and forecast, by End User
        • 7.4.5.3. India
          • 7.4.5.3.1. Key market trends, growth factors and opportunities
          • 7.4.5.3.2. Market size and forecast, by Product
          • 7.4.5.3.3. Market size and forecast, by Design
          • 7.4.5.3.4. Market size and forecast, by End User
        • 7.4.5.4. Australia
          • 7.4.5.4.1. Key market trends, growth factors and opportunities
          • 7.4.5.4.2. Market size and forecast, by Product
          • 7.4.5.4.3. Market size and forecast, by Design
          • 7.4.5.4.4. Market size and forecast, by End User
        • 7.4.5.5. South Korea
          • 7.4.5.5.1. Key market trends, growth factors and opportunities
          • 7.4.5.5.2. Market size and forecast, by Product
          • 7.4.5.5.3. Market size and forecast, by Design
          • 7.4.5.5.4. Market size and forecast, by End User
        • 7.4.5.6. Rest of Asia-Pacific
          • 7.4.5.6.1. Key market trends, growth factors and opportunities
          • 7.4.5.6.2. Market size and forecast, by Product
          • 7.4.5.6.3. Market size and forecast, by Design
          • 7.4.5.6.4. Market size and forecast, by End User
    • 7.5. LAMEA

      • 7.5.1. Key trends and opportunities

      • 7.5.2. Market size and forecast, by Product

      • 7.5.3. Market size and forecast, by Design

      • 7.5.4. Market size and forecast, by End User

      • 7.5.5. Market size and forecast, by country

        • 7.5.5.1. Brazil
          • 7.5.5.1.1. Key market trends, growth factors and opportunities
          • 7.5.5.1.2. Market size and forecast, by Product
          • 7.5.5.1.3. Market size and forecast, by Design
          • 7.5.5.1.4. Market size and forecast, by End User
        • 7.5.5.2. Saudi Arabia
          • 7.5.5.2.1. Key market trends, growth factors and opportunities
          • 7.5.5.2.2. Market size and forecast, by Product
          • 7.5.5.2.3. Market size and forecast, by Design
          • 7.5.5.2.4. Market size and forecast, by End User
        • 7.5.5.3. South Africa
          • 7.5.5.3.1. Key market trends, growth factors and opportunities
          • 7.5.5.3.2. Market size and forecast, by Product
          • 7.5.5.3.3. Market size and forecast, by Design
          • 7.5.5.3.4. Market size and forecast, by End User
        • 7.5.5.4. Rest of LAMEA
          • 7.5.5.4.1. Key market trends, growth factors and opportunities
          • 7.5.5.4.2. Market size and forecast, by Product
          • 7.5.5.4.3. Market size and forecast, by Design
          • 7.5.5.4.4. Market size and forecast, by End User
  • CHAPTER 8: COMPETITIVE LANDSCAPE

    • 8.1. Introduction

    • 8.2. Top winning strategies

    • 8.3. Product Mapping of Top 10 Player

    • 8.4. Competitive Dashboard

    • 8.5. Competitive Heatmap

    • 8.6. Top player positioning, 2021

  • CHAPTER 9: COMPANY PROFILES

    • 9.1. Aesthetic Prosthetics Inc.

      • 9.1.1. Company overview

      • 9.1.2. Key Executives

      • 9.1.3. Company snapshot

      • 9.1.4. Operating business segments

      • 9.1.5. Product portfolio

    • 9.2. Stryker Corporation

      • 9.2.1. Company overview

      • 9.2.2. Key Executives

      • 9.2.3. Company snapshot

      • 9.2.4. Operating business segments

      • 9.2.5. Product portfolio

      • 9.2.6. Business performance

    • 9.3. Össur

      • 9.3.1. Company overview

      • 9.3.2. Key Executives

      • 9.3.3. Company snapshot

      • 9.3.4. Operating business segments

      • 9.3.5. Product portfolio

      • 9.3.6. Business performance

    • 9.4. Blatchford Limited

      • 9.4.1. Company overview

      • 9.4.2. Key Executives

      • 9.4.3. Company snapshot

      • 9.4.4. Operating business segments

      • 9.4.5. Product portfolio

    • 9.5. B. Braun Melsungen AG

      • 9.5.1. Company overview

      • 9.5.2. Key Executives

      • 9.5.3. Company snapshot

      • 9.5.4. Operating business segments

      • 9.5.5. Product portfolio

      • 9.5.6. Business performance

    • 9.6. Integra LifeSciences Holdings

      • 9.6.1. Company overview

      • 9.6.2. Key Executives

      • 9.6.3. Company snapshot

      • 9.6.4. Operating business segments

      • 9.6.5. Product portfolio

      • 9.6.6. Business performance

    • 9.7. Mobius Bionics LLC

      • 9.7.1. Company overview

      • 9.7.2. Key Executives

      • 9.7.3. Company snapshot

      • 9.7.4. Operating business segments

      • 9.7.5. Product portfolio

    • 9.8. Aether Biomedical 

      • 9.8.1. Company overview

      • 9.8.2. Key Executives

      • 9.8.3. Company snapshot

      • 9.8.4. Operating business segments

      • 9.8.5. Product portfolio

    • 9.9. Steeper Group

      • 9.9.1. Company overview

      • 9.9.2. Key Executives

      • 9.9.3. Company snapshot

      • 9.9.4. Operating business segments

      • 9.9.5. Product portfolio

    • 9.10. Ottobock SE & Co. KGaA (suit X)

      • 9.10.1. Company overview

      • 9.10.2. Key Executives

      • 9.10.3. Company snapshot

      • 9.10.4. Operating business segments

      • 9.10.5. Product portfolio

  • LIST OF TABLES

  • TABLE 01. GLOBAL PROSTHETICS MARKET, BY PRODUCT, 2021-2031 (REVENUE, $MILLION)
    TABLE 02. PROSTHETICS MARKET FOR UPPER EXTREMITY PROSTHETICS, BY REGION, 2021-2031 (REVENUE, $MILLION)
    TABLE 03. PROSTHETICS MARKET FOR LOWER EXTREMITY PROSTHETICS, BY REGION, 2021-2031 (REVENUE, $MILLION)
    TABLE 04. PROSTHETICS MARKET FOR OTHERS, BY REGION, 2021-2031 (REVENUE, $MILLION)
    TABLE 05. GLOBAL PROSTHETICS MARKET, BY DESIGN, 2021-2031 (REVENUE, $MILLION)
    TABLE 06. PROSTHETICS MARKET FOR EXOSKELETAL DESIGN, BY REGION, 2021-2031 (REVENUE, $MILLION)
    TABLE 07. PROSTHETICS MARKET FOR ENDOSKELETAL DESIGN, BY REGION, 2021-2031 (REVENUE, $MILLION)
    TABLE 08. GLOBAL PROSTHETICS MARKET, BY END USER, 2021-2031 (REVENUE, $MILLION)
    TABLE 09. PROSTHETICS MARKET FOR PROSTHETICS CLINICS, BY REGION, 2021-2031 (REVENUE, $MILLION)
    TABLE 10. PROSTHETICS MARKET FOR HOSPITALS, BY REGION, 2021-2031 (REVENUE, $MILLION)
    TABLE 11. PROSTHETICS MARKET FOR OTHERS, BY REGION, 2021-2031 (REVENUE, $MILLION)
    TABLE 12. PROSTHETICS MARKET, BY REGION, 2021-2031 (REVENUE, $MILLION)
    TABLE 13. NORTH AMERICA PROSTHETICS MARKET, BY PRODUCT, 2021-2031 (REVENUE, $MILLION)
    TABLE 14. NORTH AMERICA PROSTHETICS MARKET, BY DESIGN, 2021-2031 (REVENUE, $MILLION)
    TABLE 15. NORTH AMERICA PROSTHETICS MARKET, BY END USER, 2021-2031 (REVENUE, $MILLION)
    TABLE 16. NORTH AMERICA PROSTHETICS MARKET, BY COUNTRY, 2021-2031 (REVENUE, $MILLION)
    TABLE 17. U.S. PROSTHETICS MARKET, BY PRODUCT, 2021-2031 (REVENUE, $MILLION)
    TABLE 18. U.S. PROSTHETICS MARKET, BY DESIGN, 2021-2031 (REVENUE, $MILLION)
    TABLE 19. U.S. PROSTHETICS MARKET, BY END USER, 2021-2031 (REVENUE, $MILLION)
    TABLE 20. CANADA PROSTHETICS MARKET, BY PRODUCT, 2021-2031 (REVENUE, $MILLION)
    TABLE 21. CANADA PROSTHETICS MARKET, BY DESIGN, 2021-2031 (REVENUE, $MILLION)
    TABLE 22. CANADA PROSTHETICS MARKET, BY END USER, 2021-2031 (REVENUE, $MILLION)
    TABLE 23. MEXICO PROSTHETICS MARKET, BY PRODUCT, 2021-2031 (REVENUE, $MILLION)
    TABLE 24. MEXICO PROSTHETICS MARKET, BY DESIGN, 2021-2031 (REVENUE, $MILLION)
    TABLE 25. MEXICO PROSTHETICS MARKET, BY END USER, 2021-2031 (REVENUE, $MILLION)
    TABLE 26. EUROPE PROSTHETICS MARKET, BY PRODUCT, 2021-2031 (REVENUE, $MILLION)
    TABLE 27. EUROPE PROSTHETICS MARKET, BY DESIGN, 2021-2031 (REVENUE, $MILLION)
    TABLE 28. EUROPE PROSTHETICS MARKET, BY END USER, 2021-2031 (REVENUE, $MILLION)
    TABLE 29. EUROPE PROSTHETICS MARKET, BY COUNTRY, 2021-2031 (REVENUE, $MILLION)
    TABLE 30. GERMANY PROSTHETICS MARKET, BY PRODUCT, 2021-2031 (REVENUE, $MILLION)
    TABLE 31. GERMANY PROSTHETICS MARKET, BY DESIGN, 2021-2031 (REVENUE, $MILLION)
    TABLE 32. GERMANY PROSTHETICS MARKET, BY END USER, 2021-2031 (REVENUE, $MILLION)
    TABLE 33. FRANCE PROSTHETICS MARKET, BY PRODUCT, 2021-2031 (REVENUE, $MILLION)
    TABLE 34. FRANCE PROSTHETICS MARKET, BY DESIGN, 2021-2031 (REVENUE, $MILLION)
    TABLE 35. FRANCE PROSTHETICS MARKET, BY END USER, 2021-2031 (REVENUE, $MILLION)
    TABLE 36. UK PROSTHETICS MARKET, BY PRODUCT, 2021-2031 (REVENUE, $MILLION)
    TABLE 37. UK PROSTHETICS MARKET, BY DESIGN, 2021-2031 (REVENUE, $MILLION)
    TABLE 38. UK PROSTHETICS MARKET, BY END USER, 2021-2031 (REVENUE, $MILLION)
    TABLE 39. ITALY PROSTHETICS MARKET, BY PRODUCT, 2021-2031 (REVENUE, $MILLION)
    TABLE 40. ITALY PROSTHETICS MARKET, BY DESIGN, 2021-2031 (REVENUE, $MILLION)
    TABLE 41. ITALY PROSTHETICS MARKET, BY END USER, 2021-2031 (REVENUE, $MILLION)
    TABLE 42. SPAIN PROSTHETICS MARKET, BY PRODUCT, 2021-2031 (REVENUE, $MILLION)
    TABLE 43. SPAIN PROSTHETICS MARKET, BY DESIGN, 2021-2031 (REVENUE, $MILLION)
    TABLE 44. SPAIN PROSTHETICS MARKET, BY END USER, 2021-2031 (REVENUE, $MILLION)
    TABLE 45. REST OF EUROPE PROSTHETICS MARKET, BY PRODUCT, 2021-2031 (REVENUE, $MILLION)
    TABLE 46. REST OF EUROPE PROSTHETICS MARKET, BY DESIGN, 2021-2031 (REVENUE, $MILLION)
    TABLE 47. REST OF EUROPE PROSTHETICS MARKET, BY END USER, 2021-2031 (REVENUE, $MILLION)
    TABLE 48. ASIA-PACIFIC PROSTHETICS MARKET, BY PRODUCT, 2021-2031 (REVENUE, $MILLION)
    TABLE 49. ASIA-PACIFIC PROSTHETICS MARKET, BY DESIGN, 2021-2031 (REVENUE, $MILLION)
    TABLE 50. ASIA-PACIFIC PROSTHETICS MARKET, BY END USER, 2021-2031 (REVENUE, $MILLION)
    TABLE 51. ASIA-PACIFIC PROSTHETICS MARKET, BY COUNTRY, 2021-2031 (REVENUE, $MILLION)
    TABLE 52. CHINA PROSTHETICS MARKET, BY PRODUCT, 2021-2031 (REVENUE, $MILLION)
    TABLE 53. CHINA PROSTHETICS MARKET, BY DESIGN, 2021-2031 (REVENUE, $MILLION)
    TABLE 54. CHINA PROSTHETICS MARKET, BY END USER, 2021-2031 (REVENUE, $MILLION)
    TABLE 55. JAPAN PROSTHETICS MARKET, BY PRODUCT, 2021-2031 (REVENUE, $MILLION)
    TABLE 56. JAPAN PROSTHETICS MARKET, BY DESIGN, 2021-2031 (REVENUE, $MILLION)
    TABLE 57. JAPAN PROSTHETICS MARKET, BY END USER, 2021-2031 (REVENUE, $MILLION)
    TABLE 58. INDIA PROSTHETICS MARKET, BY PRODUCT, 2021-2031 (REVENUE, $MILLION)
    TABLE 59. INDIA PROSTHETICS MARKET, BY DESIGN, 2021-2031 (REVENUE, $MILLION)
    TABLE 60. INDIA PROSTHETICS MARKET, BY END USER, 2021-2031 (REVENUE, $MILLION)
    TABLE 61. AUSTRALIA PROSTHETICS MARKET, BY PRODUCT, 2021-2031 (REVENUE, $MILLION)
    TABLE 62. AUSTRALIA PROSTHETICS MARKET, BY DESIGN, 2021-2031 (REVENUE, $MILLION)
    TABLE 63. AUSTRALIA PROSTHETICS MARKET, BY END USER, 2021-2031 (REVENUE, $MILLION)
    TABLE 64. SOUTH KOREA PROSTHETICS MARKET, BY PRODUCT, 2021-2031 (REVENUE, $MILLION)
    TABLE 65. SOUTH KOREA PROSTHETICS MARKET, BY DESIGN, 2021-2031 (REVENUE, $MILLION)
    TABLE 66. SOUTH KOREA PROSTHETICS MARKET, BY END USER, 2021-2031 (REVENUE, $MILLION)
    TABLE 67. REST OF ASIA-PACIFIC PROSTHETICS MARKET, BY PRODUCT, 2021-2031 (REVENUE, $MILLION)
    TABLE 68. REST OF ASIA-PACIFIC PROSTHETICS MARKET, BY DESIGN, 2021-2031 (REVENUE, $MILLION)
    TABLE 69. REST OF ASIA-PACIFIC PROSTHETICS MARKET, BY END USER, 2021-2031 (REVENUE, $MILLION)
    TABLE 70. LAMEA PROSTHETICS MARKET, BY PRODUCT, 2021-2031 (REVENUE, $MILLION)
    TABLE 71. LAMEA PROSTHETICS MARKET, BY DESIGN, 2021-2031 (REVENUE, $MILLION)
    TABLE 72. LAMEA PROSTHETICS MARKET, BY END USER, 2021-2031 (REVENUE, $MILLION)
    TABLE 73. LAMEA PROSTHETICS MARKET, BY COUNTRY, 2021-2031 (REVENUE, $MILLION)
    TABLE 74. BRAZIL PROSTHETICS MARKET, BY PRODUCT, 2021-2031 (REVENUE, $MILLION)
    TABLE 75. BRAZIL PROSTHETICS MARKET, BY DESIGN, 2021-2031 (REVENUE, $MILLION)
    TABLE 76. BRAZIL PROSTHETICS MARKET, BY END USER, 2021-2031 (REVENUE, $MILLION)
    TABLE 77. SAUDI ARABIA PROSTHETICS MARKET, BY PRODUCT, 2021-2031 (REVENUE, $MILLION)
    TABLE 78. SAUDI ARABIA PROSTHETICS MARKET, BY DESIGN, 2021-2031 (REVENUE, $MILLION)
    TABLE 79. SAUDI ARABIA PROSTHETICS MARKET, BY END USER, 2021-2031 (REVENUE, $MILLION)
    TABLE 80. SOUTH AFRICA PROSTHETICS MARKET, BY PRODUCT, 2021-2031 (REVENUE, $MILLION)
    TABLE 81. SOUTH AFRICA PROSTHETICS MARKET, BY DESIGN, 2021-2031 (REVENUE, $MILLION)
    TABLE 82. SOUTH AFRICA PROSTHETICS MARKET, BY END USER, 2021-2031 (REVENUE, $MILLION)
    TABLE 83. REST OF LAMEA PROSTHETICS MARKET, BY PRODUCT, 2021-2031 (REVENUE, $MILLION)
    TABLE 84. REST OF LAMEA PROSTHETICS MARKET, BY DESIGN, 2021-2031 (REVENUE, $MILLION)
    TABLE 85. REST OF LAMEA PROSTHETICS MARKET, BY END USER, 2021-2031 (REVENUE, $MILLION)
    TABLE 86. AESTHETIC PROSTHETICS INC.: KEY EXECUTIVES
    TABLE 87. AESTHETIC PROSTHETICS INC.: COMPANY SNAPSHOT
    TABLE 88. AESTHETIC PROSTHETICS INC.: PRODUCT SEGMENTS
    TABLE 89. AESTHETIC PROSTHETICS INC.: PRODUCT PORTFOLIO
    TABLE 90. STRYKER CORPORATION: KEY EXECUTIVES
    TABLE 91. STRYKER CORPORATION: COMPANY SNAPSHOT
    TABLE 92. STRYKER CORPORATION: PRODUCT SEGMENTS
    TABLE 93. STRYKER CORPORATION: PRODUCT PORTFOLIO
    TABLE 94. ÖSSUR: KEY EXECUTIVES
    TABLE 95. ÖSSUR: COMPANY SNAPSHOT
    TABLE 96. ÖSSUR: PRODUCT SEGMENTS
    TABLE 97. ÖSSUR: PRODUCT PORTFOLIO
    TABLE 98. BLATCHFORD LIMITED: KEY EXECUTIVES
    TABLE 99. BLATCHFORD LIMITED: COMPANY SNAPSHOT
    TABLE 100. BLATCHFORD LIMITED: PRODUCT SEGMENTS
    TABLE 101. BLATCHFORD LIMITED: PRODUCT PORTFOLIO
    TABLE 102. B. BRAUN MELSUNGEN AG: KEY EXECUTIVES
    TABLE 103. B. BRAUN MELSUNGEN AG: COMPANY SNAPSHOT
    TABLE 104. B. BRAUN MELSUNGEN AG: PRODUCT SEGMENTS
    TABLE 105. B. BRAUN MELSUNGEN AG: PRODUCT PORTFOLIO
    TABLE 106. INTEGRA LIFESCIENCES HOLDINGS: KEY EXECUTIVES
    TABLE 107. INTEGRA LIFESCIENCES HOLDINGS: COMPANY SNAPSHOT
    TABLE 108. INTEGRA LIFESCIENCES HOLDINGS: PRODUCT SEGMENTS
    TABLE 109. INTEGRA LIFESCIENCES HOLDINGS: PRODUCT PORTFOLIO
    TABLE 110. MOBIUS BIONICS LLC: KEY EXECUTIVES
    TABLE 111. MOBIUS BIONICS LLC: COMPANY SNAPSHOT
    TABLE 112. MOBIUS BIONICS LLC: PRODUCT SEGMENTS
    TABLE 113. MOBIUS BIONICS LLC: PRODUCT PORTFOLIO
    TABLE 114. AETHER BIOMEDICAL : KEY EXECUTIVES
    TABLE 115. AETHER BIOMEDICAL : COMPANY SNAPSHOT
    TABLE 116. AETHER BIOMEDICAL : PRODUCT SEGMENTS
    TABLE 117. AETHER BIOMEDICAL : PRODUCT PORTFOLIO
    TABLE 118. STEEPER GROUP: KEY EXECUTIVES
    TABLE 119. STEEPER GROUP: COMPANY SNAPSHOT
    TABLE 120. STEEPER GROUP: PRODUCT SEGMENTS
    TABLE 121. STEEPER GROUP: PRODUCT PORTFOLIO
    TABLE 122. OTTOBOCK SE & CO. KGAA (SUIT X): KEY EXECUTIVES
    TABLE 123. OTTOBOCK SE & CO. KGAA (SUIT X): COMPANY SNAPSHOT
    TABLE 124. OTTOBOCK SE & CO. KGAA (SUIT X): PRODUCT SEGMENTS
    TABLE 125. OTTOBOCK SE & CO. KGAA (SUIT X): PRODUCT PORTFOLIO
  • LIST OF FIGURES

  • FIGURE 01. PROSTHETICS MARKET, 2021-2031
    FIGURE 02. SEGMENTATION OF PROSTHETICS MARKET, 2021-2031
    FIGURE 03. TOP INVESTMENT POCKETS IN PROSTHETICS MARKET (2022-2031)
    FIGURE 04. HIGH BARGAINING POWER OF SUPPLIERS
    FIGURE 05. MODERATE BARGAINING POWER OF BUYERS
    FIGURE 06. MODERATE THREAT OF SUBSTITUTES
    FIGURE 07. MODERATE THREAT OF NEW ENTRANTS
    FIGURE 08. MODERATE INTENSITY OF RIVALRY
    FIGURE 09. DRIVERS, RESTRAINTS AND OPPORTUNITIES: GLOBALPROSTHETICS MARKET
    FIGURE 10. PROSTHETICS MARKET, BY PRODUCT, 2021(%)
    FIGURE 11. COMPARATIVE SHARE ANALYSIS OF PROSTHETICS MARKET FOR UPPER EXTREMITY PROSTHETICS, BY COUNTRY 2021-2031(%)
    FIGURE 12. COMPARATIVE SHARE ANALYSIS OF PROSTHETICS MARKET FOR LOWER EXTREMITY PROSTHETICS, BY COUNTRY 2021-2031(%)
    FIGURE 13. COMPARATIVE SHARE ANALYSIS OF PROSTHETICS MARKET FOR OTHERS, BY COUNTRY 2021-2031(%)
    FIGURE 14. PROSTHETICS MARKET, BY DESIGN, 2021(%)
    FIGURE 15. COMPARATIVE SHARE ANALYSIS OF PROSTHETICS MARKET FOR EXOSKELETAL DESIGN, BY COUNTRY 2021-2031(%)
    FIGURE 16. COMPARATIVE SHARE ANALYSIS OF PROSTHETICS MARKET FOR ENDOSKELETAL DESIGN, BY COUNTRY 2021-2031(%)
    FIGURE 17. PROSTHETICS MARKET, BY END USER, 2021(%)
    FIGURE 18. COMPARATIVE SHARE ANALYSIS OF PROSTHETICS MARKET FOR PROSTHETICS CLINICS, BY COUNTRY 2021-2031(%)
    FIGURE 19. COMPARATIVE SHARE ANALYSIS OF PROSTHETICS MARKET FOR HOSPITALS, BY COUNTRY 2021-2031(%)
    FIGURE 20. COMPARATIVE SHARE ANALYSIS OF PROSTHETICS MARKET FOR OTHERS, BY COUNTRY 2021-2031(%)
    FIGURE 21. PROSTHETICS MARKET BY REGION, 2021
    FIGURE 22. U.S. PROSTHETICS MARKET, 2021-2031 ($MILLION)
    FIGURE 23. CANADA PROSTHETICS MARKET, 2021-2031 ($MILLION)
    FIGURE 24. MEXICO PROSTHETICS MARKET, 2021-2031 ($MILLION)
    FIGURE 25. GERMANY PROSTHETICS MARKET, 2021-2031 ($MILLION)
    FIGURE 26. FRANCE PROSTHETICS MARKET, 2021-2031 ($MILLION)
    FIGURE 27. UK PROSTHETICS MARKET, 2021-2031 ($MILLION)
    FIGURE 28. ITALY PROSTHETICS MARKET, 2021-2031 ($MILLION)
    FIGURE 29. SPAIN PROSTHETICS MARKET, 2021-2031 ($MILLION)
    FIGURE 30. REST OF EUROPE PROSTHETICS MARKET, 2021-2031 ($MILLION)
    FIGURE 31. CHINA PROSTHETICS MARKET, 2021-2031 ($MILLION)
    FIGURE 32. JAPAN PROSTHETICS MARKET, 2021-2031 ($MILLION)
    FIGURE 33. INDIA PROSTHETICS MARKET, 2021-2031 ($MILLION)
    FIGURE 34. AUSTRALIA PROSTHETICS MARKET, 2021-2031 ($MILLION)
    FIGURE 35. SOUTH KOREA PROSTHETICS MARKET, 2021-2031 ($MILLION)
    FIGURE 36. REST OF ASIA-PACIFIC PROSTHETICS MARKET, 2021-2031 ($MILLION)
    FIGURE 37. BRAZIL PROSTHETICS MARKET, 2021-2031 ($MILLION)
    FIGURE 38. SAUDI ARABIA PROSTHETICS MARKET, 2021-2031 ($MILLION)
    FIGURE 39. SOUTH AFRICA PROSTHETICS MARKET, 2021-2031 ($MILLION)
    FIGURE 40. REST OF LAMEA PROSTHETICS MARKET, 2021-2031 ($MILLION)
    FIGURE 41. TOP WINNING STRATEGIES, BY YEAR
    FIGURE 42. TOP WINNING STRATEGIES, BY DEVELOPMENT
    FIGURE 43. TOP WINNING STRATEGIES, BY COMPANY
    FIGURE 44. PRODUCT MAPPING OF TOP 10 PLAYERS
    FIGURE 45. COMPETITIVE DASHBOARD
    FIGURE 46. COMPETITIVE HEATMAP: PROSTHETICS MARKET
    FIGURE 47. TOP PLAYER POSITIONING, 2021
    FIGURE 48. STRYKER CORPORATION: NET REVENUE, 2019-2021 ($MILLION)
    FIGURE 49. STRYKER CORPORATION: REVENUE SHARE BY SEGMENT, 2021 (%)
    FIGURE 50. STRYKER CORPORATION: REVENUE SHARE BY REGION, 2021 (%)
    FIGURE 51. ÖSSUR: NET SALES, 2019-2021 ($MILLION)
    FIGURE 52. ÖSSUR: REVENUE SHARE BY SEGMENT, 2021 (%)
    FIGURE 53. ÖSSUR: REVENUE SHARE BY REGION, 2021 (%)
    FIGURE 54. B. BRAUN MELSUNGEN AG: NET SALES, 2019-2021 ($MILLION)
    FIGURE 55. B. BRAUN MELSUNGEN AG: REVENUE SHARE BY REGION, 2021 (%)
    FIGURE 56. B. BRAUN MELSUNGEN AG: REVENUE SHARE BY SEGMENT, 2021 (%)
    FIGURE 57. INTEGRA LIFESCIENCES HOLDINGS: NET REVENUE, 2019-2021 ($MILLION)
    FIGURE 58. INTEGRA LIFESCIENCES HOLDINGS: RESEARCH & DEVELOPMENT EXPENDITURE, 2019-2021
    FIGURE 59. INTEGRA LIFESCIENCES HOLDINGS: REVENUE SHARE BY REGION, 2021 (%)
    FIGURE 60. INTEGRA LIFESCIENCES HOLDINGS: REVENUE SHARE BY SEGMENT, 2021 (%)


In accordance with several interviews conducted, a prosthetic device or prosthesis plays a significant role in rehabilitation when an arm or other extremity is amputated or lost. For many people, an artificial limb improves mobility and the ability to manage daily activities, as well as provides the means to stay independent. A number of factors that are involved in choosing a prosthesis include the location and level of the amputation, the condition of the remaining limb, and the activity level, particularly for a prosthetic leg or foot. 

Asia-Pacific is expected to witness the highest CAGR during the analysis period, owing to the increase in the research and development expenditure for the development of innovative and advanced products that increases the demand for the advanced prosthetic devices packed with enhanced benefits, increase in awareness about the prosthetic amputation procedures and increase in government support for amputation procedures among the amputees and other related trends adopted by the market players. 

PURCHASE OPTIONS

Call or Email us

U.S.-Canada Toll-free: +1-800-792-5285
Int'l : +1-503-894-6022
Europe : +44-845-528-1300
Email : help@alliedmarketresearch.com
 
FREQUENTLY ASKED QUESTIONS?

A. The total market value of the prosthetics Market is $1604.69 million in 2021.

A. The forecast period in the report is from 2022 to 2031.

A. North America is the largest regional market for Prosthetics.

A. The market value of the prosthetics Market in 2022 was $1670.48 million.

A. The top companies that hold the market share in the prosthetics Market are Aesthetic Prosthetics Inc., Aether Biomedical, B. Braun Melsungen AG, Blatchford Limited, Integra Lifesciences Holdings, Mobius Bionics LLC, Ossur, Ottobock SE and Co. KGaA, Steeper Group, Stryker Corporation.

A. Yes, prosthetics companies are profiled in the report.

A. The key trends in the prosthetics Market are increasing adoption of advanced prosthetics, rising incidence of accidents, and a surge in technological advancement in prosthetics.

Looking for Customization?

 Customization Request

Have a Question?

 Speak with Analyst

Any Confusion?

 Inquire Before Buying

Have a glance of the Report

  Request Sample
RELATED TAGS

Purchase Full Report of
Prosthetics Market

Start reading instantly.
This Report and over 67,404+ more Reports, Available with Avenue Library. T&C*.

  • Online Only
  • $3,570
  • Online cloud access only
  • Restricted print, copy, paste & download
  • Read only
  • Free industry update
    (Within 180 days)
  • Free report update in next update cycle
    (Jan 2024 - Jan 2025)
  • Data Pack
  • $3,840
  • Restricted to one authorized user
  • One print only
  • Available in
    Excel
  • Free industry update
    (Within 180 days)
  •   Free report update in next update cycle
    (Jan 2024 - Jan 2025)
  • Single User
  • $5,730
  • Restricted to one authorized user
  • One print only
  • Available in
    PDF
  • Free industry update
    (Within 180 days)
  •   Free report update in next update cycle
    (Jan 2024 - Jan 2025)
  • Five Users
  • $6,450
  • Limited to five authorized users
  • Print upto five copies
  • Available in
    PDF
  • Free industry update
    (Within 180 days)
  •   Free report update in next update cycle
    (Jan 2024 - Jan 2025)
  • Enterprise
    License/PDF

  • $9,600
  • Unlimited
    within
    company/enterprise
  • Available in Excel & PDF
  • Free industry update
    (Within 180 days)
  •   Free report update in next update cycle
    (Jan 2024 - Jan 2025)
  • Library
    Membership

  • $999 $ 1,175
    Per User/ Per month/ Billed annually
  • Published Content
    E-access
  • Company Profiles
    E-access
  • Newly Added Content Access
  • 10 PDF
    Downloads
  • 5 Excel Data
    Pack Downloads
  • 250 Company Profiles PDF Downloads
  • Buy Now

*Taxes/Fees, if applicable will be added during checkout. All prices in USD

RELATED REPORTS
 

Why Allied Market Research?


Infallible Methodology

To ensure high-level data integrity, accurate analysis, and impeccable forecasts

Analyst Support

For complete satisfaction

Customization

On-demand customization of scope of the report to exactly meet your needs

TARGETED MARKET VIEW

Targeted market view to provide pertinent information and save time of readers

Get fresh content delivered

Get insights on topics that are crucial for your business. Stay abreast of your interest areas.

Get Industry Data Alerts

Why Allied Market Research?

Infallible Methodology

To ensure high-level data integrity, accurate analysis, and impeccable forecasts

Analyst Support

For complete satisfaction

Customization

On-demand customization of scope of the report to exactly meet your needs

TARGETED MARKET VIEW

Targeted market view to provide pertinent information and save time of readers