Report Code: A01439 | Dec 2016 | Pages: 160 | ||
Tables: 72 | Charts: 28 |
|
Pandemic disrupted the entire world and affected many industries.
Get detailed COVID-19 impact analysis on the Protein Labeling Market
Request Now !The protein labeling industry is valued at $2,002 million in 2015 and is estimated to reach $5,350 million by 2022, growing at a significant CAGR of 14.9% during the forecast period.
Proteins are the largest and most important biomolecules in a living organism, as they are vital to the functioning of an organism. Once they are formed within a cell, proteins interact with other biomolecules and carry out roles to keep the cell alive. Therefore, more importance is given to research the protein binding mechanism through specialized fields of studies, such as proteomics and protein chemistry. Most of these techniques focus on the ability to specifically tag proteins by creating genetic fusions, and thereby, imparting distinctive properties for selective protein visualization, manipulation, and entrapment within complex biochemical environments. Various strategies are used to carry out successful protein labeling.
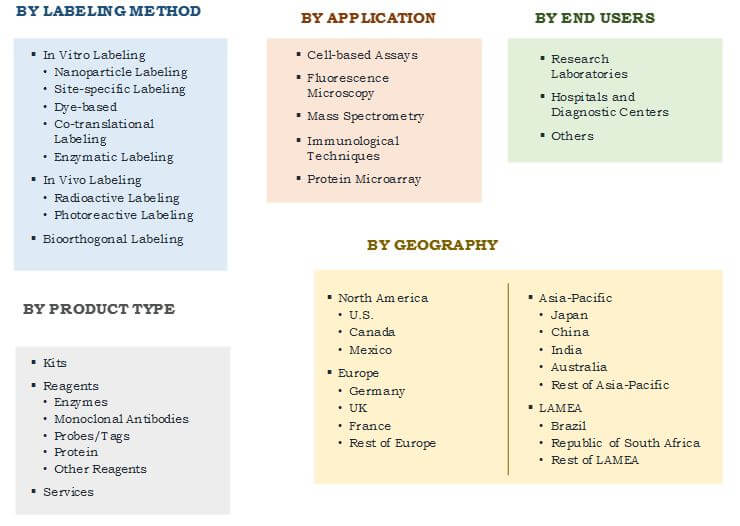
The report analyzes the protein labeling industry into four segments—labeling method, application, product type, and geography. By labeling method, the market is segmented into in vitro labeling, in vivo labeling, and bioorthogonal labeling. In vitro labeling is further segmented as nanoparticle labeling, site-specific labeling, dye-based labeling, co-translational labeling, and enzymatic labeling. On the other hand, in vivo labeling can be segmented as radioactive labeling, and photoreactive labeling. Based on application, the protein labeling market is mainly categorized into five segments—cell-based assays, fluorescence microscopy, mass spectrometry, immunological techniques, and protein microarray. Based on products, the protein labeling industry is segmented as, kits, reagents, and services. Reagents can be further segmented into enzymes, monoclonal antibodies, probes/tags, proteins, and other reagents. Based on end users, the market is segmented as research laboratories, hospitals, and diagnostic centers. Based on geography, the protein labeling market is categorized into North America, Europe, Asia-Pacific, andLAMEA.
GLOBAL PROTEIN LABELING MARKET SEGMENTATIONÂ
The protein labeling market is growing at a steady pace due to the increase in investments in the healthcare sector by government, thereby, fueling investments on R&D and proteomics research. Smaller companies enter the market with customized protein labeling kits, while the larger companies have focused on new product launch to customize according to the researchers’ requirements. Moreover, the acquisition of individual and private firms has helped the key players to increase their product portfolio and R&D activities in this market. For instance, in January 2016, Merck acquired IOmet Pharma Ltd., a private drug discovery company based in Edinburgh, UK to expand its immune-oncology program.
Agreement is another key strategy adopted by the larger companies to enrich their product portfolio and establish themselves. Moreover, to resolve the issue of high cost and wastage associated with the protein labeling process, many new and improved products are introduced in the market. For instance, in June 2016, Roche launched a product called Cobas e 801 module, which was a high-volume testing immunoassay solution. It offers high flexibility and continuous operation, while saving time, and reducing the amount of waste generated.
The key players profiled in this report include General Electric Company, Kaneka Corporation, LI-COR, Inc., Merck & Co., Inc., New England Biolabs, Inc., PerkinElmer, Inc., Promega Corporation, F. Hoffmann-LA Roche AG, Seracare Life Sciences, Inc., and Thermo Fisher Scientific, Inc. There are other players in the protein labeling market, which include Qiagen N.V., Active Motif, Inc., Takara Bio USA, Inc., Candor Bioscience GMBH, Innova Biosciences Ltd., Luminex Corporation, Bio-Rad Laboratories, Agilent Technologies, Inc., Caprion Biosciences, Nanotemper Technologies GMBH, and Biotium, Inc.
PROTEIN LABELING MARKET REVENUE, BY GEOGRAPHY
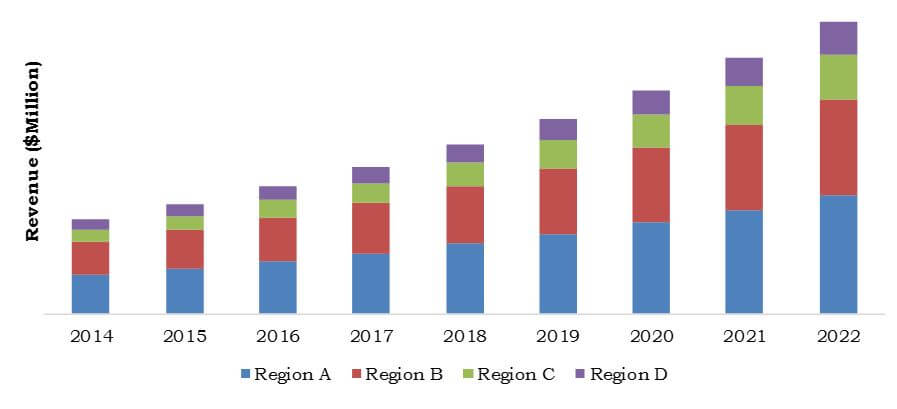
Asia-Pacific possesseshigh market potential for growth of protein labeling due to rise in demand for drug discovery and increase in focus on biotechnology industry. In addition, the increase in the use of proteomics has led to rapid developments in the market. The human proteome project by China is an attempt to decode the entire human genome to establish the basis of human physiology and pathology. Various government organizations and private companies, such as Celera genomics, and pharmaceutical and analytical instrumental companies have invested heavily in the human proteome project.
MEXICO PROTEIN LABELING MARKET, 2014–2022 ($MILLION)
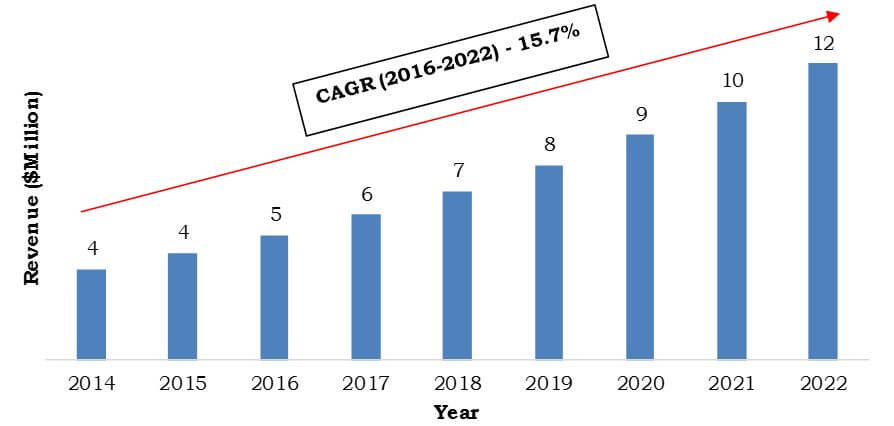
Mexico protein labeling market is projected to grow at a CAGR of 15.7% during the forecast period. Protein labeling research has achieved a boost in North America owing to the funding support provided by the government. For instance, in 2012, a scientist from Scripps Research Institute in California, U.S., received a grant of $1.5 million from the National Institutes of Health (NIH) to develop a new method for targeting RNA in genome. This new computer-based design method is anticipated to enable targeting the RNA in the human genome to discover new therapeutics.
GLOBAL PROTEIN LABELING MARKETÂ KEY SEGMENTS
The global protein labeling market segmentation is explained below:
Protein Labeling Market Report Highlights
Aspects | Details |
---|---|
By LABELING METHOD |
|
By APPLICATION |
|
By PRODUCT TYPE |
|
By END USERS |
|
By GEOGRAPHY |
|
Key Market Players | F. Hoffmann-La Roche AG, PROMEGA CORPORATION, SERACARE LIFE SCIENCES, INC., KANEKA CORPORATION, PERKINELMER, INC., GENERAL ELECTRIC COMPANY, MERCK & CO., INC., LI-COR, INC., THERMO FISHER SCIENTIFIC, INC., NEW ENGLAND BIOLABS, INC. |
Qiagen N.V., Active Motif, Inc., Takara Bio USA, Inc., Candor Bioscience GMBH, Innova Biosciences Ltd., Luminex Corporation, Bio-Rad Laboratories, Agilent Technologies, Inc., Caprion Biosciences, Nanotemper Technologies GMBH, Biotium, Inc. |
CHAPTER 1 INTRODUCTION
1.1. REPORT DESCRIPTION
1.2. KEY BENEFITS
1.3. KEY MARKET SEGMENTS
1.4. RESEARCH METHODOLOGY
1.4.1. Secondary research
1.4.2. Primary research
1.4.3. Analyst tools & models
CHAPTER 2 EXECUTIVE SUMMARY
2.1. CXO PERSPECTIVE
CHAPTER 3 MARKET OVERVIEW
3.1. MARKET DEFINITION AND SCOPE
3.2. KEY FINDINGS
3.2.1. Top investment pockets
3.2.2. Top winning strategies
3.3. PATENT ANALYSIS
3.3.1. Patent analysis, by year
3.3.2. Patent analysis, by country
3.4. TOP IMPACTING FACTORS
3.4.1. Drivers
3.4.1.1. Rise in healthcare expenditure
3.4.1.2. Increase in R&D investments
3.4.1.3. Growth in proteomics research
3.4.2. Restraints
3.4.2.1. Lack of skilled professionals
3.4.3. Opportunities
3.4.3.1. Training the professionals
3.4.3.2. Greater potency with reduced costs and increasing affordability
CHAPTER 4 GLOBAL PROTEIN LABELING MARKET, BY LABELING METHOD
4.1. OVERVIEW
4.1.1. Market size & forecast
4.1.2. In vitro labeling
4.1.2.1. Market size & forecast
4.1.2.2. Nanoparticle labeling
4.1.2.2.1. MARKET SIZE & FORECAST
4.1.2.3. Site-specific Labeling
4.1.2.3.1. MARKET SIZE & FORECAST
4.1.2.4. Dye-based
4.1.2.4.1. MARKET SIZE & FORECAST
4.1.2.5. Co-translational labeling
4.1.2.5.1. MARKET SIZE & FORECAST
4.1.2.6. Enzymatic Labeling
4.1.2.6.1. MARKET SIZE & FORECAST
4.1.3. In vivo labeling
4.1.3.1. Market size & forecast
4.1.3.2. Radioactive labeling
4.1.3.2.1. MARKET SIZE & FORECAST
4.1.3.3. Photoreactive labeling
4.1.3.3.1. MARKET SIZE & FORECAST
4.1.4. Bioorthogonal labeling
4.1.4.1. Market size & forecast
CHAPTER 5 GLOBAL PROTEIN LABELING MARKET, BY APPLICATION
5.1. OVERVIEW
5.1.1. Market size and forecast
5.1.2. Cellbased assays
5.1.2.1. Key market trends
5.1.2.2. Key growth factors and opportunities
5.1.2.3. Market size and forecast
5.1.3. Fluorescence microscopy
5.1.3.1. Key market trends
5.1.3.2. Key growth factors and opportunities
5.1.3.3. Market size and forecast
5.1.4. Mass spectrometry
5.1.4.1. Key market trends
5.1.4.2. Key growth factors and opportunities
5.1.4.3. Market size and forecast
5.1.5. Immunological techniques
5.1.5.1. Key market trends
5.1.5.2. Key growth factors and opportunities
5.1.5.3. Market size and forecast
5.1.6. Protein microarray
5.1.6.1. Key market trends
5.1.6.2. Key growth factors and opportunities
5.1.6.3. Market size and forecast
CHAPTER 6 GLOBAL PROTEIN LABELING MARKET, BY PRODUCT TYPE
6.1. OVERVIEW
6.1.1. Market size & forecast
6.2. KITS
6.2.1. Market size & forecast
6.3. REAGENTS
6.3.1. Market size & forecast
6.3.2. Enzymes
6.3.2.1. Market size & forecast
6.3.3. Monoclonal antibodies
6.3.3.1. Market size & forecast
6.3.4. Probes/Tags
6.3.4.1. Market size & forecast
6.3.5. Proteins
6.3.5.1. Market size & forecast
6.3.6. Other Reagents
6.3.6.1. Market size & forecast
6.4. SERVICES
6.4.1. Market size & forecast
CHAPTER 7 GLOBAL PROTEIN LABELING MARKET, BY END USERS
7.1. OVERVIEW
7.1.1. Market size & forecast
7.2. RESEARCH LABORATORIES
7.2.1. Market size & forecast
7.3. HOSPITALS AND DIAGNOSTIC CENTERS
7.3.1. Market size & forecast
7.4. OTHERS
7.4.1. Market size & forecast
CHAPTER 8 GLOBAL PROTEIN LABELING MARKET, BY GEOGRAPHY
8.1. OVERVIEW
8.1.1. Market size & forecast
8.2. NORTH AMERICA
8.2.1. Key market trends
8.2.2. Key growth factors and opportunities
8.2.3. Market size & forecast
8.2.4. U.S.
8.2.5. Canada
8.2.6. Mexico
8.3. EUROPE
8.3.1. Key market trends
8.3.2. Key growth factors and opportunities
8.3.3. Market size & forecast
8.3.4. Germany
8.3.5. France
8.3.6. UK
8.3.7. Rest of Europe
8.4. ASIA-PACIFIC
8.4.1. Key market trends
8.4.2. Key growth factors and opportunities
8.4.3. Market size & forecast
8.4.4. Japan
8.4.5. China
8.4.6. Australia
8.4.7. India
8.4.8. Rest of Asia-Pacific
8.5. LAMEA
8.5.1. Key market trends
8.5.2. Key growth factors and opportunities
8.5.3. Market size & forecast
8.5.4. Brazil
8.5.5. Republic of South Africa
8.5.6. Rest of LAMEA
CHAPTER 9 COMPANY PROFILES
9.1. GENERAL ELECTRIC COMPANY
9.1.1. Company overview
9.1.2. Operating business segments
9.1.3. Business performance
9.1.4. Key strategic moves & developments
9.2. PERKINELMER, INC.
9.2.1. Company overview
9.2.2. Operating business segments
9.2.3. Business performance
9.2.4. Key strategic moves & developments
9.3. THERMO FISHER SCIENTIFIC, INC.
9.3.1. Company overview
9.3.2. Operating business segments
9.3.3. Business performance
9.3.4. Key strategic moves & developments
9.4. MERCK & CO., INC.
9.4.1. Company overview
9.4.2. Operating business segments
9.4.3. Business performance
9.4.4. Key strategic moves & developments
9.5. F. Hoffmann-La Roche AG
9.5.1. Company overview
9.5.2. Operating business segments
9.5.3. Business performance
9.5.4. Key strategic moves & developments
9.6. KANEKA CORPORATION
9.6.1. Company overview
9.6.2. Operating business segments
9.6.3. Business performance
9.6.4. Key strategic moves & developments
9.7. PROMEGA CORPORATION
9.7.1. Company overview
9.7.2. Operating business segments
9.7.3. Business performance
9.7.4. Key strategic moves & developments
9.8. LI-COR, INC.
9.8.1. Company overview
9.8.2. Operating business segments
9.8.3. Business performance
9.8.4. Key strategic moves & developments
9.9. NEW ENGLAND BIOLABS, INC.
9.9.1. Company overview
9.9.2. Operating business segments
9.9.3. Business performance
9.9.4. Key strategic moves & developments
9.10. SERACARE LIFE SCIENCES, INC.
9.10.1. Company overview
9.10.2. Operating business segments
9.10.3. Business performance
9.10.4. Key strategic moves & developments
The other companies in the protein labeling market include:
*Profiles of these players are not included. The same will be included on request.
LIST OF TABLES
TABLE 1. PATENTS REGISTERED/APPROVED, BY YEAR (20132016)
TABLE 2. PATENTS REGISTERED/APPROVED, BY COUNTRY (2013-2016)
TABLE 3. GLOBAL PROTEIN LABELING MARKET, BY LABELING METHOD
TABLE 4. IN VITRO PROTEIN LABELING MARKET, BY REGION
TABLE 5. IN VITRO PROTEIN LABELING MARKET, BY TYPE
TABLE 6. NANOPARTICLE PROTEIN LABELING MARKET, BY REGION
TABLE 7. SITE-SPECIFIC PROTEIN LABELING MARKET, BY REGION
TABLE 8. DYE-BASED PROTEIN LABELING MARKET, BY REGION
TABLE 9. CO-TRANSLATIONAL PROTEIN LABELING MARKET, BY REGION
TABLE 10. ENZYMATIC PROTEIN LABELING MARKET, BY REGION
TABLE 11. IN VIVO PROTEIN LABELING MARKET, BY REGION
TABLE 12. IN VIVO PROTEIN LABELING MARKET, BY TYPE
TABLE 13. RADIOACTIVE PROTEIN LABELING MARKET, BY REGION
TABLE 14. PHOTOREACTIVE PROTEIN LABELING MARKET, BY REGION
TABLE 15. BIOORTHOGONAL PROTEIN LABELING MARKET, BY REGION
TABLE 16. GLOBAL PROTEIN LABELING MARKET, BY APPLICATION
TABLE 17. CELL-BASED ASSAYS PROTEIN LABELING MARKET, BY REGION
TABLE 18. FLUORESCENCE MICROSCOPYPROTEIN LABELING MARKET, BY REGION
TABLE 19. MASS SPECTROMETRY PROTEIN LABELING MARKET, BY REGION
TABLE 20. IMMUNOLOGICAL TECHNIQUES PROTEIN LABELING MARKET, BY REGION
TABLE 21. PROTEIN MICROARRAY PROTEIN LABELING MARKET, BY REGION
TABLE 22. GLOBAL PROTEIN LABELING MARKET, BY PRODUCT TYPE
TABLE 23. PROTEIN LABELING KITS MARKET, BY REGION
TABLE 24. PROTEIN LABELING REAGENTS MARKET, BY REGION
TABLE 25. PROTEIN LABELING REAGENTS MARKET, BY TYPE
TABLE 26. ENZYME BASED PROTEIN LABELING REAGENTS MARKET, BY REGION
TABLE 27. MONOCLONAL ANTIBODIES BASED PROTEIN LABELING REAGENTS MARKET, BY REGION
TABLE 28. PROBES/TAGS BASED PROTEIN LABELING REAGENTS MARKET, BY REGION
TABLE 29. PROTEIN BASED PROTEIN LABELING REAGENTS MARKET, BY REGION
TABLE 30. OTHER REAGENTS USED IN PROTEIN LABELING MARKET, BY REGION
TABLE 31. PROTEIN LABELING SERVICES MARKET, BY REGION
TABLE 32. GLOBAL PROTEIN LABELING MARKET, BY END USERS
TABLE 33. RESEARCH LABORATORIES PROTEIN LABELING MARKET, BY REGION
TABLE 34. HOSPITALS AND DIAGNOSTIC CENTERS PROTEIN LABELING MARKET, BY REGION
TABLE 35. OTHER END USERS PROTEIN LABELING MARKET, BY REGION
TABLE 36. GLOBAL PROTEIN LABELING MARKET, BY REGION
TABLE 37. NORTH AMERICA PROTEIN LABELING MARKET, BY LABELING METHOD
TABLE 38. NORTH AMERICA PROTEIN LABELING MARKET, BY APPLICATION
TABLE 39. NORTH AMERICA PROTEIN LABELING MARKET, BY PRODUCT TYPE
TABLE 40. NORTH AMERICA PROTEIN LABELING MARKET, BY END USER
TABLE 41. NORTH AMERICA PROTEIN LABELING MARKET, BY COUNTRY
TABLE 42. EUROPE PROTEIN LABELING MARKET, BY LABELING METHOD
TABLE 43. EUROPE PROTEIN LABELING MARKET, BY APPLICATION
TABLE 44. EUROPE PROTEIN LABELING MARKET, BY PRODUCT TYPE
TABLE 45. EUROPE PROTEIN LABELING MARKET, BY END USER
TABLE 46. EUROPE PROTEIN LABELING MARKET, BY COUNTRY
TABLE 47. ASIA-PACIFIC PROTEIN LABELING MARKET, BY LABELING METHOD
TABLE 48. ASIA-PACIFIC PROTEIN LABELING MARKET, BY APPLICATION
TABLE 49. ASIA-PACIFIC PROTEIN LABELING MARKET, BY PRODUCT TYPE
TABLE 50. ASIA-PACIFIC PROTEIN LABELING MARKET, BY END USER
TABLE 51. ASIA-PACIFIC PROTEIN LABELING MARKET, BY COUNTRY
TABLE 52. LAMEA PROTEIN LABELING MARKET, BY LABELING METHOD
TABLE 53. LAMEA PROTEIN LABELING MARKET, BY APPLICATION
TABLE 54. LAMEA PROTEIN LABELING MARKET, BY PRODUCT TYPE
TABLE 55. LAMEA PROTEIN LABELING MARKET, BY END USER
TABLE 56. LAMEA PROTEIN LABELING MARKET, BY COUNTRY
TABLE 57. GE: COMPANY SNAPSHOT
TABLE 58. GE: OPERATING SEGMENTS
TABLE 59. PERKINELMER: COMPANY SNAPSHOT
TABLE 60. PERKINELMER: OPERATING SEGMENTS
TABLE 61. THERMO FISHER: COMPANY SNAPSHOT
TABLE 62. THERMO FISHER: OPERATING SEGMENTS
TABLE 63. MERCK: COMPANY SNAPSHOT
TABLE 64. MERCK: OPERATING SEGMENTS
TABLE 65. ROCHE: COMPANY SNAPSHOT
TABLE 66. ROCHE: OPERATING SEGMENTS
TABLE 67. KANEKA: COMPANY SNAPSHOT
TABLE 68. KANEKA: OPERATING SEGMENTS
TABLE 69. PROMEGA: COMPANY SNAPSHOT
TABLE 70. LI-COR: COMPANY SNAPSHOT
TABLE 71. NEB: COMPANY SNAPSHOT
TABLE 72. SERACARE: COMPANY SNAPSHOT
LIST OF FIGURES
FIGURE 1. SEGMENTATION
FIGURE 2. TOP INVESTMENT POCKETS: GLOBAL PROTEIN LABELING MARKET, BY APPLICATION
FIGURE 3. TOP WINNING STRATEGIES: PERCENTAGE DISTRIBUTION (20132016)
FIGURE 4. TOP WINNING STRATEGIES, BY COMPANY (20132016)
FIGURE 5. PATENTS REGISTERED/APPROVED, BY YEAR (20132016)
FIGURE 6. PATENTS REGISTERED/APPROVED, BY COUNTRY (20132016)
FIGURE 7. U.S. PROTEIN LABELING MARKET, 2014-2022
FIGURE 8. CANADA PROTEIN LABELING MARKET, 2014-2022
FIGURE 9. MEXICO PROTEIN LABELING MARKET, 2014-2022
FIGURE 10. GERMANY PROTEIN LABELING MARKET, 2014-2022
FIGURE 11. FRANCE PROTEIN LABELING MARKET, 2014-2022
FIGURE 12. UK PROTEIN LABELING MARKET, 2014-2022
FIGURE 13. REST OF EUROPE PROTEIN LABELING MARKET, 2014-2022
FIGURE 14. JAPAN PROTEIN LABELING MARKET, 2014-2022
FIGURE 15. CHINA PROTEIN LABELING MARKET, 2014-2022
FIGURE 16. AUSTRALIA PROTEIN LABELING MARKET, 2014-2022
FIGURE 17. INDIA PROTEIN LABELING MARKET, 2014-2022
FIGURE 18. REST OF ASIA-PACIFIC PROTEIN LABELING MARKET, 2014-2022
FIGURE 19. BRAZIL PROTEIN LABELING MARKET, 2014-2022
FIGURE 20. REPUBLIC OF SOUTH AFRICA PROTEIN LABELING MARKET, 2014-2022
FIGURE 21. REST OF LAMEA PROTEIN LABELING MARKET, 2014-2022
FIGURE 22. GE FINANCIALS
FIGURE 23. PERKINELMER FINANCIALS
FIGURE 24. THERMO FISHER FINANCIALS
FIGURE 25. MERCK FINANCIALS
FIGURE 26. ROCHE FINANCIALS
FIGURE 27. KANEKA FINANCIALS
FIGURE 28. PROMEGA FINANCIALS
Start reading instantly.
This Report and over 66,944+ more Reports, Available with Avenue Library. T&C*.
Enterprise
License/PDF
Library
Membership
*Taxes/Fees, if applicable will be added during checkout. All prices in USD
To ensure high-level data integrity, accurate analysis, and impeccable forecasts
For complete satisfaction
On-demand customization of scope of the report to exactly meet your needs
Targeted market view to provide pertinent information and save time of readers
Get insights on topics that are crucial for your business. Stay abreast of your interest areas.
Get Industry Data AlertsTo ensure high-level data integrity, accurate analysis, and impeccable forecasts
For complete satisfaction
On-demand customization of scope of the report to exactly meet your needs
Targeted market view to provide pertinent information and save time of readers