0
2022
Public Cloud In Bfsi Market

Public Cloud in BFSI Market

by Component (Software, Services), by Type (Infrastructure as a Service, Platform as a Service, Software as a Service, Others), by Enterprise Size (Large Enterprises, SMEs), by End User (Banking, NBFCs, Others): Global Opportunity Analysis and Industry Forecast, 2021-2031

Report Code: A15481
Oct 2022 | Pages: 283
Tables: 164
Charts: 60
  • Formats*:

  • pdf

    Single User License, Five User
    License & Enterprise User License

  • xls

    Data Pack Excel License

  • ppt

    It comes with the additional cost
    of $2500.00 contact sales.


Public Cloud In BFSI Market Research, 2031

The global public cloud in bfsi market was valued at $49 billion in 2021, and is projected to reach $189.4 billion by 2031, growing at a CAGR of 14.6% from 2022 to 2031.

The COVID-19 pandemic boosted cloud use, as well as the shift to remote work and video conferencing. Cloud computing was rapidly being viewed as a digital transformation engine as well as a technology that promotes business continuity among businesses. Further, Furthermore, the key players also provided various advanced technologies such as artificial intelligence (AI) and machine learning (ML) in the cloud technologies which also contributed to the expansion of the market.

Public cloud service providers offer cloud-based services such as infrastructure-as-a-service (IaaS), platform-as-a-service (PaaS), or software-as-a-service (SaaS) to users for either a monthly or pay-per-use fee, eliminating the need for users to host these services on-site in their own data center. The data centers used by cloud service providers are divided into virtual computers and shared by tenants. Tenants have the option of paying for extra cloud-based services like software applications, application development tools, or storage in addition to simply renting the use of those virtual machines.
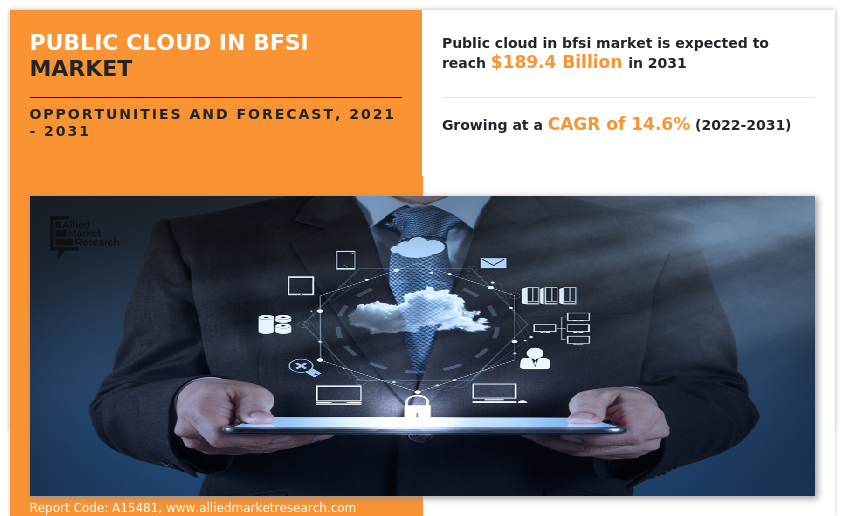
Growth in digital transformational strategies across the BFSI sector and rise in penetration of internet & mobile devices across the world boost growth of the global public cloud in BFSI market size. In addition, rise in demand for AI and machine learning propels popularity and positively impacts the growth of the market. However, regulatory complexities associated with data residency hampers the public cloud in BFSI market growth. On the contrary, an increase in the adoption of the Internet of Things (IoT) is expected to offer remunerative opportunities for the expansion of the public cloud in the BFSI market during the forecast period.

The report focuses on growth prospects, restraints, and trends of the global public cloud in BFSI industry.  The study provides Porter’s five forces analysis to understand the impact of various factors, such as the bargaining power of suppliers, competitive intensity of competitors, threat of new entrants, threat of substitutes, and bargaining power of buyers, on the global public cloud in BFSI market share.

Public Cloud in BFSI Market

The public cloud in bfsi market is segmented into Type, Component, Enterprise Size and End User.

Segment review

The public cloud in BFSI industry is segmented on the basis of component, type, enterprise size, end user and region. By component, the public cloud in BFSI market outlook is bifurcated into software and service. By type, the market is segmented into infrastructure as a service, platform as a service, software as a service, and others. By enterprise size, the market is bifurcated into large enterprises and SMEs. Based on end user the market is divided into banking, NBFCs and others. Region-wise, it is analyzed across North America, Europe, Asia-Pacific, and LAMEA.
Public Cloud in BFSI Market

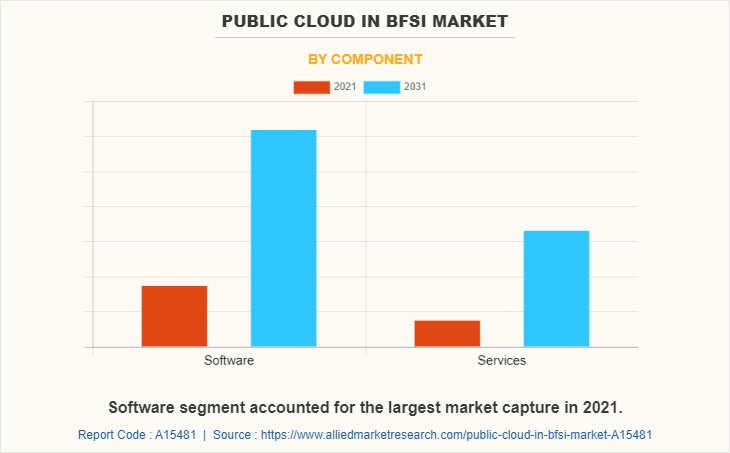
In terms of components, the software segment holds the largest share of the public cloud in BFSI market, as it offers a complete self-service software solution for clients or provides companies with building blocks to develop powerful self-service solutions by providing virtualization software which is boosting the demand of the segment. However, the services segment is expected to grow at the highest rate during the forecast period, as services are helping the banking and financial sectors to achieve potential growth in their businesses. These advancements and developments in facilities are expected to boost the growth of this segment.
Public Cloud in BFSI Market

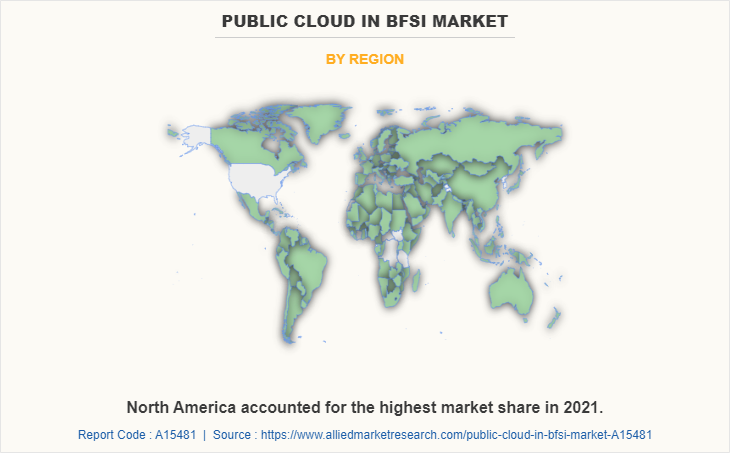
Region-wise, the public cloud in the BFSI market was dominated by North America in 2021 and is expected to retain its position during the forecast period, owing to changing landscape in the BFSI sector with changes in customer demand and rise in digitization across the region. However, Asia-Pacific is expected to witness significant growth during the forecast period, owing to the growing banking cloud trends in the Asia-pacific region strategy of banks to attain and maintain a competitive advantage in digital financial services.

The key players profiled in the public cloud in BFSI market analysis are Adobe, Alibaba Group Holding Limited, Amazon Web Services, Inc., Google LLC., IBM, Microsoft Corporation, Oracle, Salesforce.com, Inc., SAP SE and Workday, Inc. These players have adopted various strategies to increase their market penetration and strengthen their position in the industry.

COVID-19 impact analysis

The outbreak of COVID-19 pandemic and government-imposed restrictions such as travel restrictions impost on social contact insisted the businesses and individuals to remote working options. The financial pressures imposed by trends in domestic revenues and external flows to developing economies were already considered insufficient to support sustainable development goals, some organizations prioritized cost-cutting methods, while others went to the public cloud to swiftly grow infrastructure and meet unexpected surges in demand. In the aftermath of pandemic-related branch and corporate headquarters closures, several banks used cloud technology to keep internal operations operating smoothly. Further, Amazon Web Services (AWS) and other major public cloud providers have seized on this cloud trend, targeting financial institutions to enable remote work for thousands of users.

Another advantage of public cloud computing for BFSI sector is that it frequently assumed to be more cost-effective compared to traditional infrastructure. Self-service was a feature of several public cloud platforms that allowed consumers to provide storage and deploy apps without having to visit via physical location. Furthermore, the cloud is also a compelling option for storing data and accessing sophisticated apps. Furthermore, one of the big challenges of cloud adoption pre-Covid-19 was the amount of operational overhead and risk acceptance knowledge required to migrate workloads from on-premises to the cloud. Thus, the pandemic created a positive impact on global public cloud in BFSI industry.

Top impacting factors

Growth in digital transformational strategies across BFSI sector

Cloud computing solutions in BFSI have aided in the transformation of digital banking, benefiting both front-end and back-end operational models. Since the outburst of pandemic, several enterprises across different financial domains are actively transforming their business operations through adopting public clouds. This will assist financial institutions in becoming more future-proof while laying the foundation for increased customer value and revenue generation.

Furthermore, public cloud solutions enable open banking, broadening the range of options available to consumers across traditional and non-traditional financial services. Moreover, to meet their capacity and speed requirements, banks and financial institutions are increasingly turning to digital technologies to store data and support applied analytics. Therefore, the increase in digital transformation among industries is expected to drive the public cloud in BFSI market opportunity during the forecast period.

Rising penetration of the internet and mobile devices across the world

The increased proliferation of internet has resulted in a surge in the demand for the online segment, which significantly impacts the growth of the market. Further, in the twenty-first century, smartphones and other devices have become indispensable part of many people's lives. As a consequence, the rise in consumption of smartphones and tablets, as well as improved accessibility to internet services via 4G, 5G, and other technologies, has accelerated the adoption of technology among banking customers.

Moreover, to streamline daily operations and gain access to data from anywhere, banking firms and financial institutions are turning to cloud software, as the software keeps businesses up to date on transactions automatically. Therefore, the rising penetration of the internet and mobile devices across the world is expected to drive the growth of the public cloud in BFSI market forecast period.

KEY BENEFITS FOR STAKEHOLDERS        

  • The study provides an in-depth analysis of the global public cloud in BFSI market forecast along with current & future trends to explain the imminent investment pockets.
  • Information about key drivers, restraints, & opportunities and their impact analysis on global public cloud in BFSI market trends is provided in the report.
  • Porter’s five forces analysis illustrates the potency of the buyers and suppliers operating in the industry.
  • The quantitative analysis of the market from 2022 to 2031 is provided to determine the market potential.

Public Cloud in BFSI Market Report Highlights

Aspects Details
Market Size By 2031 USD 189.4 billion
Growth Rate CAGR of 14.6%
Forecast period 2021 - 2031
Report Pages 283
By Type
  • Infrastructure as a Service
  • Platform as a Service
  • Software as a Service
  • Others
By Component
  • Software
  • Services
By Enterprise Size
  • Large Enterprises
  • SMEs
By End User
  • Banking
  • NBFCs
  • Others
By Region
  • North America  (U.S., Canada)
  • Europe  (UK, Germany, France, Italy, Spain, Netherlands, Rest Of Europe)
  • Asia-Pacific  (China, Japan, India, Australia, South Korea, Singapore, Rest Of Asia-Pacific)
  • LAMEA  (Latin America, Middle East, Africa)
Key Market Players Oracle Corporation, Amazon Web Services, Google LLC, Microsoft Corporation, ibm corporation, Salesforce, Inc., SAP SE, Workday, Inc.
 
  • CHAPTER 1:INTRODUCTION

    • 1.1.Report description

    • 1.2.Key market segments

    • 1.3.Key benefits to the stakeholders

    • 1.4.Research Methodology

      • 1.4.1.Secondary research

      • 1.4.2.Primary research

      • 1.4.3.Analyst tools and models

  • CHAPTER 2:EXECUTIVE SUMMARY

    • 2.1.Key findings of the study

    • 2.2.CXO Perspective

  • CHAPTER 3:MARKET OVERVIEW

    • 3.1.Market definition and scope

    • 3.2.Key findings

      • 3.2.1.Top investment pockets

    • 3.3.Porter’s five forces analysis

    • 3.4.Top player positioning

    • 3.5.Market dynamics

      • 3.5.1.Drivers

      • 3.5.2.Restraints

      • 3.5.3.Opportunities

    • 3.6.COVID-19 Impact Analysis on the market

  • CHAPTER 4: PUBLIC CLOUD IN BFSI MARKET, BY COMPONENT

    • 4.1 Overview

      • 4.1.1 Market size and forecast

    • 4.2 Software

      • 4.2.1 Key market trends, growth factors and opportunities

      • 4.2.2 Market size and forecast, by region

      • 4.2.3 Market analysis by country

    • 4.3 Services

      • 4.3.1 Key market trends, growth factors and opportunities

      • 4.3.2 Market size and forecast, by region

      • 4.3.3 Market analysis by country

  • CHAPTER 5: PUBLIC CLOUD IN BFSI MARKET, BY TYPE

    • 5.1 Overview

      • 5.1.1 Market size and forecast

    • 5.2 Infrastructure as a Service

      • 5.2.1 Key market trends, growth factors and opportunities

      • 5.2.2 Market size and forecast, by region

      • 5.2.3 Market analysis by country

    • 5.3 Platform as a Service

      • 5.3.1 Key market trends, growth factors and opportunities

      • 5.3.2 Market size and forecast, by region

      • 5.3.3 Market analysis by country

    • 5.4 Software as a Service

      • 5.4.1 Key market trends, growth factors and opportunities

      • 5.4.2 Market size and forecast, by region

      • 5.4.3 Market analysis by country

    • 5.5 Others

      • 5.5.1 Key market trends, growth factors and opportunities

      • 5.5.2 Market size and forecast, by region

      • 5.5.3 Market analysis by country

  • CHAPTER 6: PUBLIC CLOUD IN BFSI MARKET, BY ENTERPRISE SIZE

    • 6.1 Overview

      • 6.1.1 Market size and forecast

    • 6.2 Large Enterprises

      • 6.2.1 Key market trends, growth factors and opportunities

      • 6.2.2 Market size and forecast, by region

      • 6.2.3 Market analysis by country

    • 6.3 SMEs

      • 6.3.1 Key market trends, growth factors and opportunities

      • 6.3.2 Market size and forecast, by region

      • 6.3.3 Market analysis by country

  • CHAPTER 7: PUBLIC CLOUD IN BFSI MARKET, BY END USER

    • 7.1 Overview

      • 7.1.1 Market size and forecast

    • 7.2 Banking

      • 7.2.1 Key market trends, growth factors and opportunities

      • 7.2.2 Market size and forecast, by region

      • 7.2.3 Market analysis by country

    • 7.3 NBFCs

      • 7.3.1 Key market trends, growth factors and opportunities

      • 7.3.2 Market size and forecast, by region

      • 7.3.3 Market analysis by country

    • 7.4 Others

      • 7.4.1 Key market trends, growth factors and opportunities

      • 7.4.2 Market size and forecast, by region

      • 7.4.3 Market analysis by country

  • CHAPTER 8: PUBLIC CLOUD IN BFSI MARKET, BY REGION

    • 8.1 Overview

      • 8.1.1 Market size and forecast

    • 8.2 North America

      • 8.2.1 Key trends and opportunities

      • 8.2.2 North America Market size and forecast, by Component

      • 8.2.3 North America Market size and forecast, by Type

      • 8.2.4 North America Market size and forecast, by Enterprise Size

      • 8.2.5 North America Market size and forecast, by End User

      • 8.2.6 North America Market size and forecast, by country

        • 8.2.6.1 U.S.
          • 8.2.6.1.1 Market size and forecast, by Component
          • 8.2.6.1.2 Market size and forecast, by Type
          • 8.2.6.1.3 Market size and forecast, by Enterprise Size
          • 8.2.6.1.4 Market size and forecast, by End User
        • 8.2.6.2 Canada
          • 8.2.6.2.1 Market size and forecast, by Component
          • 8.2.6.2.2 Market size and forecast, by Type
          • 8.2.6.2.3 Market size and forecast, by Enterprise Size
          • 8.2.6.2.4 Market size and forecast, by End User
    • 8.3 Europe

      • 8.3.1 Key trends and opportunities

      • 8.3.2 Europe Market size and forecast, by Component

      • 8.3.3 Europe Market size and forecast, by Type

      • 8.3.4 Europe Market size and forecast, by Enterprise Size

      • 8.3.5 Europe Market size and forecast, by End User

      • 8.3.6 Europe Market size and forecast, by country

        • 8.3.6.1 UK
          • 8.3.6.1.1 Market size and forecast, by Component
          • 8.3.6.1.2 Market size and forecast, by Type
          • 8.3.6.1.3 Market size and forecast, by Enterprise Size
          • 8.3.6.1.4 Market size and forecast, by End User
        • 8.3.6.2 Germany
          • 8.3.6.2.1 Market size and forecast, by Component
          • 8.3.6.2.2 Market size and forecast, by Type
          • 8.3.6.2.3 Market size and forecast, by Enterprise Size
          • 8.3.6.2.4 Market size and forecast, by End User
        • 8.3.6.3 France
          • 8.3.6.3.1 Market size and forecast, by Component
          • 8.3.6.3.2 Market size and forecast, by Type
          • 8.3.6.3.3 Market size and forecast, by Enterprise Size
          • 8.3.6.3.4 Market size and forecast, by End User
        • 8.3.6.4 Italy
          • 8.3.6.4.1 Market size and forecast, by Component
          • 8.3.6.4.2 Market size and forecast, by Type
          • 8.3.6.4.3 Market size and forecast, by Enterprise Size
          • 8.3.6.4.4 Market size and forecast, by End User
        • 8.3.6.5 Spain
          • 8.3.6.5.1 Market size and forecast, by Component
          • 8.3.6.5.2 Market size and forecast, by Type
          • 8.3.6.5.3 Market size and forecast, by Enterprise Size
          • 8.3.6.5.4 Market size and forecast, by End User
        • 8.3.6.6 Netherlands
          • 8.3.6.6.1 Market size and forecast, by Component
          • 8.3.6.6.2 Market size and forecast, by Type
          • 8.3.6.6.3 Market size and forecast, by Enterprise Size
          • 8.3.6.6.4 Market size and forecast, by End User
        • 8.3.6.7 Rest of Europe
          • 8.3.6.7.1 Market size and forecast, by Component
          • 8.3.6.7.2 Market size and forecast, by Type
          • 8.3.6.7.3 Market size and forecast, by Enterprise Size
          • 8.3.6.7.4 Market size and forecast, by End User
    • 8.4 Asia-Pacific

      • 8.4.1 Key trends and opportunities

      • 8.4.2 Asia-Pacific Market size and forecast, by Component

      • 8.4.3 Asia-Pacific Market size and forecast, by Type

      • 8.4.4 Asia-Pacific Market size and forecast, by Enterprise Size

      • 8.4.5 Asia-Pacific Market size and forecast, by End User

      • 8.4.6 Asia-Pacific Market size and forecast, by country

        • 8.4.6.1 China
          • 8.4.6.1.1 Market size and forecast, by Component
          • 8.4.6.1.2 Market size and forecast, by Type
          • 8.4.6.1.3 Market size and forecast, by Enterprise Size
          • 8.4.6.1.4 Market size and forecast, by End User
        • 8.4.6.2 Japan
          • 8.4.6.2.1 Market size and forecast, by Component
          • 8.4.6.2.2 Market size and forecast, by Type
          • 8.4.6.2.3 Market size and forecast, by Enterprise Size
          • 8.4.6.2.4 Market size and forecast, by End User
        • 8.4.6.3 India
          • 8.4.6.3.1 Market size and forecast, by Component
          • 8.4.6.3.2 Market size and forecast, by Type
          • 8.4.6.3.3 Market size and forecast, by Enterprise Size
          • 8.4.6.3.4 Market size and forecast, by End User
        • 8.4.6.4 Australia
          • 8.4.6.4.1 Market size and forecast, by Component
          • 8.4.6.4.2 Market size and forecast, by Type
          • 8.4.6.4.3 Market size and forecast, by Enterprise Size
          • 8.4.6.4.4 Market size and forecast, by End User
        • 8.4.6.5 South Korea
          • 8.4.6.5.1 Market size and forecast, by Component
          • 8.4.6.5.2 Market size and forecast, by Type
          • 8.4.6.5.3 Market size and forecast, by Enterprise Size
          • 8.4.6.5.4 Market size and forecast, by End User
        • 8.4.6.6 Singapore
          • 8.4.6.6.1 Market size and forecast, by Component
          • 8.4.6.6.2 Market size and forecast, by Type
          • 8.4.6.6.3 Market size and forecast, by Enterprise Size
          • 8.4.6.6.4 Market size and forecast, by End User
        • 8.4.6.7 Rest of Asia-Pacific
          • 8.4.6.7.1 Market size and forecast, by Component
          • 8.4.6.7.2 Market size and forecast, by Type
          • 8.4.6.7.3 Market size and forecast, by Enterprise Size
          • 8.4.6.7.4 Market size and forecast, by End User
    • 8.5 LAMEA

      • 8.5.1 Key trends and opportunities

      • 8.5.2 LAMEA Market size and forecast, by Component

      • 8.5.3 LAMEA Market size and forecast, by Type

      • 8.5.4 LAMEA Market size and forecast, by Enterprise Size

      • 8.5.5 LAMEA Market size and forecast, by End User

      • 8.5.6 LAMEA Market size and forecast, by country

        • 8.5.6.1 Latin America
          • 8.5.6.1.1 Market size and forecast, by Component
          • 8.5.6.1.2 Market size and forecast, by Type
          • 8.5.6.1.3 Market size and forecast, by Enterprise Size
          • 8.5.6.1.4 Market size and forecast, by End User
        • 8.5.6.2 Middle East
          • 8.5.6.2.1 Market size and forecast, by Component
          • 8.5.6.2.2 Market size and forecast, by Type
          • 8.5.6.2.3 Market size and forecast, by Enterprise Size
          • 8.5.6.2.4 Market size and forecast, by End User
        • 8.5.6.3 Africa
          • 8.5.6.3.1 Market size and forecast, by Component
          • 8.5.6.3.2 Market size and forecast, by Type
          • 8.5.6.3.3 Market size and forecast, by Enterprise Size
          • 8.5.6.3.4 Market size and forecast, by End User
  • CHAPTER 9: COMPANY LANDSCAPE

    • 9.1. Introduction

    • 9.2. Top winning strategies

    • 9.3. Product Mapping of Top 10 Player

    • 9.4. Competitive Dashboard

    • 9.5. Competitive Heatmap

    • 9.6. Key developments

  • CHAPTER 10: COMPANY PROFILES

    • 10.1 ibm corporation

      • 10.1.1 Company overview

      • 10.1.2 Company snapshot

      • 10.1.3 Operating business segments

      • 10.1.4 Product portfolio

      • 10.1.5 Business performance

      • 10.1.6 Key strategic moves and developments

    • 10.2 Amazon Web Services

      • 10.2.1 Company overview

      • 10.2.2 Company snapshot

      • 10.2.3 Operating business segments

      • 10.2.4 Product portfolio

      • 10.2.5 Business performance

      • 10.2.6 Key strategic moves and developments

    • 10.3 SAP SE

      • 10.3.1 Company overview

      • 10.3.2 Company snapshot

      • 10.3.3 Operating business segments

      • 10.3.4 Product portfolio

      • 10.3.5 Business performance

      • 10.3.6 Key strategic moves and developments

    • 10.4 Google LLC

      • 10.4.1 Company overview

      • 10.4.2 Company snapshot

      • 10.4.3 Operating business segments

      • 10.4.4 Product portfolio

      • 10.4.5 Business performance

      • 10.4.6 Key strategic moves and developments

    • 10.5 Microsoft Corporation

      • 10.5.1 Company overview

      • 10.5.2 Company snapshot

      • 10.5.3 Operating business segments

      • 10.5.4 Product portfolio

      • 10.5.5 Business performance

      • 10.5.6 Key strategic moves and developments

    • 10.6 Oracle Corporation

      • 10.6.1 Company overview

      • 10.6.2 Company snapshot

      • 10.6.3 Operating business segments

      • 10.6.4 Product portfolio

      • 10.6.5 Business performance

      • 10.6.6 Key strategic moves and developments

    • 10.7 Salesforce, Inc.

      • 10.7.1 Company overview

      • 10.7.2 Company snapshot

      • 10.7.3 Operating business segments

      • 10.7.4 Product portfolio

      • 10.7.5 Business performance

      • 10.7.6 Key strategic moves and developments

    • 10.8 Workday, Inc.

      • 10.8.1 Company overview

      • 10.8.2 Company snapshot

      • 10.8.3 Operating business segments

      • 10.8.4 Product portfolio

      • 10.8.5 Business performance

      • 10.8.6 Key strategic moves and developments

  • LIST OF TABLES

  • TABLE 1. GLOBAL PUBLIC CLOUD IN BFSI MARKET, BY COMPONENT, 2021-2031 ($MILLION)
    TABLE 2. PUBLIC CLOUD IN BFSI MARKET, FOR SOFTWARE, BY REGION, 2021-2031 ($MILLION)
    TABLE 3. PUBLIC CLOUD IN BFSI MARKET FOR SOFTWARE, BY COUNTRY, 2021-2031 ($MILLION)
    TABLE 4. PUBLIC CLOUD IN BFSI MARKET, FOR SERVICES, BY REGION, 2021-2031 ($MILLION)
    TABLE 5. PUBLIC CLOUD IN BFSI MARKET FOR SERVICES, BY COUNTRY, 2021-2031 ($MILLION)
    TABLE 6. GLOBAL PUBLIC CLOUD IN BFSI MARKET, BY TYPE, 2021-2031 ($MILLION)
    TABLE 7. PUBLIC CLOUD IN BFSI MARKET, FOR INFRASTRUCTURE AS A SERVICE, BY REGION, 2021-2031 ($MILLION)
    TABLE 8. PUBLIC CLOUD IN BFSI MARKET FOR INFRASTRUCTURE AS A SERVICE, BY COUNTRY, 2021-2031 ($MILLION)
    TABLE 9. PUBLIC CLOUD IN BFSI MARKET, FOR PLATFORM AS A SERVICE, BY REGION, 2021-2031 ($MILLION)
    TABLE 10. PUBLIC CLOUD IN BFSI MARKET FOR PLATFORM AS A SERVICE, BY COUNTRY, 2021-2031 ($MILLION)
    TABLE 11. PUBLIC CLOUD IN BFSI MARKET, FOR SOFTWARE AS A SERVICE, BY REGION, 2021-2031 ($MILLION)
    TABLE 12. PUBLIC CLOUD IN BFSI MARKET FOR SOFTWARE AS A SERVICE, BY COUNTRY, 2021-2031 ($MILLION)
    TABLE 13. PUBLIC CLOUD IN BFSI MARKET, FOR OTHERS, BY REGION, 2021-2031 ($MILLION)
    TABLE 14. PUBLIC CLOUD IN BFSI MARKET FOR OTHERS, BY COUNTRY, 2021-2031 ($MILLION)
    TABLE 15. GLOBAL PUBLIC CLOUD IN BFSI MARKET, BY ENTERPRISE SIZE, 2021-2031 ($MILLION)
    TABLE 16. PUBLIC CLOUD IN BFSI MARKET, FOR LARGE ENTERPRISES, BY REGION, 2021-2031 ($MILLION)
    TABLE 17. PUBLIC CLOUD IN BFSI MARKET FOR LARGE ENTERPRISES, BY COUNTRY, 2021-2031 ($MILLION)
    TABLE 18. PUBLIC CLOUD IN BFSI MARKET, FOR SMES, BY REGION, 2021-2031 ($MILLION)
    TABLE 19. PUBLIC CLOUD IN BFSI MARKET FOR SMES, BY COUNTRY, 2021-2031 ($MILLION)
    TABLE 20. GLOBAL PUBLIC CLOUD IN BFSI MARKET, BY END USER, 2021-2031 ($MILLION)
    TABLE 21. PUBLIC CLOUD IN BFSI MARKET, FOR BANKING, BY REGION, 2021-2031 ($MILLION)
    TABLE 22. PUBLIC CLOUD IN BFSI MARKET FOR BANKING, BY COUNTRY, 2021-2031 ($MILLION)
    TABLE 23. PUBLIC CLOUD IN BFSI MARKET, FOR NBFCS, BY REGION, 2021-2031 ($MILLION)
    TABLE 24. PUBLIC CLOUD IN BFSI MARKET FOR NBFCS, BY COUNTRY, 2021-2031 ($MILLION)
    TABLE 25. PUBLIC CLOUD IN BFSI MARKET, FOR OTHERS, BY REGION, 2021-2031 ($MILLION)
    TABLE 26. PUBLIC CLOUD IN BFSI MARKET FOR OTHERS, BY COUNTRY, 2021-2031 ($MILLION)
    TABLE 27. PUBLIC CLOUD IN BFSI MARKET, BY REGION, 2021-2031 ($MILLION)
    TABLE 28. NORTH AMERICA PUBLIC CLOUD IN BFSI MARKET, BY COMPONENT, 2021-2031 ($MILLION)
    TABLE 29. NORTH AMERICA PUBLIC CLOUD IN BFSI MARKET, BY TYPE, 2021-2031 ($MILLION)
    TABLE 30. NORTH AMERICA PUBLIC CLOUD IN BFSI MARKET, BY ENTERPRISE SIZE, 2021-2031 ($MILLION)
    TABLE 31. NORTH AMERICA PUBLIC CLOUD IN BFSI MARKET, BY END USER, 2021-2031 ($MILLION)
    TABLE 32. NORTH AMERICA PUBLIC CLOUD IN BFSI MARKET, BY COUNTRY, 2021-2031 ($MILLION)
    TABLE 33. U.S. PUBLIC CLOUD IN BFSI MARKET, BY COMPONENT, 2021-2031 ($MILLION)
    TABLE 34. U.S. PUBLIC CLOUD IN BFSI MARKET, BY TYPE, 2021-2031 ($MILLION)
    TABLE 35. U.S. PUBLIC CLOUD IN BFSI MARKET, BY ENTERPRISE SIZE, 2021-2031 ($MILLION)
    TABLE 36. U.S. PUBLIC CLOUD IN BFSI MARKET, BY END USER, 2021-2031 ($MILLION)
    TABLE 37. CANADA PUBLIC CLOUD IN BFSI MARKET, BY COMPONENT, 2021-2031 ($MILLION)
    TABLE 38. CANADA PUBLIC CLOUD IN BFSI MARKET, BY TYPE, 2021-2031 ($MILLION)
    TABLE 39. CANADA PUBLIC CLOUD IN BFSI MARKET, BY ENTERPRISE SIZE, 2021-2031 ($MILLION)
    TABLE 40. CANADA PUBLIC CLOUD IN BFSI MARKET, BY END USER, 2021-2031 ($MILLION)
    TABLE 41. EUROPE PUBLIC CLOUD IN BFSI MARKET, BY COMPONENT, 2021-2031 ($MILLION)
    TABLE 42. EUROPE PUBLIC CLOUD IN BFSI MARKET, BY TYPE, 2021-2031 ($MILLION)
    TABLE 43. EUROPE PUBLIC CLOUD IN BFSI MARKET, BY ENTERPRISE SIZE, 2021-2031 ($MILLION)
    TABLE 44. EUROPE PUBLIC CLOUD IN BFSI MARKET, BY END USER, 2021-2031 ($MILLION)
    TABLE 45. EUROPE PUBLIC CLOUD IN BFSI MARKET, BY COUNTRY, 2021-2031 ($MILLION)
    TABLE 46. UK PUBLIC CLOUD IN BFSI MARKET, BY COMPONENT, 2021-2031 ($MILLION)
    TABLE 47. UK PUBLIC CLOUD IN BFSI MARKET, BY TYPE, 2021-2031 ($MILLION)
    TABLE 48. UK PUBLIC CLOUD IN BFSI MARKET, BY ENTERPRISE SIZE, 2021-2031 ($MILLION)
    TABLE 49. UK PUBLIC CLOUD IN BFSI MARKET, BY END USER, 2021-2031 ($MILLION)
    TABLE 50. GERMANY PUBLIC CLOUD IN BFSI MARKET, BY COMPONENT, 2021-2031 ($MILLION)
    TABLE 51. GERMANY PUBLIC CLOUD IN BFSI MARKET, BY TYPE, 2021-2031 ($MILLION)
    TABLE 52. GERMANY PUBLIC CLOUD IN BFSI MARKET, BY ENTERPRISE SIZE, 2021-2031 ($MILLION)
    TABLE 53. GERMANY PUBLIC CLOUD IN BFSI MARKET, BY END USER, 2021-2031 ($MILLION)
    TABLE 54. FRANCE PUBLIC CLOUD IN BFSI MARKET, BY COMPONENT, 2021-2031 ($MILLION)
    TABLE 55. FRANCE PUBLIC CLOUD IN BFSI MARKET, BY TYPE, 2021-2031 ($MILLION)
    TABLE 56. FRANCE PUBLIC CLOUD IN BFSI MARKET, BY ENTERPRISE SIZE, 2021-2031 ($MILLION)
    TABLE 57. FRANCE PUBLIC CLOUD IN BFSI MARKET, BY END USER, 2021-2031 ($MILLION)
    TABLE 58. ITALY PUBLIC CLOUD IN BFSI MARKET, BY COMPONENT, 2021-2031 ($MILLION)
    TABLE 59. ITALY PUBLIC CLOUD IN BFSI MARKET, BY TYPE, 2021-2031 ($MILLION)
    TABLE 60. ITALY PUBLIC CLOUD IN BFSI MARKET, BY ENTERPRISE SIZE, 2021-2031 ($MILLION)
    TABLE 61. ITALY PUBLIC CLOUD IN BFSI MARKET, BY END USER, 2021-2031 ($MILLION)
    TABLE 62. SPAIN PUBLIC CLOUD IN BFSI MARKET, BY COMPONENT, 2021-2031 ($MILLION)
    TABLE 63. SPAIN PUBLIC CLOUD IN BFSI MARKET, BY TYPE, 2021-2031 ($MILLION)
    TABLE 64. SPAIN PUBLIC CLOUD IN BFSI MARKET, BY ENTERPRISE SIZE, 2021-2031 ($MILLION)
    TABLE 65. SPAIN PUBLIC CLOUD IN BFSI MARKET, BY END USER, 2021-2031 ($MILLION)
    TABLE 66. NETHERLANDS PUBLIC CLOUD IN BFSI MARKET, BY COMPONENT, 2021-2031 ($MILLION)
    TABLE 67. NETHERLANDS PUBLIC CLOUD IN BFSI MARKET, BY TYPE, 2021-2031 ($MILLION)
    TABLE 68. NETHERLANDS PUBLIC CLOUD IN BFSI MARKET, BY ENTERPRISE SIZE, 2021-2031 ($MILLION)
    TABLE 69. NETHERLANDS PUBLIC CLOUD IN BFSI MARKET, BY END USER, 2021-2031 ($MILLION)
    TABLE 70. REST OF EUROPE PUBLIC CLOUD IN BFSI MARKET, BY COMPONENT, 2021-2031 ($MILLION)
    TABLE 71. REST OF EUROPE PUBLIC CLOUD IN BFSI MARKET, BY TYPE, 2021-2031 ($MILLION)
    TABLE 72. REST OF EUROPE PUBLIC CLOUD IN BFSI MARKET, BY ENTERPRISE SIZE, 2021-2031 ($MILLION)
    TABLE 73. REST OF EUROPE PUBLIC CLOUD IN BFSI MARKET, BY END USER, 2021-2031 ($MILLION)
    TABLE 74. ASIA-PACIFIC PUBLIC CLOUD IN BFSI MARKET, BY COMPONENT, 2021-2031 ($MILLION)
    TABLE 75. ASIA-PACIFIC PUBLIC CLOUD IN BFSI MARKET, BY TYPE, 2021-2031 ($MILLION)
    TABLE 76. ASIA-PACIFIC PUBLIC CLOUD IN BFSI MARKET, BY ENTERPRISE SIZE, 2021-2031 ($MILLION)
    TABLE 77. ASIA-PACIFIC PUBLIC CLOUD IN BFSI MARKET, BY END USER, 2021-2031 ($MILLION)
    TABLE 78. ASIA-PACIFIC PUBLIC CLOUD IN BFSI MARKET, BY COUNTRY, 2021-2031 ($MILLION)
    TABLE 79. CHINA PUBLIC CLOUD IN BFSI MARKET, BY COMPONENT, 2021-2031 ($MILLION)
    TABLE 80. CHINA PUBLIC CLOUD IN BFSI MARKET, BY TYPE, 2021-2031 ($MILLION)
    TABLE 81. CHINA PUBLIC CLOUD IN BFSI MARKET, BY ENTERPRISE SIZE, 2021-2031 ($MILLION)
    TABLE 82. CHINA PUBLIC CLOUD IN BFSI MARKET, BY END USER, 2021-2031 ($MILLION)
    TABLE 83. JAPAN PUBLIC CLOUD IN BFSI MARKET, BY COMPONENT, 2021-2031 ($MILLION)
    TABLE 84. JAPAN PUBLIC CLOUD IN BFSI MARKET, BY TYPE, 2021-2031 ($MILLION)
    TABLE 85. JAPAN PUBLIC CLOUD IN BFSI MARKET, BY ENTERPRISE SIZE, 2021-2031 ($MILLION)
    TABLE 86. JAPAN PUBLIC CLOUD IN BFSI MARKET, BY END USER, 2021-2031 ($MILLION)
    TABLE 87. INDIA PUBLIC CLOUD IN BFSI MARKET, BY COMPONENT, 2021-2031 ($MILLION)
    TABLE 88. INDIA PUBLIC CLOUD IN BFSI MARKET, BY TYPE, 2021-2031 ($MILLION)
    TABLE 89. INDIA PUBLIC CLOUD IN BFSI MARKET, BY ENTERPRISE SIZE, 2021-2031 ($MILLION)
    TABLE 90. INDIA PUBLIC CLOUD IN BFSI MARKET, BY END USER, 2021-2031 ($MILLION)
    TABLE 91. AUSTRALIA PUBLIC CLOUD IN BFSI MARKET, BY COMPONENT, 2021-2031 ($MILLION)
    TABLE 92. AUSTRALIA PUBLIC CLOUD IN BFSI MARKET, BY TYPE, 2021-2031 ($MILLION)
    TABLE 93. AUSTRALIA PUBLIC CLOUD IN BFSI MARKET, BY ENTERPRISE SIZE, 2021-2031 ($MILLION)
    TABLE 94. AUSTRALIA PUBLIC CLOUD IN BFSI MARKET, BY END USER, 2021-2031 ($MILLION)
    TABLE 95. SOUTH KOREA PUBLIC CLOUD IN BFSI MARKET, BY COMPONENT, 2021-2031 ($MILLION)
    TABLE 96. SOUTH KOREA PUBLIC CLOUD IN BFSI MARKET, BY TYPE, 2021-2031 ($MILLION)
    TABLE 97. SOUTH KOREA PUBLIC CLOUD IN BFSI MARKET, BY ENTERPRISE SIZE, 2021-2031 ($MILLION)
    TABLE 98. SOUTH KOREA PUBLIC CLOUD IN BFSI MARKET, BY END USER, 2021-2031 ($MILLION)
    TABLE 99. SINGAPORE PUBLIC CLOUD IN BFSI MARKET, BY COMPONENT, 2021-2031 ($MILLION)
    TABLE 100. SINGAPORE PUBLIC CLOUD IN BFSI MARKET, BY TYPE, 2021-2031 ($MILLION)
    TABLE 101. SINGAPORE PUBLIC CLOUD IN BFSI MARKET, BY ENTERPRISE SIZE, 2021-2031 ($MILLION)
    TABLE 102. SINGAPORE PUBLIC CLOUD IN BFSI MARKET, BY END USER, 2021-2031 ($MILLION)
    TABLE 103. REST OF ASIA-PACIFIC PUBLIC CLOUD IN BFSI MARKET, BY COMPONENT, 2021-2031 ($MILLION)
    TABLE 104. REST OF ASIA-PACIFIC PUBLIC CLOUD IN BFSI MARKET, BY TYPE, 2021-2031 ($MILLION)
    TABLE 105. REST OF ASIA-PACIFIC PUBLIC CLOUD IN BFSI MARKET, BY ENTERPRISE SIZE, 2021-2031 ($MILLION)
    TABLE 106. REST OF ASIA-PACIFIC PUBLIC CLOUD IN BFSI MARKET, BY END USER, 2021-2031 ($MILLION)
    TABLE 107. LAMEA PUBLIC CLOUD IN BFSI MARKET, BY COMPONENT, 2021-2031 ($MILLION)
    TABLE 108. LAMEA PUBLIC CLOUD IN BFSI MARKET, BY TYPE, 2021-2031 ($MILLION)
    TABLE 109. LAMEA PUBLIC CLOUD IN BFSI MARKET, BY ENTERPRISE SIZE, 2021-2031 ($MILLION)
    TABLE 110. LAMEA PUBLIC CLOUD IN BFSI MARKET, BY END USER, 2021-2031 ($MILLION)
    TABLE 111. LAMEA PUBLIC CLOUD IN BFSI MARKET, BY COUNTRY, 2021-2031 ($MILLION)
    TABLE 112. LATIN AMERICA PUBLIC CLOUD IN BFSI MARKET, BY COMPONENT, 2021-2031 ($MILLION)
    TABLE 113. LATIN AMERICA PUBLIC CLOUD IN BFSI MARKET, BY TYPE, 2021-2031 ($MILLION)
    TABLE 114. LATIN AMERICA PUBLIC CLOUD IN BFSI MARKET, BY ENTERPRISE SIZE, 2021-2031 ($MILLION)
    TABLE 115. LATIN AMERICA PUBLIC CLOUD IN BFSI MARKET, BY END USER, 2021-2031 ($MILLION)
    TABLE 116. MIDDLE EAST PUBLIC CLOUD IN BFSI MARKET, BY COMPONENT, 2021-2031 ($MILLION)
    TABLE 117. MIDDLE EAST PUBLIC CLOUD IN BFSI MARKET, BY TYPE, 2021-2031 ($MILLION)
    TABLE 118. MIDDLE EAST PUBLIC CLOUD IN BFSI MARKET, BY ENTERPRISE SIZE, 2021-2031 ($MILLION)
    TABLE 119. MIDDLE EAST PUBLIC CLOUD IN BFSI MARKET, BY END USER, 2021-2031 ($MILLION)
    TABLE 120. AFRICA PUBLIC CLOUD IN BFSI MARKET, BY COMPONENT, 2021-2031 ($MILLION)
    TABLE 121. AFRICA PUBLIC CLOUD IN BFSI MARKET, BY TYPE, 2021-2031 ($MILLION)
    TABLE 122. AFRICA PUBLIC CLOUD IN BFSI MARKET, BY ENTERPRISE SIZE, 2021-2031 ($MILLION)
    TABLE 123. AFRICA PUBLIC CLOUD IN BFSI MARKET, BY END USER, 2021-2031 ($MILLION)
    TABLE 124.IBM CORPORATION: COMPANY SNAPSHOT
    TABLE 125.IBM CORPORATION: OPERATING SEGMENTS
    TABLE 126.IBM CORPORATION: PRODUCT PORTFOLIO
    TABLE 127.IBM CORPORATION: NET SALES,
    TABLE 128.IBM CORPORATION: KEY STRATERGIES
    TABLE 129.AMAZON WEB SERVICES: COMPANY SNAPSHOT
    TABLE 130.AMAZON WEB SERVICES: OPERATING SEGMENTS
    TABLE 131.AMAZON WEB SERVICES: PRODUCT PORTFOLIO
    TABLE 132.AMAZON WEB SERVICES: NET SALES,
    TABLE 133.AMAZON WEB SERVICES: KEY STRATERGIES
    TABLE 134.SAP SE: COMPANY SNAPSHOT
    TABLE 135.SAP SE: OPERATING SEGMENTS
    TABLE 136.SAP SE: PRODUCT PORTFOLIO
    TABLE 137.SAP SE: NET SALES,
    TABLE 138.SAP SE: KEY STRATERGIES
    TABLE 139.GOOGLE LLC: COMPANY SNAPSHOT
    TABLE 140.GOOGLE LLC: OPERATING SEGMENTS
    TABLE 141.GOOGLE LLC: PRODUCT PORTFOLIO
    TABLE 142.GOOGLE LLC: NET SALES,
    TABLE 143.GOOGLE LLC: KEY STRATERGIES
    TABLE 144.MICROSOFT CORPORATION: COMPANY SNAPSHOT
    TABLE 145.MICROSOFT CORPORATION: OPERATING SEGMENTS
    TABLE 146.MICROSOFT CORPORATION: PRODUCT PORTFOLIO
    TABLE 147.MICROSOFT CORPORATION: NET SALES,
    TABLE 148.MICROSOFT CORPORATION: KEY STRATERGIES
    TABLE 149.ORACLE CORPORATION: COMPANY SNAPSHOT
    TABLE 150.ORACLE CORPORATION: OPERATING SEGMENTS
    TABLE 151.ORACLE CORPORATION: PRODUCT PORTFOLIO
    TABLE 152.ORACLE CORPORATION: NET SALES,
    TABLE 153.ORACLE CORPORATION: KEY STRATERGIES
    TABLE 154.SALESFORCE, INC.: COMPANY SNAPSHOT
    TABLE 155.SALESFORCE, INC.: OPERATING SEGMENTS
    TABLE 156.SALESFORCE, INC.: PRODUCT PORTFOLIO
    TABLE 157.SALESFORCE, INC.: NET SALES,
    TABLE 158.SALESFORCE, INC.: KEY STRATERGIES
    TABLE 159.WORKDAY, INC.: COMPANY SNAPSHOT
    TABLE 160.WORKDAY, INC.: OPERATING SEGMENTS
    TABLE 161.WORKDAY, INC.: PRODUCT PORTFOLIO
    TABLE 162.WORKDAY, INC.: NET SALES,
    TABLE 163.WORKDAY, INC.: KEY STRATERGIES
  • LIST OF FIGURES

  • FIGURE 1.PUBLIC CLOUD IN BFSI MARKET SEGMENTATION
    FIGURE 2.PUBLIC CLOUD IN BFSI MARKET,2021-2031
    FIGURE 3.PUBLIC CLOUD IN BFSI MARKET,2021-2031
    FIGURE 4. TOP INVESTMENT POCKETS, BY REGION
    FIGURE 5.PORTER FIVE-1
    FIGURE 6.PORTER FIVE-2
    FIGURE 7.PORTER FIVE-3
    FIGURE 8.PORTER FIVE-4
    FIGURE 9.PORTER FIVE-5
    FIGURE 10.TOP PLAYER POSITIONING
    FIGURE 11.PUBLIC CLOUD IN BFSI MARKET:DRIVERS, RESTRAINTS AND OPPORTUNITIES
    FIGURE 12.PUBLIC CLOUD IN BFSI MARKET,BY COMPONENT,2021(%)
    FIGURE 13.COMPARATIVE SHARE ANALYSIS OF SOFTWARE PUBLIC CLOUD IN BFSI MARKET,2021-2031(%)
    FIGURE 14.COMPARATIVE SHARE ANALYSIS OF SERVICES PUBLIC CLOUD IN BFSI MARKET,2021-2031(%)
    FIGURE 15.PUBLIC CLOUD IN BFSI MARKET,BY TYPE,2021(%)
    FIGURE 16.COMPARATIVE SHARE ANALYSIS OF INFRASTRUCTURE AS A SERVICE PUBLIC CLOUD IN BFSI MARKET,2021-2031(%)
    FIGURE 17.COMPARATIVE SHARE ANALYSIS OF PLATFORM AS A SERVICE PUBLIC CLOUD IN BFSI MARKET,2021-2031(%)
    FIGURE 18.COMPARATIVE SHARE ANALYSIS OF SOFTWARE AS A SERVICE PUBLIC CLOUD IN BFSI MARKET,2021-2031(%)
    FIGURE 19.COMPARATIVE SHARE ANALYSIS OF OTHERS PUBLIC CLOUD IN BFSI MARKET,2021-2031(%)
    FIGURE 20.PUBLIC CLOUD IN BFSI MARKET,BY ENTERPRISE SIZE,2021(%)
    FIGURE 21.COMPARATIVE SHARE ANALYSIS OF LARGE ENTERPRISES PUBLIC CLOUD IN BFSI MARKET,2021-2031(%)
    FIGURE 22.COMPARATIVE SHARE ANALYSIS OF SMES PUBLIC CLOUD IN BFSI MARKET,2021-2031(%)
    FIGURE 23.PUBLIC CLOUD IN BFSI MARKET,BY END USER,2021(%)
    FIGURE 24.COMPARATIVE SHARE ANALYSIS OF BANKING PUBLIC CLOUD IN BFSI MARKET,2021-2031(%)
    FIGURE 25.COMPARATIVE SHARE ANALYSIS OF NBFCS PUBLIC CLOUD IN BFSI MARKET,2021-2031(%)
    FIGURE 26.COMPARATIVE SHARE ANALYSIS OF OTHERS PUBLIC CLOUD IN BFSI MARKET,2021-2031(%)
    FIGURE 27.PUBLIC CLOUD IN BFSI MARKET BY REGION,2021
    FIGURE 28.U.S. PUBLIC CLOUD IN BFSI MARKET,2021-2031($MILLION)
    FIGURE 29.CANADA PUBLIC CLOUD IN BFSI MARKET,2021-2031($MILLION)
    FIGURE 30.UK PUBLIC CLOUD IN BFSI MARKET,2021-2031($MILLION)
    FIGURE 31.GERMANY PUBLIC CLOUD IN BFSI MARKET,2021-2031($MILLION)
    FIGURE 32.FRANCE PUBLIC CLOUD IN BFSI MARKET,2021-2031($MILLION)
    FIGURE 33.ITALY PUBLIC CLOUD IN BFSI MARKET,2021-2031($MILLION)
    FIGURE 34.SPAIN PUBLIC CLOUD IN BFSI MARKET,2021-2031($MILLION)
    FIGURE 35.NETHERLANDS PUBLIC CLOUD IN BFSI MARKET,2021-2031($MILLION)
    FIGURE 36.REST OF EUROPE PUBLIC CLOUD IN BFSI MARKET,2021-2031($MILLION)
    FIGURE 37.CHINA PUBLIC CLOUD IN BFSI MARKET,2021-2031($MILLION)
    FIGURE 38.JAPAN PUBLIC CLOUD IN BFSI MARKET,2021-2031($MILLION)
    FIGURE 39.INDIA PUBLIC CLOUD IN BFSI MARKET,2021-2031($MILLION)
    FIGURE 40.AUSTRALIA PUBLIC CLOUD IN BFSI MARKET,2021-2031($MILLION)
    FIGURE 41.SOUTH KOREA PUBLIC CLOUD IN BFSI MARKET,2021-2031($MILLION)
    FIGURE 42.SINGAPORE PUBLIC CLOUD IN BFSI MARKET,2021-2031($MILLION)
    FIGURE 43.REST OF ASIA-PACIFIC PUBLIC CLOUD IN BFSI MARKET,2021-2031($MILLION)
    FIGURE 44.LATIN AMERICA PUBLIC CLOUD IN BFSI MARKET,2021-2031($MILLION)
    FIGURE 45.MIDDLE EAST PUBLIC CLOUD IN BFSI MARKET,2021-2031($MILLION)
    FIGURE 46.AFRICA PUBLIC CLOUD IN BFSI MARKET,2021-2031($MILLION)
    FIGURE 47. TOP WINNING STRATEGIES, BY YEAR
    FIGURE 48. TOP WINNING STRATEGIES, BY DEVELOPMENT
    FIGURE 49. TOP WINNING STRATEGIES, BY COMPANY
    FIGURE 50.PRODUCT MAPPING OF TOP 10 PLAYERS
    FIGURE 51.COMPETITIVE DASHBOARD
    FIGURE 52.COMPETITIVE HEATMAP OF TOP 10 KEY PLAYERS
    FIGURE 53.IBM CORPORATION.: NET SALES ,($MILLION)
    FIGURE 54.AMAZON WEB SERVICES.: NET SALES ,($MILLION)
    FIGURE 55.SAP SE.: NET SALES ,($MILLION)
    FIGURE 56.GOOGLE LLC.: NET SALES ,($MILLION)
    FIGURE 57.MICROSOFT CORPORATION.: NET SALES ,($MILLION)
    FIGURE 58.ORACLE CORPORATION.: NET SALES ,($MILLION)
    FIGURE 59.SALESFORCE, INC..: NET SALES ,($MILLION)
    FIGURE 60.WORKDAY, INC..: NET SALES ,($MILLION)


Organizations in the banking, insurance, and financial services sector have been slower than others in moving to the cloud due to concerns over security, data residency, and privacy. For more traditional financial institutions, there is also the not insignificant considering that their core banking systems are running on decades-old on-premises architecture that is just not possible to shift to the public cloud.

Key providers of the public cloud in BFSI market such as Adobe, Alibaba Group Holding Limited, and Amazon Web Services, Inc. account for a significant share in the market. With the larger requirement from the corporate culture, various brands are adopting strategic collaboration and partnerships to automate and simplify data management. For instance, in July 2020, Adobe, IBM and Red Hat announced a strategic partnership to enable organizations to deliver great digital experiences in any environment with flexibility and speed across the public cloud, whether in on-premises data centers or across multiple public clouds.

Furthermore, in August 2022, in line with its strategy of leading the Digital Transformation scene in Jordan and MENA STS announced its partnership with Alibaba Cloud, the digital technology and intellectual backbone of Alibaba Group, to provide state-of-the-art cloud computing services to the local enterprises.

In addition, with increase in demand for getting instant insurance solutions to the problem with all resourceful insights companies such as Amazon web services, Inc. has performed strategic collaboration to help end users. For instance, in November 2021, AWS reinvent, Goldman Sachs announced the launch of Goldman Sachs Financial Cloud for data in collaboration with Amazon Web Services, Inc. (AWS), a new suite of cloud-based data and analytics solutions for financial institutions. Such strategic advancements will contribute to the market growth over the forecast period.

PURCHASE OPTIONS

Call or Email us

U.S.-Canada Toll-free: +1-800-792-5285
Int'l : +1-503-894-6022
Europe : +44-845-528-1300
Email : help@alliedmarketresearch.com
 
FREQUENTLY ASKED QUESTIONS?

A. The public cloud in BFSI market is estimated to grow at a CAGR of 14.6% from 2022 to 2031.

A. The public cloud in BFSI market is projected to reach $189,415.5 million by 2031.

A. Growth in digital transformational strategies across the BFSI sector, rise in penetration of internet and mobile devices across the world, and increase in demand for AI and machine learning contribute toward the growth of the market.

A. The key players profiled in the report include Adobe, Alibaba Group Holding Limited, Amazon Web Services, Inc., Google LLC., IBM, Microsoft Corporation, Oracle, Salesforce.com, Inc., SAP SE, and Workday, Inc.

A. The key growth strategies of public cloud in BFSI market players include product portfolio expansion, mergers & acquisitions, agreements, geographical expansion, and collaborations.

Looking for Customization?

 Customization Request

Have a Question?

 Speak with Analyst

Any Confusion?

 Inquire Before Buying

Have a glance of the Report

  Request Sample
RELATED TAGS

Purchase Full Report of
Public Cloud In Bfsi Market

Start reading instantly.
This Report and over 66,966+ more Reports, Available with Avenue Library. T&C*.

  • Online Only
  • $3,570
  • Online cloud access only
  • Restricted print, copy, paste & download
  • Read only
  • Free industry update
    (Within 180 days)
  • Free report update in next update cycle
    (Oct 2023 - Oct 2024)
  • Data Pack
  • $3,840
  • Restricted to one authorized user
  • One print only
  • Available in
    Excel
  • Free industry update
    (Within 180 days)
  •   Free report update in next update cycle
    (Oct 2023 - Oct 2024)
  • Single User
  • $5,730
  • Restricted to one authorized user
  • One print only
  • Available in
    PDF
  • Free industry update
    (Within 180 days)
  •   Free report update in next update cycle
    (Oct 2023 - Oct 2024)
  • Five Users
  • $6,450
  • Limited to five authorized users
  • Print upto five copies
  • Available in
    PDF
  • Free industry update
    (Within 180 days)
  •   Free report update in next update cycle
    (Oct 2023 - Oct 2024)
  • Enterprise
    License/PDF

  • $9,600
  • Unlimited
    within
    company/enterprise
  • Available in Excel & PDF
  • Free industry update
    (Within 180 days)
  •   Free report update in next update cycle
    (Oct 2023 - Oct 2024)
  • Library
    Membership

  • $999 $ 1,175
    Per User/ Per month/ Billed annually
  • Published Content
    E-access
  • Company Profiles
    E-access
  • Newly Added Content Access
  • 10 PDF
    Downloads
  • 5 Excel Data
    Pack Downloads
  • 250 Company Profiles PDF Downloads
  • Buy Now

*Taxes/Fees, if applicable will be added during checkout. All prices in USD

RELATED REPORTS
 

Why Allied Market Research?


Infallible Methodology

To ensure high-level data integrity, accurate analysis, and impeccable forecasts

Analyst Support

For complete satisfaction

Customization

On-demand customization of scope of the report to exactly meet your needs

TARGETED MARKET VIEW

Targeted market view to provide pertinent information and save time of readers

Get fresh content delivered

Get insights on topics that are crucial for your business. Stay abreast of your interest areas.

Get Industry Data Alerts

Why Allied Market Research?

Infallible Methodology

To ensure high-level data integrity, accurate analysis, and impeccable forecasts

Analyst Support

For complete satisfaction

Customization

On-demand customization of scope of the report to exactly meet your needs

TARGETED MARKET VIEW

Targeted market view to provide pertinent information and save time of readers