Report Code: A11701 | Sep 2021 | Pages: 130 | ||
Tables: 84 | Charts: 49 |
|
Pandemic disrupted the entire world and affected many industries.
Get detailed COVID-19 impact analysis on the Pump Jack Market
Request Now !
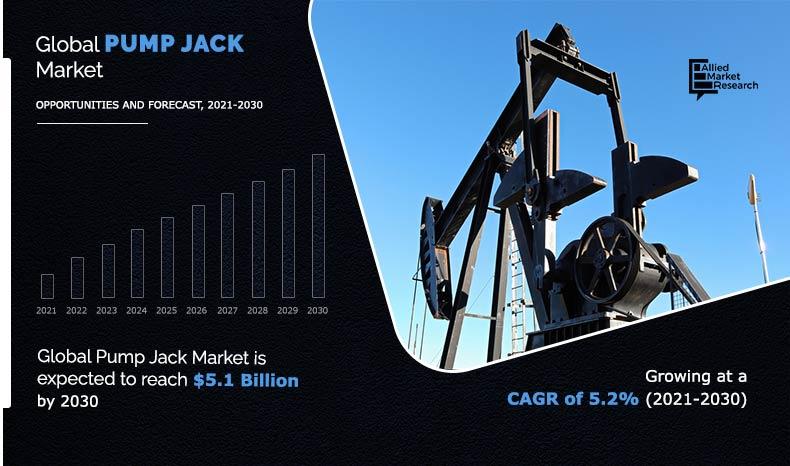
The global pump jack market size was valued at $3.0 billion in 2020, and is expected to reach $5.1 billion by 2030, registering a CAGR of 5.2% from 2021 to 2030. Pump jack is a component that consists of pump in oil well and motors above the surface. It is also called as beam pump, oil jack, and nodding donkey which extracts crude oil from oil well. It is used in oil wells when the pressure in the oil well is insufficient to lift up oil to the surface. Pumpjack is used to increase the production from well. The pumpjack market provide detailed information on utilization of pumpjacks in onshore and offshore applications in oil rich areas. Well types covered in the study include vertical and horizontal well.
COVID-19 pandemic outbreak across the globe has resulted in decline in demand for oil and petrochemical production owing to halted commercial and industrial activities across the globe amid government imposed lock down measures. This has been impacted negatively on global pump jack market.
The growth of the global pump jack market is driven by rise in demand for pump jack from oilfield exploration and production across the globe. However, limitations of offshore well, high maintenance cost, large space required, and rapid development of the electric vehicle industry are the key factors hampering the growth of the market. On the contrary, rapid transition from conventional fuel-based power generation to renewable energy generation and rise in use of electric vehicles for transportation are anticipated to provide lucrative growth opportunities for the key players to maintain the position in the global market in the upcoming years.
The pump jack market is segmented into well type, application and region. By on well type, the market is bifurcated into vertical well and horizontal well. On the basis of application, it is categorized into onshore and offshore. Region wise, it is analyzed across North America, Europe, Asia-Pacific, and LAMEA.
The global market covers in-depth information of the major pump jack industry participants. Some of the major players in the market include Dansco, Drake Manufacturing Co., Inc., Hess Corporation, KBA Engineering, LLC, LS Petrochem Equipment Corp., National-Oilwell Varco, Inc., Shengji Group Co., Ltd., Redhead Artificial Lift Ltd., Schlumberger Limited, and Weatherford International Plc.
Other players operating in the value chain of the global pump jack market are Dover Corporation, Halliburton Company, Allspeeds LLC, Cook Pump Company, Star Hydraulics, Tenaris S.A., Borets International, Pentag Gears & Oilfield Equipment Ltd. and others.
The key players are adopting numerous strategies such as product launch and acquisition to stay competitive in the market.
For instance, in November 2020, Lufkin Industries acquired North American Land Rod Lift Business of Schlumberger N.V. This acquisition is expected to enhance the sales network of company and also increase the new customer base.
In addition, in July 2018 Weatherford International Plc launched a new Rotaflex long-stroke pumping unit that improves artificial-lift efficiency in challenging applications including deep, high-volume and high gas-to-liquids wells. This product launch strengthened the product portfolio of the company in pump jack industry.
The pump jack market is analyzed and estimated in accordance with the impacts of the drivers, restraints, and opportunities. The period studied in this report is 2021–2030. The report includes the study of the market with respect to the growth prospects and restraints based on the regional analysis. The study includes Porter’s five forces analysis of the industry to determine the impact of suppliers, competitors, new entrants, substitutes, and buyers on the market growth.
On the basis of well type, the vertical well segment held the largest pump jack market share in 2020. This is owing to increase in exploration activities and the high presence of vertical wells across the globe. In addition, rise in awareness toward careful planning and management of operations in vertical wells and benefits associated with vertical wells such as low cost, and less time required for extraction, is expected to fuel the market growth in the upcoming years.
On the basis of application, the onshore segment dominated the global market in 2020, in terms of share, owing to effectiveness of onshore well drilling and exploration as compare to offshore wells and rise in number of mature onshore oil wells across the globe. In addition, rise in number of new exploration fields, improvements in shale oil in North America, and surge in usage of pumpjacks in onshore oilfields are anticipated to fuel the growth of the global pump jack market during the analyzed time frame.
North America garnered the highest share in the pump jack market in 2020, in terms of revenue, and is anticipated to maintain its dominance throughout the forecast period. This is attributed to the presence of key players and huge consumer base in the region. In addition, pumpjacks is gaining importance in the oil & gas industries, owing to its rise in investment in oil & gas exploration and production activities to fulfil the demand for petroleum products from various developing economies across the globe and improvements in shale oil reserves in the region are expected to augment the growth of the market during the forecast period.
Lockdowns imposed due to the outbreak of COVID-19 pandemic resulted in temporary ban on crude oil import & export and oil exploration & production activities across the globe, which decreased the demand for pump jack from these consumers. This resulted in decline in market growth in the second, third, and fourth quarters of 2020. However, the pump jack market is expected to recover by the second quarter of 2021 as COVID-19 vaccination has started in various economies across the globe, which is expected to improve the global economy.
Key Benefits For Stakeholders
Key Market Segments
By well type
By application
By Region
Pump Jack Market Report Highlights
Aspects | Details |
---|---|
By WELL TYPE |
|
By APPLICATION |
|
By Region |
|
Key Market Players | Weatherford International Plc, HESS CORPORATION, DRAKE MANUFACTURING CO., INC., KBA ENGINEERING, LLC, LS PETROCHEM EQUIPMENT CORP., SCHLUMBERGER LIMITED, National-Oilwell Varco, Inc, SHENGJI GROUP CO., LTD., REDHEAD ARTIFICIAL LIFT LTD., DANSCO |
CHAPTER 1:INTRODUCTION
1.1.Report description
1.2.Key benefits for stakeholders
1.3.Key market segments
1.4.Research methodology
1.4.1.Primary research
1.4.2.Secondary research
1.4.3.Analyst tools and models
CHAPTER 2:EXECUTIVE SUMMARY
2.1.Key findings
2.2.CXO perspective
CHAPTER 3:MARKET OVERVIEW
3.1.Market definition and scope
3.2.Key forces shaping the market
3.3.Value chain analysis
3.4.Top investment pockets
3.5.Patent analysis
3.5.1.By region, 2013–2019
3.6.Market dynamics
3.6.1.Drivers
3.6.1.1.Increase in demand for crude oil
3.6.1.2.Rapid growth of dual fuel or hybrid vehicles
3.6.2.Restraints
3.6.2.1.Increase in demand for electric vehicles
3.6.2.2.Limitations of pumpjack to offshore applications and variation in crude oil prices
3.6.3.Opportunity
3.6.3.1.Rise in investment toward oil & gas exploration and production activities
3.7.Impact of government regulations on the market
3.8.Impact of COVID-19 outbreak on the market
CHAPTER 4:PUMP JACK MARKET, BY WELL TYPE
4.1.Overview
4.1.1.Market size and forecast
4.2.Vertical well
4.2.1.Key market trends, growth factors, and opportunities
4.2.2.Market size and forecast, by region
4.2.3.Market share analysis, by country
4.3.Horizontal well
4.3.1.Key market trends, growth factors, and opportunities
4.3.2.Market size and forecast, by region
4.3.3.Market share analysis, by country
CHAPTER 5:PUMP JACK MARKET, BY APPLICATION
5.1.Overview
5.1.1.Market size and forecast
5.2.Onshore
5.2.1.Key market trends, growth factors, and opportunities
5.2.2.Market size and forecast, by region
5.2.3.Market share analysis, by country
5.3.Offshore
5.3.1.Key market trends, growth factors, and opportunities
5.3.2.Market size and forecast, by region
5.3.3.Market share analysis, by country
CHAPTER 6:PUMP JACK MARKET, BY REGION
6.1.Overview
6.1.1.Market size and forecast
6.2.North America
6.2.1.Key market trends, growth factors, and opportunities
6.2.2.Market size and forecast, by well type
6.2.3.Market size and forecast, by application
6.2.4.Market share analysis, by country
6.2.5.U.S.
6.2.5.1.Market size and forecast, by well type
6.2.5.2.Market size and forecast, by application
6.2.6.Canada
6.2.6.1.Market size and forecast, by well type
6.2.6.2.Market size and forecast, by application
6.2.7.Mexico
6.2.7.1.Market size and forecast, by well type
6.2.7.2.Market size and forecast, by application
6.3.Europe
6.3.1.Key market trends, growth factors, and opportunities
6.3.2.Market size and forecast, by well type
6.3.3.Market size and forecast, by application
6.3.4.Market share analysis, by country
6.3.5.Germany
6.3.5.1.Market size and forecast, by well type
6.3.5.2.Market size and forecast, by application
6.3.6.France
6.3.6.1.Market size and forecast, by well type
6.3.6.2.Market size and forecast, by application
6.3.7.UK
6.3.7.1.Market size and forecast, by well type
6.3.7.2.Market size and forecast, by application
6.3.8.Italy
6.3.8.1.Market size and forecast, by well type
6.3.8.2.Market size and forecast, by application
6.3.9.Spain
6.3.9.1.Market size and forecast, by well type
6.3.9.2.Market size and forecast, by application
6.3.10.Rest of Europe
6.3.10.1.Market size and forecast, by well type
6.3.10.2.Market size and forecast, by application
6.4.Asia-Pacific
6.4.1.Key market trends, growth factors, and opportunities
6.4.2.Market size and forecast, by well type
6.4.3.Market size and forecast, by application
6.4.4.Market share analysis, by country
6.4.5.China
6.4.5.1.Market size and forecast, by well type
6.4.5.2.Market size and forecast, by application
6.4.6.Japan
6.4.6.1.Market size and forecast, by well type
6.4.6.2.Market size and forecast, by application
6.4.7.India
6.4.7.1.Market size and forecast, by well type
6.4.7.2.Market size and forecast, by application
6.4.8.Australia
6.4.8.1.Market size and forecast, by well type
6.4.8.2.Market size and forecast, by application
6.4.9.South Korea
6.4.9.1.Market size and forecast, by well type
6.4.9.2.Market size and forecast, by application
6.4.10.Rest of Asia-Pacific
6.4.10.1.Market size and forecast, by well type
6.4.10.2.Market size and forecast, by application
6.5.LAMEA
6.5.1.Key market trends, growth factors, and opportunities
6.5.2.Market size and forecast, by well type
6.5.3.Market size and forecast, by application
6.5.4.Market share analysis, by country
6.5.5.Latin America
6.5.5.1.Market size and forecast, by well type
6.5.5.2.Market size and forecast, by application
6.5.6.Middle East
6.5.6.1.Market size and forecast, by well type
6.5.6.2.Market size and forecast, by application
6.5.7.Africa
6.5.7.1.Market size and forecast, by well type
6.5.7.2.Market size and forecast, by application
CHAPTER 7:COMPETITIVE LANDSCAPE
7.1.Introduction
7.1.1.Market Player Positioning, 2020
7.2.Top winning strategies
7.3.Product Mapping of Top 10 Player
7.4.Competitive Heatmap
7.5.Key developments
7.5.1.New product launch
CHAPTER 8:COMPANY PROFILES
8.1.DANSCO
8.1.1.Company overview
8.1.2.Company snapshot
8.1.3.Product portfolio
8.2.DRAKE MANUFACTURING CO., INC.
8.2.1.Company overview
8.2.2.Company snapshot
8.2.3.Product portfolio
8.3.HESS CORPORATION
8.3.1.Company overview
8.3.2.Company snapshot
8.3.3.Operating business segments
8.3.4.Product portfolio
8.3.5.Business performance
8.4.KBA ENGINEERING, LLC
8.4.1.Company overview
8.4.2.Company snapshot
8.4.3.Product portfolio
8.5.LS PETROCHEM EQUIPMENT CORP.
8.5.1.Company overview
8.5.2.Company snapshot
8.5.3.Product portfolio
8.6.National-Oilwell Varco, Inc
8.6.1.Company overview
8.6.2.Company snapshot
8.6.3.Operating business segments
8.6.4.Product portfolio
8.6.5.Business performance
8.7.SHENGJI GROUP CO., LTD.
8.7.1.Company overview
8.7.2.Company snapshot
8.7.3.Product portfolio
8.8.REDHEAD ARTIFICIAL LIFT LTD.
8.8.1.Company overview
8.8.2.Company Snapshot
8.8.3.Product portfolio
8.9.SCHLUMBERGER LIMITED
8.9.1.Company overview
8.9.2.Company snapshot
8.9.3.Operating business segments
8.9.4.Product portfolio
8.9.5.Business performance
8.10.Weatherford International Plc
8.10.1.Company overview
8.10.2.Company Snapshot
8.10.3.Operating business segments
8.10.4.Product portfolio
8.10.5.Business performance
LIST OF TABLES
TABLE 01.GLOBAL PUMP JACK MARKET, BY WELL TYPE, 2020–2030 ($MILLION)
TABLE 02.PUMP JACK MARKET FOR VERTICAL WELL, BY REGION, 2020–2030 ($MILLION)
TABLE 03.PUMP JACK MARKET FOR HORIZONTAL WELL, BY REGION, 2020–2030 ($MILLION)
TABLE 04.GLOBAL PUMP JACK MARKET, BY APPLICATION, 2020–2030 ($MILLION)
TABLE 05.PUMP JACK MARKET FOR ONSHORE, BY REGION, 2020–2030 ($MILLION)
TABLE 06.PUMP JACK MARKET FOR OFFSHORE, BY REGION, 2020–2030 ($MILLION)
TABLE 07.PUMP JACK MARKET, BY REGION, 2020-2030 ($MILLION)
TABLE 08.NORTH AMERICA PUMP JACK MARKET, BY WELL TYPE, 2020–2030 ($MILLION)
TABLE 09.NORTH AMERICA PUMP JACK MARKET, BY APPLICATION, 2020–2030 ($MILLION)
TABLE 10.NORTH AMERICA PUMP JACK MARKET, BY COUNTRY, 2020–2030 ($MILLION)
TABLE 11.U.S. PUMP JACK MARKET, BY WELL TYPE, 2020–2030 ($MILLION)
TABLE 12.U.S. PUMP JACK MARKET, BY APPLICATION, 2020–2030 ($MILLION)
TABLE 13.CANADA PUMP JACK MARKET, BY WELL TYPE, 2020–2030 ($MILLION)
TABLE 14.CANADA PUMP JACK MARKET, BY APPLICATION, 2020–2030 ($MILLION)
TABLE 15.MEXICO PUMP JACK MARKET, BY WELL TYPE, 2020–2030 ($MILLION)
TABLE 16.MEXICO PUMP JACK MARKET, BY APPLICATION, 2020–2030 ($MILLION)
TABLE 17.EUROPE PUMP JACK MARKET, BY WELL TYPE, 2020–2030 ($MILLION)
TABLE 18.EUROPE PUMP JACK MARKET, BY APPLICATION, 2020–2030 ($MILLION)
TABLE 19.EUROPE PUMP JACK MARKET, BY COUNTRY, 2020–2030 ($MILLION)
TABLE 20.GERMANY PUMP JACK MARKET, BY WELL TYPE, 2020–2030 ($MILLION)
TABLE 21.GERMANY PUMP JACK MARKET, BY APPLICATION, 2020–2030 ($MILLION)
TABLE 22.FRANCE PUMP JACK MARKET, BY WELL TYPE, 2020–2030 ($MILLION)
TABLE 23.FRANCE PUMP JACK MARKET, BY APPLICATION, 2020–2030 ($MILLION)
TABLE 24.UK PUMP JACK MARKET, BY WELL TYPE, 2020–2030 ($MILLION)
TABLE 25.UK PUMP JACK MARKET, BY APPLICATION, 2020–2030 ($MILLION)
TABLE 26.ITALY PUMP JACK MARKET, BY WELL TYPE, 2020–2030 ($MILLION)
TABLE 27.ITALY PUMP JACK MARKET, BY APPLICATION, 2020–2030 ($MILLION)
TABLE 28.SPAIN PUMP JACK MARKET, BY WELL TYPE, 2020–2030 ($MILLION)
TABLE 29.SPAIN PUMP JACK MARKET, BY APPLICATION, 2020–2030 ($MILLION)
TABLE 30.REST OF EUROPE PUMP JACK MARKET, BY WELL TYPE, 2020–2030 ($MILLION)
TABLE 31.REST OF EUROPE PUMP JACK MARKET, BY APPLICATION, 2020–2030 ($MILLION)
TABLE 32.ASIA-PACIFIC PUMP JACK MARKET, BY WELL TYPE, 2020–2030 ($MILLION)
TABLE 33.ASIA-PACIFIC PUMP JACK MARKET, BY APPLICATION, 2020–2030 ($MILLION)
TABLE 34.ASIA-PACIFIC PUMP JACK MARKET, BY COUNTRY, 2020–2030 ($MILLION)
TABLE 35.CHINA PUMP JACK MARKET, BY WELL TYPE, 2020–2030 ($MILLION)
TABLE 36.CHINA PUMP JACK MARKET, BY APPLICATION, 2020–2030 ($MILLION)
TABLE 37.JAPAN PUMP JACK MARKET, BY WELL TYPE, 2020–2030 ($MILLION)
TABLE 38.JAPAN PUMP JACK MARKET, BY APPLICATION, 2020–2030 ($MILLION)
TABLE 39.INDIA PUMP JACK MARKET, BY WELL TYPE, 2020–2030 ($MILLION)
TABLE 40.INDIA PUMP JACK MARKET, BY APPLICATION, 2020–2030 ($MILLION)
TABLE 41.AUSTRALIA PUMP JACK MARKET, BY WELL TYPE, 2020–2030 ($MILLION)
TABLE 42.AUSTRALIA PUMP JACK MARKET, BY APPLICATION, 2020–2030 ($MILLION)
TABLE 43.SOUTH KOREA PUMP JACK MARKET, BY WELL TYPE, 2020–2030 ($MILLION)
TABLE 44.SOUTH KOREA PUMP JACK MARKET, BY APPLICATION, 2020–2030 ($MILLION)
TABLE 45.REST OF ASIA-PACIFIC PUMP JACK MARKET, BY WELL TYPE, 2020–2030 ($MILLION)
TABLE 46.REST OF ASIA-PACIFIC PUMP JACK MARKET, BY APPLICATION, 2020–2030 ($MILLION)
TABLE 47.LAMEA PUMP JACK MARKET, BY WELL TYPE, 2020–2030 ($MILLION)
TABLE 48.LAMEA PUMP JACK MARKET, BY APPLICATION, 2020–2030 ($MILLION)
TABLE 49.LAMEA PUMP JACK MARKET, BY COUNTRY, 2020–2030 ($MILLION)
TABLE 50.LATIN AMERICA PUMP JACK MARKET, BY WELL TYPE, 2020–2030 ($MILLION)
TABLE 51.LATIN AMERICA PUMP JACK MARKET, BY APPLICATION, 2020–2030 ($MILLION)
TABLE 52.MIDDLE EAST PUMP JACK MARKET, BY WELL TYPE, 2020–2030 ($MILLION)
TABLE 53.MIDDLE EAST PUMP JACK MARKET, BY APPLICATION, 2020–2030 ($MILLION)
TABLE 54.AFRICA PUMP JACK MARKET, BY WELL TYPE, 2020–2030 ($MILLION)
TABLE 55.AFRICA PUMP JACK MARKET, BY APPLICATION, 2020–2030 ($MILLION)
TABLE 56.KEY NEW PRODUCT LAUNCH (2017-2021)
TABLE 57.DANSCO: COMPANY SNAPSHOT
TABLE 58.DANSCO: PRODUCT PORTFOLIO
TABLE 59.DRAKE MANUFACTURING CO., INC.: COMPANY SNAPSHOT
TABLE 60.DRAKE MANUFACTURING CO., INC.: PRODUCT PORTFOLIO
TABLE 61.HESS CORPORATION: COMPANY SNAPSHOT
TABLE 62.HESS CORPORATION: OPERATING SEGMENTS
TABLE 63.HESS CORPORATION
TABLE 64.OVERALL FINANCIAL STATUS ($MILLION)
TABLE 65.KBA ENGINEERING, LLC: COMPANY SNAPSHOT
TABLE 66.KBA ENGINEERING, LLC: PRODUCT PORTFOLIO
TABLE 67.LS PETROCHEM EQUIPMENT CORP.: COMPANY SNAPSHOT
TABLE 68.LS PETROCHEM EQUIPMENT CORP.: PRODUCT PORTFOLIO
TABLE 69.NATIONAL-OILWELL VARCO, INC: COMPANY SNAPSHOT
TABLE 70.NATIONAL-OILWELL VARCO, INC: OPERATING SEGMENTS
TABLE 71.NATIONAL-OILWELL VARCO, INC: PRODUCT PORTFOLIO
TABLE 72.OVERALL FINANCIAL STATUS ($MILLION)
TABLE 73.SHENGJI GROUP CO., LTD.: COMPANY SNAPSHOT
TABLE 74.SHENGJI GROUP CO., LTD.: PRODUCT PORTFOLIO
TABLE 75.REDHEAD ARTIFICIAL LIFT LTD.: COMPANY SNAPSHOT
TABLE 76.REDHEAD ARTIFICIAL LIFT LTD.: PRODUCT PORTFOLIO
TABLE 77.SCHLUMBERGER LIMITED: COMPANY SNAPSHOT
TABLE 78.SCHLUMBERGER LIMITED: OPERATING SEGMENTS
TABLE 79.SCHLUMBERGER LIMITED: PRODUCT PORTFOLIO
TABLE 80.OVERALL FINANCIAL STATUS ($MILLION)
TABLE 81.WEATHERFORD: COMPANY SNAPSHOT
TABLE 82.WEATHERFORD: OPERATING SEGMENTS
TABLE 83.WEATHERFORD: PRODUCT PORTFOLIO
TABLE 84.OVERALL FINANCIAL STATUS ($MILLION)
LIST OF FIGURES
FIGURE 01.KEY MARKET SEGMENTS
FIGURE 02.MODERATE BARGAINING POWER OF SUPPLIERS
FIGURE 03.MODERATE THREAT OF NEW ENTRANTS
FIGURE 04.MODERATE THREAT OF SUBSTITUTES
FIGURE 05.MODERATE INTENSITY OF COMPETITIVE RIVALRY
FIGURE 06.MODERATE BARGAINING POWER OF BUYERS
FIGURE 07.VALUE CHAIN ANALYSIS
FIGURE 08.TOP INVESTMENT POCKETS
FIGURE 09.PATENT ANALYSIS, BY REGION
FIGURE 10.PUMP JACK MARKET DYNAMICS
FIGURE 11.GLOBAL PUMP JACK MARKET, BY WELL TYPE, 2020–2030
FIGURE 12.COMPARATIVE ANALYSIS OF PUMP JACK MARKET FOR VERTICAL WELL, BY COUNTRY, 2020 & 2030 ($MILLION)
FIGURE 13.COMPARATIVE ANALYSIS OF PUMP JACK MARKET FOR HORIZONTAL WELL, BY COUNTRY, 2020 & 2030 ($MILLION)
FIGURE 14.GLOBAL PUMP JACK MARKET, BY APPLICATION, 2020–2030
FIGURE 15.COMPARATIVE ANALYSIS OF PUMP JACK MARKET FOR ONSHORE, BY COUNTRY, 2020 & 2030 ($MILLION)
FIGURE 16.COMPARATIVE ANALYSIS OF PUMP JACK MARKET FOR OFFSHORE, BY COUNTRY, 2020 & 2030 ($MILLION)
FIGURE 17.U.S. PUMP JACK MARKET REVENUE, 2020–2030 ($MILLION)
FIGURE 18.CANADA PUMP JACK MARKET REVENUE, 2020–2030 ($MILLION)
FIGURE 19.MEXICO PUMP JACK MARKET REVENUE, 2020–2030 ($MILLION)
FIGURE 20.GERMANY PUMP JACK MARKET REVENUE, 2020–2030 ($MILLION)
FIGURE 21.FRANCE PUMP JACK MARKET REVENUE, 2020–2030 ($MILLION)
FIGURE 22.UK PUMP JACK MARKET REVENUE, 2020–2030 ($MILLION)
FIGURE 23.ITALY PUMP JACK MARKET REVENUE, 2020–2030 ($MILLION)
FIGURE 24.SPAIN PUMP JACK MARKET REVENUE, 2020–2030 ($MILLION)
FIGURE 25.REST OF EUROPE PUMP JACK MARKET REVENUE, 2020–2030 ($MILLION)
FIGURE 26.CHINA PUMP JACK MARKET REVENUE, 2020–2030 ($MILLION)
FIGURE 27.JAPAN PUMP JACK MARKET REVENUE, 2020–2030 ($MILLION)
FIGURE 28.INDIA PUMP JACK MARKET REVENUE, 2020–2030 ($MILLION)
FIGURE 29.AUSTRALIA PUMP JACK MARKET REVENUE, 2020–2030 ($MILLION)
FIGURE 30.SOUTH KOREA PUMP JACK MARKET REVENUE, 2020–2030 ($MILLION)
FIGURE 31.REST OF ASIA-PACIFIC PUMP JACK MARKET REVENUE, 2020–2030 ($MILLION)
FIGURE 32.LATIN AMERICA PUMP JACK MARKET REVENUE, 2020–2030 ($MILLION)
FIGURE 33.MIDDLE EAST PUMP JACK MARKET REVENUE, 2020–2030 ($MILLION)
FIGURE 34.AFRICA PUMP JACK MARKET REVENUE, 2020–2030 ($MILLION)
FIGURE 35.MARKET PLAYER POSITIONING, 2020
FIGURE 36.PRODUCT MAPPING OF TOP 10 PLAYERS
FIGURE 37.COMPETITIVE HEATMAP OF KEY PLAYERS
FIGURE 38.HESS CORPORATION: REVENUE, 2018–2020 ($MILLION)
FIGURE 39.HESS CORPORATION: REVENUE SHARE BY SEGMENT, 2020 (%)
FIGURE 40.HESS CORPORATION: REVENUE SHARE BY REGION, 2020 (%)
FIGURE 41.NATIONAL-OILWELL VARCO, INC: REVENUE, 2017–2019 ($MILLION)
FIGURE 42.NATIONAL-OILWELL VARCO, INC: REVENUE SHARE BY SEGMENT, 2020 (%)
FIGURE 43.NATIONAL-OILWELL VARCO, INC: REVENUE SHARE BY REGION, 2020 (%)
FIGURE 44.SCHLUMBERGER LIMITED: REVENUE, 2018–2020 ($MILLION)
FIGURE 45.SCHLUMBERGER LIMITED: REVENUE SHARE BY SEGMENT, 2020 (%)
FIGURE 46.SCHLUMBERGER LIMITED: REVENUE SHARE BY REGION, 2020 (%)
FIGURE 47.WEATHERFORD: NET SALES, 2017–2019 ($MILLION)
FIGURE 48.WEATHERFORD: REVENUE SHARE BY SEGMENT, 2020 (%)
FIGURE 49.WEATHERFORD: REVENUE SHARE BY REGION, 2020 (%)
Rapid industrialization is the key factor attributed to the leading position of North America and Asia-Pacific regions in the global pump jack market. The North America region is further expected to provide lucrative opportunities to leading pumpjack manufacturers, owing to its huge potential to exploration & production activities and surge in demand for petroleum products across the globe.
Increase in demand for conventional fuels such as petrol, diesel, kerosene and others from the transportation and power generation industry is the key factor driving the growth of the global pump jack market during the forecast period. However, implementation of stringent government regulations toward environmental pollutions owing to the use of petroleum products is expected to hamper the growth of the market during the analyzed time frame. On the contrary, rapid transition from coal power station to gas power station and rise in use of gas in the vehicles are anticipated to provide remunerative opportunity for the key players to maintain the pace in the pump jack market in the upcoming years.
Among the analyzed regions, North America is expected to account for the highest revenue in the market by the end of 2030, followed by Asia-Pacific, Europe, and LAMEA.
A. Increase in demand for crude oil & petroleum products and rapid growth of the dual fuel or hybrid vehicle are key factors drives the pump jack market growth during the forecast period.
A. Rise in investment towards oil & gas exploration and production activities is expected to be the key trend in the pump jack market.
A. The report sample for global pump jack market report can be obtained on demand from the website. Also, the 24*7 chat support and direct call services are provided to procure the sample report.
A. The potential customers of the pump jack market are oil & gas, construction, and other liquid lifting industries.
A. On the basis of well type, vertical well segment will drive the pump jack market growth during the forecast period. On the basis of application, onshore segment will drive the growth of the pump jack market.
A. The key growth strategies adopted by pump jack market players product launch and acquisition.
A. The top ten market players are selected based on two key attributes - competitive strength and market positioning.
A. Top players in the pump jack market are Dansco, Drake Manufacturing Co., Inc., Hess Corporation, KBA Engineering, LLC, LS Petrochem Equipment Corp., National-Oilwell Varco, Inc., Shengji Group Co., Ltd., Redhead Artificial Lift Ltd., Schlumberger Limited, and Weatherford International Plc.
A. In terms of revenue, the market size of pump jack market is anticipated to reach $5.1 billion by 2030, growing at CAGR of 5.2% from 2021 to 2030.
A. Asia-Pacific garnered the dominant share in 2020, and is anticipated to maintain this dominance in pump jack market trend during the forecast period. This is attributed to the presence of key players and huge consumer base in the region. In addition, pumpjacks is gaining importance in the oil & gas industries, owing to its rise in investment in oil & gas exploration and production activities to fulfil the demand for petroleum products from various developing economies across the region and improvements in shale oil reserves in the region are expected to augment the growth of the pump jack market during the forecast period.
Start reading instantly.
This Report and over 67,112+ more Reports, Available with Avenue Library. T&C*.
Enterprise
License/PDF
Library
Membership
*Taxes/Fees, if applicable will be added during checkout. All prices in USD
To ensure high-level data integrity, accurate analysis, and impeccable forecasts
For complete satisfaction
On-demand customization of scope of the report to exactly meet your needs
Targeted market view to provide pertinent information and save time of readers
Get insights on topics that are crucial for your business. Stay abreast of your interest areas.
Get Industry Data AlertsTo ensure high-level data integrity, accurate analysis, and impeccable forecasts
For complete satisfaction
On-demand customization of scope of the report to exactly meet your needs
Targeted market view to provide pertinent information and save time of readers