0
2022
Renal Denervation Market

Renal Denervation Market

by Product Type (Symplicity, Enlightn, Vessix, Paradise, Iberis, Others), by Technology (Radiofrequency, Ultrasound, Micro-Infusion), by End User (Hospitals, Specialty Clinics, Others): Global Opportunity Analysis and Industry Forecast, 2020-2030

✷  Report Code: A00420
Mar 2022 | Pages: 195
Tables: 143
Charts: 58
  • Formats*:

  • pdf

    Single User License, Five User
    License & Enterprise User License

  • xls

    Data Pack Excel License

  • ppt

    It comes with the additional cost
    of $2500.00 contact sales.


Renal Denervation Market Statistics - 2030

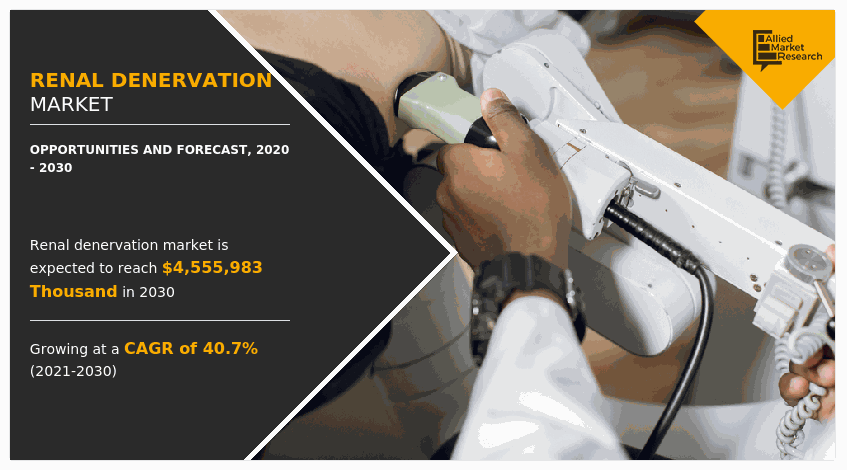
The global renal denervation market size was valued at $156,327.4 thousand in 2020, and is projected to reach $4,555,983.0 thousand by 2030, growing at a CAGR of 40.7% from 2021 to 2030. Renal denervation is a catheter-based, minimally invasive treatment for treating hypertension. Radio frequency ablation is used to burn the nerves in the renal arteries. Nerve activity is reduced andit lowers the blood pressure.In most situations, the operation is used when pharmacological therapy has failed to offer relief. Radiofrequency pulses or ultrasound are used to ablate the nerves of the renal artery wall. This decreases sympathetic kidney activity, resulting in lower blood pressure.
The outbreak of COVID-19 has disrupted workflows in the healthcare sector globally. The disease has forced a number of industries to shut their doors temporarily, including several sub-domains of healthcare. The COVID-19 pandemic led to disruptions in the healthcare facilities. The overall impact of the COVID-19 pandemic was negative on key players operating in renal denervation market.

The renal denervation market size has expanded due to increase in change in lifestyle that lead to resistant hypertension and an increase in the prevalence of hypertension. Further, technological advancements that have led to the development of alternative technologies for renal denervation systems, such as micro-infusion have propelled the renal denervation market growth forward. In addition, over the last few years, the prevalence of hypertension has increased significantly, which causefluctuation of blood pressure throughout the day, but if it remains high for an extended period of time, it might harm one's heart and cause health concerns. According to the World Health Organization, about 1.28 billion individuals aged 30 to 79 years would be affected with hypertension by 2021. During the projected period, surge in occurrences of hypertension is likely to drive demand for renal denervation devices. However, the renal denervation industry expansion has been hampered by severe regulatory standards for renal denervation devices and negative reimbursements for the treatment.

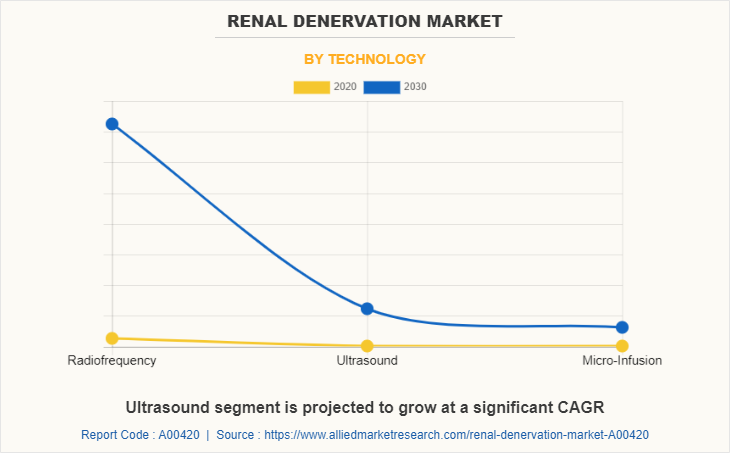
The ultrasound-based renal denervation devices employ ultrasound to ablate nerves in the renal artery wall, disrupting nerve impulse transmission, and lowering blood pressure. It is minimally invasive treatment used to treat hypertension. The significant efficiency of ultrasound-based technologies demonstrated in trials is expected to boost their relevance and renew them. For instance, in October 2021, ReCor Medical, manufacturer of medical devices introduced Paradise Ultrasound Renal Denervation for the treatment of Hypertension in Europe. This renal denervation system is minimally invasive procedure for treating high blood pressure.
Renal Denervation Market

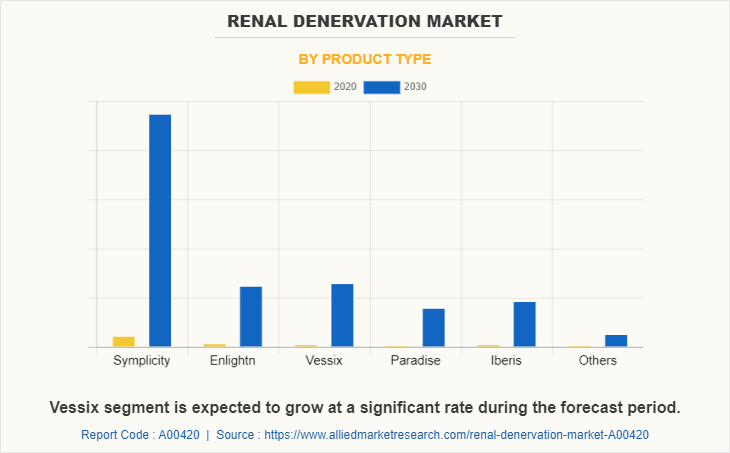
On the basis of product, symplicity accounted for the largest renal denervation market share in 2020. This system is being used most frequently to treat hypertension as it delivers low level radiofrequency energy and hence reduce the risk of radiations on body tissues due to high level radiofrequency. It also offers minimally invasive procedure to treat excessive hypertension.
Renal Denervation Market

Radiofrequency was the most frequently used technology in the renal denervation market and it was the major segment in 2020. Radiofrequency renal denervation is an effective way to control resistant hypertension, and a one-time procedure is enough to lower the blood pressure levels up to two years.
Renal Denervation Market

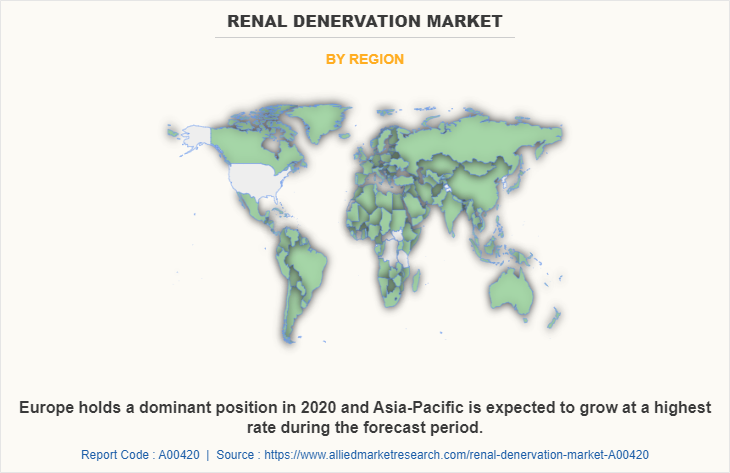
Based on region, Europe has accounted for largest share in 2020 and Asia-Pacific is projected to grow with high CAGR. Europe’s high share is attributed to the early start of this technology in European countries. In addition, most of the devices in this market have received a CE mark approval and are available for sales in the European region. Whereas, in Asia-Pacific owning to presence of ample growth opportunities in terms of unmet medical needs for the treatment of hypertension, increase in awareness about the use of advanced technologies such as renal denervation systems, and high prevalence rate of resistant hypertension.

The novel coronavirus (COVID-19) rapidly spread across various countries and regions in 2019, causing an enormous impact on lives of people and the overall community. It began as a human health condition and has now becomea significant threat to global trade, economy, and finance.The COVID-19 pandemic halted production of many products in the renal denervation market, owing to lockdowns. Furthermore, the number of COVID-19 cases is expected to reduce in the futurewith the introduction of the vaccine for COVID-19 in the market. This has led to the reopening of renal denervation companies at their full-scale capacities, which is anticipated to help the market recover by the start of 2022.After COVID-19 infection cases begin to decline, equipment &machinery producers must focus on protecting their staff, operations, and supply networks to respond to urgent emergencies and establish new methods of working.

The market is segmented on the basis ofproduct, technology, and geography. On the basis of product, the market is divided into symplicity, enligHTN, vessix, paradise, and, iberis. On the basis of technology, the market is divided into radiofrequency, ultrasound, and micro-infusion. On the basis of end user, the market is divided into hospitals, specialty clinics, and others. Region wise, the market analysis is conducted across North America (the U.S., Canada, and Mexico), Europe (the UK, France, Germany, Italy, and Rest of Europe), Asia-Pacific (China, Japan, India, Australia, and Rest of Asia-Pacific), and LAMEA (Latin America, the Middle East, and Africa).

Key Benefits For Stakeholders

  • The report provides an extensive analysis of the current and emerging renal denervation market trends and dynamics. 
  • In-depth renal denervation market analysis is conducted by constructing market estimations for key market segments between 2021 and 2030.
  • Extensive analysis of the renal denervation market growth is conducted by following key product positioning and monitoring of top competitors within the market framework.
  • The report includes renal denervation market opportunity. 
  • The global renal denervation market forecast analysis from 2021 to 2030 is included in the report.
  • The key players within renal denervation market are profiled in this report and their strategies are analyzed thoroughly, which help understand the competitive outlook of the renal denervation industry.

Renal Denervation Market Report Highlights

Aspects Details
By Product Type
  • Symplicity
  • Enlightn
  • Vessix
  • Paradise
  • Iberis
  • Others
By TECHNOLOGY
  • Radiofrequency
  • Ultrasound
  • Micro-Infusion
By END USER
  • Hospitals
  • Specialty Clinics
  • Others
By Region
  • Asia-Pacific  (China, India, Japan, Australia, Rest of Asia-Pacific)
  • Europe  (Germany, France, UK, Italy, Rest of Europe)
  • LAMEA  (Latin America, Middle East, Africa)
  • North America  (U.S., Canada, Mexico)
Key Market Players Boston Scientific Corporation, Cardiosonic Ltd, terumo corporation, ReCor Medical, Inc, Mercator MedSystems, Inc, Renal Dynamics Limited, Abbott Laboratories, Johnson & Johnson, Ablative Solutions, Inc, Medtronic plc
 
  • CHAPTER 1:INTRODUCTION

    • 1.1.Report description

    • 1.2.Key market segments

    • 1.3.Key benefits to the stakeholders

    • 1.4.Research Methodology

      • 1.4.1.Secondary research

      • 1.4.2.Primary research

      • 1.4.3.Analyst tools and models

  • CHAPTER 2:EXECUTIVE SUMMARY

    • 2.1.Key findings of the study

    • 2.2.CXO Perspective

  • CHAPTER 3:MARKET OVERVIEW

    • 3.1.Market definition and scope

    • 3.2.Key findings

      • 3.2.1.Top investment pockets

    • 3.3.Porter’s five forces analysis

    • 3.4.Top player positioning

    • 3.5.Market dynamics

      • 3.5.1.Drivers

      • 3.5.2.Restraints

      • 3.5.3.Opportunities

    • 3.6.COVID-19 Impact Analysis on the market

  • CHAPTER 4: RENAL DENERVATION MARKET, BY PRODUCT TYPE

    • 4.1 Overview

      • 4.1.1 Market size and forecast

    • 4.2 Symplicity

      • 4.2.1 Key market trends, growth factors and opportunities

      • 4.2.2 Market size and forecast, by region

      • 4.2.3 Market analysis by country

    • 4.3 Enlightn

      • 4.3.1 Key market trends, growth factors and opportunities

      • 4.3.2 Market size and forecast, by region

      • 4.3.3 Market analysis by country

    • 4.4 Vessix

      • 4.4.1 Key market trends, growth factors and opportunities

      • 4.4.2 Market size and forecast, by region

      • 4.4.3 Market analysis by country

    • 4.5 Paradise

      • 4.5.1 Key market trends, growth factors and opportunities

      • 4.5.2 Market size and forecast, by region

      • 4.5.3 Market analysis by country

    • 4.6 Iberis

      • 4.6.1 Key market trends, growth factors and opportunities

      • 4.6.2 Market size and forecast, by region

      • 4.6.3 Market analysis by country

    • 4.7 Others

      • 4.7.1 Key market trends, growth factors and opportunities

      • 4.7.2 Market size and forecast, by region

      • 4.7.3 Market analysis by country

  • CHAPTER 5: RENAL DENERVATION MARKET, BY TECHNOLOGY

    • 5.1 Overview

      • 5.1.1 Market size and forecast

    • 5.2 Radiofrequency

      • 5.2.1 Key market trends, growth factors and opportunities

      • 5.2.2 Market size and forecast, by region

      • 5.2.3 Market analysis by country

    • 5.3 Ultrasound

      • 5.3.1 Key market trends, growth factors and opportunities

      • 5.3.2 Market size and forecast, by region

      • 5.3.3 Market analysis by country

    • 5.4 Micro-Infusion

      • 5.4.1 Key market trends, growth factors and opportunities

      • 5.4.2 Market size and forecast, by region

      • 5.4.3 Market analysis by country

  • CHAPTER 6: RENAL DENERVATION MARKET, BY END USER

    • 6.1 Overview

      • 6.1.1 Market size and forecast

    • 6.2 Hospitals

      • 6.2.1 Key market trends, growth factors and opportunities

      • 6.2.2 Market size and forecast, by region

      • 6.2.3 Market analysis by country

    • 6.3 Specialty Clinics

      • 6.3.1 Key market trends, growth factors and opportunities

      • 6.3.2 Market size and forecast, by region

      • 6.3.3 Market analysis by country

    • 6.4 Others

      • 6.4.1 Key market trends, growth factors and opportunities

      • 6.4.2 Market size and forecast, by region

      • 6.4.3 Market analysis by country

  • CHAPTER 7: RENAL DENERVATION MARKET, BY REGION

    • 7.1 Overview

      • 7.1.1 Market size and forecast

    • 7.2 Asia-Pacific

      • 7.2.1 Key trends and opportunities

      • 7.2.2 Asia-Pacific Market size and forecast, by Product Type

      • 7.2.3 Asia-Pacific Market size and forecast, by Technology

      • 7.2.4 Asia-Pacific Market size and forecast, by End User

      • 7.2.5 Asia-Pacific Market size and forecast, by country

        • 7.2.5.1 China
          • 7.2.5.1.1 Market size and forecast, by Product Type
          • 7.2.5.1.2 Market size and forecast, by Technology
          • 7.2.5.1.3 Market size and forecast, by End User
        • 7.2.5.2 India
          • 7.2.5.2.1 Market size and forecast, by Product Type
          • 7.2.5.2.2 Market size and forecast, by Technology
          • 7.2.5.2.3 Market size and forecast, by End User
        • 7.2.5.3 Japan
          • 7.2.5.3.1 Market size and forecast, by Product Type
          • 7.2.5.3.2 Market size and forecast, by Technology
          • 7.2.5.3.3 Market size and forecast, by End User
        • 7.2.5.4 Australia
          • 7.2.5.4.1 Market size and forecast, by Product Type
          • 7.2.5.4.2 Market size and forecast, by Technology
          • 7.2.5.4.3 Market size and forecast, by End User
        • 7.2.5.5 Rest of Asia-Pacific
          • 7.2.5.5.1 Market size and forecast, by Product Type
          • 7.2.5.5.2 Market size and forecast, by Technology
          • 7.2.5.5.3 Market size and forecast, by End User
    • 7.3 Europe

      • 7.3.1 Key trends and opportunities

      • 7.3.2 Europe Market size and forecast, by Product Type

      • 7.3.3 Europe Market size and forecast, by Technology

      • 7.3.4 Europe Market size and forecast, by End User

      • 7.3.5 Europe Market size and forecast, by country

        • 7.3.5.1 Germany
          • 7.3.5.1.1 Market size and forecast, by Product Type
          • 7.3.5.1.2 Market size and forecast, by Technology
          • 7.3.5.1.3 Market size and forecast, by End User
        • 7.3.5.2 France
          • 7.3.5.2.1 Market size and forecast, by Product Type
          • 7.3.5.2.2 Market size and forecast, by Technology
          • 7.3.5.2.3 Market size and forecast, by End User
        • 7.3.5.3 U.K.
          • 7.3.5.3.1 Market size and forecast, by Product Type
          • 7.3.5.3.2 Market size and forecast, by Technology
          • 7.3.5.3.3 Market size and forecast, by End User
        • 7.3.5.4 Italy
          • 7.3.5.4.1 Market size and forecast, by Product Type
          • 7.3.5.4.2 Market size and forecast, by Technology
          • 7.3.5.4.3 Market size and forecast, by End User
        • 7.3.5.5 Rest of Europe
          • 7.3.5.5.1 Market size and forecast, by Product Type
          • 7.3.5.5.2 Market size and forecast, by Technology
          • 7.3.5.5.3 Market size and forecast, by End User
    • 7.4 LAMEA

      • 7.4.1 Key trends and opportunities

      • 7.4.2 LAMEA Market size and forecast, by Product Type

      • 7.4.3 LAMEA Market size and forecast, by Technology

      • 7.4.4 LAMEA Market size and forecast, by End User

      • 7.4.5 LAMEA Market size and forecast, by country

        • 7.4.5.1 Latin America
          • 7.4.5.1.1 Market size and forecast, by Product Type
          • 7.4.5.1.2 Market size and forecast, by Technology
          • 7.4.5.1.3 Market size and forecast, by End User
        • 7.4.5.2 Middle East
          • 7.4.5.2.1 Market size and forecast, by Product Type
          • 7.4.5.2.2 Market size and forecast, by Technology
          • 7.4.5.2.3 Market size and forecast, by End User
        • 7.4.5.3 Africa
          • 7.4.5.3.1 Market size and forecast, by Product Type
          • 7.4.5.3.2 Market size and forecast, by Technology
          • 7.4.5.3.3 Market size and forecast, by End User
    • 7.5 North America

      • 7.5.1 Key trends and opportunities

      • 7.5.2 North America Market size and forecast, by Product Type

      • 7.5.3 North America Market size and forecast, by Technology

      • 7.5.4 North America Market size and forecast, by End User

      • 7.5.5 North America Market size and forecast, by country

        • 7.5.5.1 U.S.
          • 7.5.5.1.1 Market size and forecast, by Product Type
          • 7.5.5.1.2 Market size and forecast, by Technology
          • 7.5.5.1.3 Market size and forecast, by End User
        • 7.5.5.2 Canada
          • 7.5.5.2.1 Market size and forecast, by Product Type
          • 7.5.5.2.2 Market size and forecast, by Technology
          • 7.5.5.2.3 Market size and forecast, by End User
        • 7.5.5.3 Mexico
          • 7.5.5.3.1 Market size and forecast, by Product Type
          • 7.5.5.3.2 Market size and forecast, by Technology
          • 7.5.5.3.3 Market size and forecast, by End User
  • CHAPTER 8: COMPANY LANDSCAPE

    • 8.1. Introduction

    • 8.2. Top winning strategies

    • 8.3. Product Mapping of Top 10 Player

    • 8.4. Competitive Dashboard

    • 8.5. Competitive Heatmap

    • 8.6. Key developments

  • CHAPTER 9: COMPANY PROFILES

    • 9.1 Ablative Solutions, Inc

      • 9.1.1 Company overview

      • 9.1.2 Company snapshot

      • 9.1.3 Operating business segments

      • 9.1.4 Product portfolio

      • 9.1.5 Business performance

      • 9.1.6 Key strategic moves and developments

    • 9.2 Abbott Laboratories

      • 9.2.1 Company overview

      • 9.2.2 Company snapshot

      • 9.2.3 Operating business segments

      • 9.2.4 Product portfolio

      • 9.2.5 Business performance

      • 9.2.6 Key strategic moves and developments

    • 9.3 Johnson & Johnson

      • 9.3.1 Company overview

      • 9.3.2 Company snapshot

      • 9.3.3 Operating business segments

      • 9.3.4 Product portfolio

      • 9.3.5 Business performance

      • 9.3.6 Key strategic moves and developments

    • 9.4 Cardiosonic Ltd

      • 9.4.1 Company overview

      • 9.4.2 Company snapshot

      • 9.4.3 Operating business segments

      • 9.4.4 Product portfolio

      • 9.4.5 Business performance

      • 9.4.6 Key strategic moves and developments

    • 9.5 Boston Scientific Corporation

      • 9.5.1 Company overview

      • 9.5.2 Company snapshot

      • 9.5.3 Operating business segments

      • 9.5.4 Product portfolio

      • 9.5.5 Business performance

      • 9.5.6 Key strategic moves and developments

    • 9.6 Medtronic plc

      • 9.6.1 Company overview

      • 9.6.2 Company snapshot

      • 9.6.3 Operating business segments

      • 9.6.4 Product portfolio

      • 9.6.5 Business performance

      • 9.6.6 Key strategic moves and developments

    • 9.7 Mercator MedSystems, Inc

      • 9.7.1 Company overview

      • 9.7.2 Company snapshot

      • 9.7.3 Operating business segments

      • 9.7.4 Product portfolio

      • 9.7.5 Business performance

      • 9.7.6 Key strategic moves and developments

    • 9.8 ReCor Medical, Inc

      • 9.8.1 Company overview

      • 9.8.2 Company snapshot

      • 9.8.3 Operating business segments

      • 9.8.4 Product portfolio

      • 9.8.5 Business performance

      • 9.8.6 Key strategic moves and developments

    • 9.9 Renal Dynamics Limited

      • 9.9.1 Company overview

      • 9.9.2 Company snapshot

      • 9.9.3 Operating business segments

      • 9.9.4 Product portfolio

      • 9.9.5 Business performance

      • 9.9.6 Key strategic moves and developments

    • 9.10 terumo corporation

      • 9.10.1 Company overview

      • 9.10.2 Company snapshot

      • 9.10.3 Operating business segments

      • 9.10.4 Product portfolio

      • 9.10.5 Business performance

      • 9.10.6 Key strategic moves and developments

  • LIST OF TABLES

  • TABLE 1. GLOBAL RENAL DENERVATION MARKET, BY PRODUCT TYPE, 2020-2030,($THOUSAND)
    TABLE 2. RENAL DENERVATION MARKET REVENUE, FOR SYMPLICITY, BY REGION , 2020-2030,($THOUSAND)
    TABLE 3. RENAL DENERVATION MARKET SYMPLICITY BY COUNTRY, 2020-2030,($THOUSAND)
    TABLE 4. RENAL DENERVATION MARKET REVENUE, FOR ENLIGHTN, BY REGION , 2020-2030,($THOUSAND)
    TABLE 5. RENAL DENERVATION MARKET ENLIGHTN BY COUNTRY, 2020-2030,($THOUSAND)
    TABLE 6. RENAL DENERVATION MARKET REVENUE, FOR VESSIX, BY REGION , 2020-2030,($THOUSAND)
    TABLE 7. RENAL DENERVATION MARKET VESSIX BY COUNTRY, 2020-2030,($THOUSAND)
    TABLE 8. RENAL DENERVATION MARKET REVENUE, FOR PARADISE, BY REGION , 2020-2030,($THOUSAND)
    TABLE 9. RENAL DENERVATION MARKET PARADISE BY COUNTRY, 2020-2030,($THOUSAND)
    TABLE 10. RENAL DENERVATION MARKET REVENUE, FOR IBERIS, BY REGION , 2020-2030,($THOUSAND)
    TABLE 11. RENAL DENERVATION MARKET IBERIS BY COUNTRY, 2020-2030,($THOUSAND)
    TABLE 12. RENAL DENERVATION MARKET REVENUE, FOR OTHERS, BY REGION , 2020-2030,($THOUSAND)
    TABLE 13. RENAL DENERVATION MARKET OTHERS BY COUNTRY, 2020-2030,($THOUSAND)
    TABLE 14. GLOBAL RENAL DENERVATION MARKET, BY TECHNOLOGY, 2020-2030,($THOUSAND)
    TABLE 15. RENAL DENERVATION MARKET REVENUE, FOR RADIOFREQUENCY, BY REGION , 2020-2030,($THOUSAND)
    TABLE 16. RENAL DENERVATION MARKET RADIOFREQUENCY BY COUNTRY, 2020-2030,($THOUSAND)
    TABLE 17. RENAL DENERVATION MARKET REVENUE, FOR ULTRASOUND, BY REGION , 2020-2030,($THOUSAND)
    TABLE 18. RENAL DENERVATION MARKET ULTRASOUND BY COUNTRY, 2020-2030,($THOUSAND)
    TABLE 19. RENAL DENERVATION MARKET REVENUE, FOR MICRO-INFUSION, BY REGION , 2020-2030,($THOUSAND)
    TABLE 20. RENAL DENERVATION MARKET MICRO-INFUSION BY COUNTRY, 2020-2030,($THOUSAND)
    TABLE 21. GLOBAL RENAL DENERVATION MARKET, BY END USER, 2020-2030,($THOUSAND)
    TABLE 22. RENAL DENERVATION MARKET REVENUE, FOR HOSPITALS, BY REGION , 2020-2030,($THOUSAND)
    TABLE 23. RENAL DENERVATION MARKET HOSPITALS BY COUNTRY, 2020-2030,($THOUSAND)
    TABLE 24. RENAL DENERVATION MARKET REVENUE, FOR SPECIALTY CLINICS, BY REGION , 2020-2030,($THOUSAND)
    TABLE 25. RENAL DENERVATION MARKET SPECIALTY CLINICS BY COUNTRY, 2020-2030,($THOUSAND)
    TABLE 26. RENAL DENERVATION MARKET REVENUE, FOR OTHERS, BY REGION , 2020-2030,($THOUSAND)
    TABLE 27. RENAL DENERVATION MARKET OTHERS BY COUNTRY, 2020-2030,($THOUSAND)
    TABLE 28. RENAL DENERVATION MARKET, BY REGION, 2020-2030,($THOUSAND)
    TABLE 29. ASIA-PACIFIC RENAL DENERVATION MARKET, BY PRODUCT TYPE, 2020-2030,($THOUSAND)
    TABLE 30. ASIA-PACIFIC RENAL DENERVATION MARKET, BY TECHNOLOGY, 2020-2030,($THOUSAND)
    TABLE 31. ASIA-PACIFIC RENAL DENERVATION MARKET, BY END USER, 2020-2030,($THOUSAND)
    TABLE 32. ASIA-PACIFIC RENAL DENERVATION MARKET, BY COUNTRY, 2020-2030,($THOUSAND)
    TABLE 33. CHINA RENAL DENERVATION MARKET BY PRODUCT TYPE 2020-2030,($THOUSAND)
    TABLE 34. CHINA RENAL DENERVATION MARKET BY TECHNOLOGY 2020-2030,($THOUSAND)
    TABLE 35. CHINA RENAL DENERVATION MARKET BY END USER 2020-2030,($THOUSAND)
    TABLE 36. INDIA RENAL DENERVATION MARKET BY PRODUCT TYPE 2020-2030,($THOUSAND)
    TABLE 37. INDIA RENAL DENERVATION MARKET BY TECHNOLOGY 2020-2030,($THOUSAND)
    TABLE 38. INDIA RENAL DENERVATION MARKET BY END USER 2020-2030,($THOUSAND)
    TABLE 39. JAPAN RENAL DENERVATION MARKET BY PRODUCT TYPE 2020-2030,($THOUSAND)
    TABLE 40. JAPAN RENAL DENERVATION MARKET BY TECHNOLOGY 2020-2030,($THOUSAND)
    TABLE 41. JAPAN RENAL DENERVATION MARKET BY END USER 2020-2030,($THOUSAND)
    TABLE 42. AUSTRALIA RENAL DENERVATION MARKET BY PRODUCT TYPE 2020-2030,($THOUSAND)
    TABLE 43. AUSTRALIA RENAL DENERVATION MARKET BY TECHNOLOGY 2020-2030,($THOUSAND)
    TABLE 44. AUSTRALIA RENAL DENERVATION MARKET BY END USER 2020-2030,($THOUSAND)
    TABLE 45. REST OF ASIA-PACIFIC RENAL DENERVATION MARKET BY PRODUCT TYPE 2020-2030,($THOUSAND)
    TABLE 46. REST OF ASIA-PACIFIC RENAL DENERVATION MARKET BY TECHNOLOGY 2020-2030,($THOUSAND)
    TABLE 47. REST OF ASIA-PACIFIC RENAL DENERVATION MARKET BY END USER 2020-2030,($THOUSAND)
    TABLE 48. EUROPE RENAL DENERVATION MARKET, BY PRODUCT TYPE, 2020-2030,($THOUSAND)
    TABLE 49. EUROPE RENAL DENERVATION MARKET, BY TECHNOLOGY, 2020-2030,($THOUSAND)
    TABLE 50. EUROPE RENAL DENERVATION MARKET, BY END USER, 2020-2030,($THOUSAND)
    TABLE 51. EUROPE RENAL DENERVATION MARKET, BY COUNTRY, 2020-2030,($THOUSAND)
    TABLE 52. GERMANY RENAL DENERVATION MARKET BY PRODUCT TYPE 2020-2030,($THOUSAND)
    TABLE 53. GERMANY RENAL DENERVATION MARKET BY TECHNOLOGY 2020-2030,($THOUSAND)
    TABLE 54. GERMANY RENAL DENERVATION MARKET BY END USER 2020-2030,($THOUSAND)
    TABLE 55. FRANCE RENAL DENERVATION MARKET BY PRODUCT TYPE 2020-2030,($THOUSAND)
    TABLE 56. FRANCE RENAL DENERVATION MARKET BY TECHNOLOGY 2020-2030,($THOUSAND)
    TABLE 57. FRANCE RENAL DENERVATION MARKET BY END USER 2020-2030,($THOUSAND)
    TABLE 58. U.K. RENAL DENERVATION MARKET BY PRODUCT TYPE 2020-2030,($THOUSAND)
    TABLE 59. U.K. RENAL DENERVATION MARKET BY TECHNOLOGY 2020-2030,($THOUSAND)
    TABLE 60. U.K. RENAL DENERVATION MARKET BY END USER 2020-2030,($THOUSAND)
    TABLE 61. ITALY RENAL DENERVATION MARKET BY PRODUCT TYPE 2020-2030,($THOUSAND)
    TABLE 62. ITALY RENAL DENERVATION MARKET BY TECHNOLOGY 2020-2030,($THOUSAND)
    TABLE 63. ITALY RENAL DENERVATION MARKET BY END USER 2020-2030,($THOUSAND)
    TABLE 64. REST OF EUROPE RENAL DENERVATION MARKET BY PRODUCT TYPE 2020-2030,($THOUSAND)
    TABLE 65. REST OF EUROPE RENAL DENERVATION MARKET BY TECHNOLOGY 2020-2030,($THOUSAND)
    TABLE 66. REST OF EUROPE RENAL DENERVATION MARKET BY END USER 2020-2030,($THOUSAND)
    TABLE 67. LAMEA RENAL DENERVATION MARKET, BY PRODUCT TYPE, 2020-2030,($THOUSAND)
    TABLE 68. LAMEA RENAL DENERVATION MARKET, BY TECHNOLOGY, 2020-2030,($THOUSAND)
    TABLE 69. LAMEA RENAL DENERVATION MARKET, BY END USER, 2020-2030,($THOUSAND)
    TABLE 70. LAMEA RENAL DENERVATION MARKET, BY COUNTRY, 2020-2030,($THOUSAND)
    TABLE 71. LATIN AMERICA RENAL DENERVATION MARKET BY PRODUCT TYPE 2020-2030,($THOUSAND)
    TABLE 72. LATIN AMERICA RENAL DENERVATION MARKET BY TECHNOLOGY 2020-2030,($THOUSAND)
    TABLE 73. LATIN AMERICA RENAL DENERVATION MARKET BY END USER 2020-2030,($THOUSAND)
    TABLE 74. MIDDLE EAST RENAL DENERVATION MARKET BY PRODUCT TYPE 2020-2030,($THOUSAND)
    TABLE 75. MIDDLE EAST RENAL DENERVATION MARKET BY TECHNOLOGY 2020-2030,($THOUSAND)
    TABLE 76. MIDDLE EAST RENAL DENERVATION MARKET BY END USER 2020-2030,($THOUSAND)
    TABLE 77. AFRICA RENAL DENERVATION MARKET BY PRODUCT TYPE 2020-2030,($THOUSAND)
    TABLE 78. AFRICA RENAL DENERVATION MARKET BY TECHNOLOGY 2020-2030,($THOUSAND)
    TABLE 79. AFRICA RENAL DENERVATION MARKET BY END USER 2020-2030,($THOUSAND)
    TABLE 80. NORTH AMERICA RENAL DENERVATION MARKET, BY PRODUCT TYPE, 2020-2030,($THOUSAND)
    TABLE 81. NORTH AMERICA RENAL DENERVATION MARKET, BY TECHNOLOGY, 2020-2030,($THOUSAND)
    TABLE 82. NORTH AMERICA RENAL DENERVATION MARKET, BY END USER, 2020-2030,($THOUSAND)
    TABLE 83. NORTH AMERICA RENAL DENERVATION MARKET, BY COUNTRY, 2020-2030,($THOUSAND)
    TABLE 84. U.S. RENAL DENERVATION MARKET BY PRODUCT TYPE 2020-2030,($THOUSAND)
    TABLE 85. U.S. RENAL DENERVATION MARKET BY TECHNOLOGY 2020-2030,($THOUSAND)
    TABLE 86. U.S. RENAL DENERVATION MARKET BY END USER 2020-2030,($THOUSAND)
    TABLE 87. CANADA RENAL DENERVATION MARKET BY PRODUCT TYPE 2020-2030,($THOUSAND)
    TABLE 88. CANADA RENAL DENERVATION MARKET BY TECHNOLOGY 2020-2030,($THOUSAND)
    TABLE 89. CANADA RENAL DENERVATION MARKET BY END USER 2020-2030,($THOUSAND)
    TABLE 90. MEXICO RENAL DENERVATION MARKET BY PRODUCT TYPE 2020-2030,($THOUSAND)
    TABLE 91. MEXICO RENAL DENERVATION MARKET BY TECHNOLOGY 2020-2030,($THOUSAND)
    TABLE 92. MEXICO RENAL DENERVATION MARKET BY END USER 2020-2030,($THOUSAND)
    TABLE 93.ABLATIVE SOLUTIONS, INC: COMPANY SNAPSHOT
    TABLE 94.ABLATIVE SOLUTIONS, INC: OPERATING SEGMENTS
    TABLE 95.ABLATIVE SOLUTIONS, INC: PRODUCT PORTFOLIO
    TABLE 96.ABLATIVE SOLUTIONS, INC: NET SALES,
    TABLE 97.ABLATIVE SOLUTIONS, INC: KEY STRATERGIES
    TABLE 98.ABBOTT LABORATORIES: COMPANY SNAPSHOT
    TABLE 99.ABBOTT LABORATORIES: OPERATING SEGMENTS
    TABLE 100.ABBOTT LABORATORIES: PRODUCT PORTFOLIO
    TABLE 101.ABBOTT LABORATORIES: NET SALES,
    TABLE 102.ABBOTT LABORATORIES: KEY STRATERGIES
    TABLE 103.JOHNSON & JOHNSON: COMPANY SNAPSHOT
    TABLE 104.JOHNSON & JOHNSON: OPERATING SEGMENTS
    TABLE 105.JOHNSON & JOHNSON: PRODUCT PORTFOLIO
    TABLE 106.JOHNSON & JOHNSON: NET SALES,
    TABLE 107.JOHNSON & JOHNSON: KEY STRATERGIES
    TABLE 108.CARDIOSONIC LTD: COMPANY SNAPSHOT
    TABLE 109.CARDIOSONIC LTD: OPERATING SEGMENTS
    TABLE 110.CARDIOSONIC LTD: PRODUCT PORTFOLIO
    TABLE 111.CARDIOSONIC LTD: NET SALES,
    TABLE 112.CARDIOSONIC LTD: KEY STRATERGIES
    TABLE 113.BOSTON SCIENTIFIC CORPORATION: COMPANY SNAPSHOT
    TABLE 114.BOSTON SCIENTIFIC CORPORATION: OPERATING SEGMENTS
    TABLE 115.BOSTON SCIENTIFIC CORPORATION: PRODUCT PORTFOLIO
    TABLE 116.BOSTON SCIENTIFIC CORPORATION: NET SALES,
    TABLE 117.BOSTON SCIENTIFIC CORPORATION: KEY STRATERGIES
    TABLE 118.MEDTRONIC PLC: COMPANY SNAPSHOT
    TABLE 119.MEDTRONIC PLC: OPERATING SEGMENTS
    TABLE 120.MEDTRONIC PLC: PRODUCT PORTFOLIO
    TABLE 121.MEDTRONIC PLC: NET SALES,
    TABLE 122.MEDTRONIC PLC: KEY STRATERGIES
    TABLE 123.MERCATOR MEDSYSTEMS, INC: COMPANY SNAPSHOT
    TABLE 124.MERCATOR MEDSYSTEMS, INC: OPERATING SEGMENTS
    TABLE 125.MERCATOR MEDSYSTEMS, INC: PRODUCT PORTFOLIO
    TABLE 126.MERCATOR MEDSYSTEMS, INC: NET SALES,
    TABLE 127.MERCATOR MEDSYSTEMS, INC: KEY STRATERGIES
    TABLE 128.RECOR MEDICAL, INC: COMPANY SNAPSHOT
    TABLE 129.RECOR MEDICAL, INC: OPERATING SEGMENTS
    TABLE 130.RECOR MEDICAL, INC: PRODUCT PORTFOLIO
    TABLE 131.RECOR MEDICAL, INC: NET SALES,
    TABLE 132.RECOR MEDICAL, INC: KEY STRATERGIES
    TABLE 133.RENAL DYNAMICS LIMITED: COMPANY SNAPSHOT
    TABLE 134.RENAL DYNAMICS LIMITED: OPERATING SEGMENTS
    TABLE 135.RENAL DYNAMICS LIMITED: PRODUCT PORTFOLIO
    TABLE 136.RENAL DYNAMICS LIMITED: NET SALES,
    TABLE 137.RENAL DYNAMICS LIMITED: KEY STRATERGIES
    TABLE 138.TERUMO CORPORATION: COMPANY SNAPSHOT
    TABLE 139.TERUMO CORPORATION: OPERATING SEGMENTS
    TABLE 140.TERUMO CORPORATION: PRODUCT PORTFOLIO
    TABLE 141.TERUMO CORPORATION: NET SALES,
    TABLE 142.TERUMO CORPORATION: KEY STRATERGIES
  • LIST OF FIGURES

  • FIGURE 1.RENAL DENERVATION MARKET SEGMENTATION
    FIGURE 2.RENAL DENERVATION MARKET,2020-2030
    FIGURE 3.RENAL DENERVATION MARKET,2020-2030
    FIGURE 4. TOP INVESTMENT POCKETS, BY REGION
    FIGURE 5.PORTER FIVE-1
    FIGURE 6.PORTER FIVE-2
    FIGURE 7.PORTER FIVE-3
    FIGURE 8.PORTER FIVE-4
    FIGURE 9.PORTER FIVE-5
    FIGURE 10.TOP PLAYER POSITIONING
    FIGURE 11.RENAL DENERVATION MARKET:DRIVERS, RESTRAINTS AND OPPORTUNITIES
    FIGURE 11.RENAL DENERVATION MARKET,BY PRODUCT TYPE,2020(%)
    FIGURE 12.COMPARATIVE SHARE ANALYSIS OF SYMPLICITY RENAL DENERVATION MARKET,2020-2030(%)
    FIGURE 13.COMPARATIVE SHARE ANALYSIS OF ENLIGHTN RENAL DENERVATION MARKET,2020-2030(%)
    FIGURE 14.COMPARATIVE SHARE ANALYSIS OF VESSIX RENAL DENERVATION MARKET,2020-2030(%)
    FIGURE 15.COMPARATIVE SHARE ANALYSIS OF PARADISE RENAL DENERVATION MARKET,2020-2030(%)
    FIGURE 16.COMPARATIVE SHARE ANALYSIS OF IBERIS RENAL DENERVATION MARKET,2020-2030(%)
    FIGURE 17.COMPARATIVE SHARE ANALYSIS OF OTHERS RENAL DENERVATION MARKET,2020-2030(%)
    FIGURE 18.RENAL DENERVATION MARKET,BY TECHNOLOGY,2020(%)
    FIGURE 19.COMPARATIVE SHARE ANALYSIS OF RADIOFREQUENCY RENAL DENERVATION MARKET,2020-2030(%)
    FIGURE 20.COMPARATIVE SHARE ANALYSIS OF ULTRASOUND RENAL DENERVATION MARKET,2020-2030(%)
    FIGURE 21.COMPARATIVE SHARE ANALYSIS OF MICRO-INFUSION RENAL DENERVATION MARKET,2020-2030(%)
    FIGURE 22.RENAL DENERVATION MARKET,BY END USER,2020(%)
    FIGURE 23.COMPARATIVE SHARE ANALYSIS OF HOSPITALS RENAL DENERVATION MARKET,2020-2030(%)
    FIGURE 24.COMPARATIVE SHARE ANALYSIS OF SPECIALTY CLINICS RENAL DENERVATION MARKET,2020-2030(%)
    FIGURE 25.COMPARATIVE SHARE ANALYSIS OF OTHERS RENAL DENERVATION MARKET,2020-2030(%)
    FIGURE 26.RENAL DENERVATION MARKET BY REGION,2020
    FIGURE 27.CHINA RENAL DENERVATION MARKET,2020-2030($THOUSAND)
    FIGURE 28.INDIA RENAL DENERVATION MARKET,2020-2030($THOUSAND)
    FIGURE 29.JAPAN RENAL DENERVATION MARKET,2020-2030($THOUSAND)
    FIGURE 30.AUSTRALIA RENAL DENERVATION MARKET,2020-2030($THOUSAND)
    FIGURE 31.REST OF ASIA-PACIFIC RENAL DENERVATION MARKET,2020-2030($THOUSAND)
    FIGURE 32.GERMANY RENAL DENERVATION MARKET,2020-2030($THOUSAND)
    FIGURE 33.FRANCE RENAL DENERVATION MARKET,2020-2030($THOUSAND)
    FIGURE 34.U.K. RENAL DENERVATION MARKET,2020-2030($THOUSAND)
    FIGURE 35.ITALY RENAL DENERVATION MARKET,2020-2030($THOUSAND)
    FIGURE 36.REST OF EUROPE RENAL DENERVATION MARKET,2020-2030($THOUSAND)
    FIGURE 37.LATIN AMERICA RENAL DENERVATION MARKET,2020-2030($THOUSAND)
    FIGURE 38.MIDDLE EAST RENAL DENERVATION MARKET,2020-2030($THOUSAND)
    FIGURE 39.AFRICA RENAL DENERVATION MARKET,2020-2030($THOUSAND)
    FIGURE 40.U.S. RENAL DENERVATION MARKET,2020-2030($THOUSAND)
    FIGURE 41.CANADA RENAL DENERVATION MARKET,2020-2030($THOUSAND)
    FIGURE 42.MEXICO RENAL DENERVATION MARKET,2020-2030($THOUSAND)
    FIGURE 43. TOP WINNING STRATEGIES, BY YEAR
    FIGURE 44. TOP WINNING STRATEGIES, BY DEVELOPMENT
    FIGURE 45. TOP WINNING STRATEGIES, BY COMPANY
    FIGURE 46.PRODUCT MAPPING OF TOP 10 PLAYERS
    FIGURE 47.COMPETITIVE DASHBOARD
    FIGURE 48.COMPETITIVE HEATMAP OF TOP 10 KEY PLAYERS
    FIGURE 49.ABLATIVE SOLUTIONS, INC.: NET SALES ,($THOUSAND)
    FIGURE 50.ABBOTT LABORATORIES.: NET SALES ,($THOUSAND)
    FIGURE 51.JOHNSON & JOHNSON.: NET SALES ,($THOUSAND)
    FIGURE 52.CARDIOSONIC LTD.: NET SALES ,($THOUSAND)
    FIGURE 53.BOSTON SCIENTIFIC CORPORATION.: NET SALES ,($THOUSAND)
    FIGURE 54.MEDTRONIC PLC.: NET SALES ,($THOUSAND)
    FIGURE 55.MERCATOR MEDSYSTEMS, INC.: NET SALES ,($THOUSAND)
    FIGURE 56.RECOR MEDICAL, INC.: NET SALES ,($THOUSAND)
    FIGURE 57.RENAL DYNAMICS LIMITED.: NET SALES ,($THOUSAND)
    FIGURE 58.TERUMO CORPORATION.: NET SALES ,($THOUSAND)


The renal denervation market is expected to witness a significant growth in the coming future. The renal denervation market has gained interest of the healthcare and medical sectors owing to increased prevalence of hypertension throughout the globe. Furthermore, availability of alternative and better technologies for renal denervation systems, such as micro-infusion, as well as expanding healthcare infrastructure in emerging nations are expected to promote market growth. For example, Mercator MedSystem's renal denervation technology is based on micro-infusion. It distributes chemicals to a precise location to denervate the renal artery, which helps in lowering patient blood pressure.

Various market players have adopted strategies to expand its business and strengthen its market position. For instance, in 2019, Abbott Laboratories, manufacturer of medical devices and technologies has acquired St. Jude Medical to offer renal denervation systems for treatment of hypertension. It offers EnligHTN Renal Denervation, which enables latest efficiencies in treating hypertension. It also reduces systolic blood pressure in patient. As a result, key players have acquired other companies to offer renal denervation systems that fuel the market growth.

PURCHASE OPTIONS

Call or Email us

U.S.-Canada Toll-free: +1-800-792-5285
Int'l : +1-503-894-6022
Europe : +44-845-528-1300
Email : help@alliedmarketresearch.com
 
FREQUENTLY ASKED QUESTIONS?

A. The global renal denervation market size was valued at $156,327.4 thousand in 2020, and is projected to reach $4,555,983.0 thousand by 2030

A. Europe is the largest regional market for Renal Denervation

A. Radiofrequency is the leading technology of Renal Denervation Market

A. Increase in change in lifestyle that lead to resistant hypertension and an increase in the prevalence of hypertension will propel the renal denervation market

A. Ablative Solutions, Inc., Abbott Laboratories, Johnson & Johnson, Cardiosonic Ltd, Boston Scientific Corporation, Medtronic plc, Mercator MedSystems, Inc., ReCor Medical, Inc., Renal Dynamics Limited, and Terumo Corporation

Looking for Customization?

 Customization Request

Have a Question?

 Speak with Analyst

Any Confusion?

 Inquire Before Buying

Have a glance of the Report

  Request Sample
RELATED TAGS

Purchase Full Report of
Renal Denervation Market

Start reading instantly.
This Report and over 66,983+ more Reports, Available with Avenue Library. T&C*.

  • Online Only
  • $3,456
  • Online cloud access only
  • Restricted print, copy, paste & download
  • Read only
  • Free industry update
    (Within 180 days)
  • Free report update in next update cycle
    (Mar 2023 - Mar 2024)
  • Data Pack
  • $3,840
  • Restricted to one authorized user
  • One print only
  • Available in
    Excel
  • Free industry update
    (Within 180 days)
  •   Free report update in next update cycle
    (Mar 2023 - Mar 2024)
  • Single User
  • $5,769
  • Restricted to one authorized user
  • One print only
  • Available in
    PDF
  • Free industry update
    (Within 180 days)
  •   Free report update in next update cycle
    (Mar 2023 - Mar 2024)
  • Five Users
  • $6,450
  • Limited to five authorized users
  • Print upto five copies
  • Available in
    PDF
  • Free industry update
    (Within 180 days)
  •   Free report update in next update cycle
    (Mar 2023 - Mar 2024)
  • Enterprise
    License/PDF

  • $10,995
  • Unlimited
    within
    company/enterprise
  • Available in Excel & PDF
  • Free industry update
    (Within 180 days)
  •   Free report update in next update cycle
    (Mar 2023 - Mar 2024)
  • Library
    Membership

  • $999 $ 1,175
    Per User/ Per month/ Billed annually
  • Published Content
    E-access
  • Company Profiles
    E-access
  • Newly Added Content Access
  • 10 PDF
    Downloads
  • 5 Excel Data
    Pack Downloads
  • 250 Company Profiles PDF Downloads
  • Buy Now

*Taxes/Fees, if applicable will be added during checkout. All prices in USD

RELATED REPORTS
 

Why Allied Market Research?


Infallible Methodology

To ensure high-level data integrity, accurate analysis, and impeccable forecasts

Analyst Support

For complete satisfaction

Customization

On-demand customization of scope of the report to exactly meet your needs

TARGETED MARKET VIEW

Targeted market view to provide pertinent information and save time of readers

Get fresh content delivered

Get insights on topics that are crucial for your business. Stay abreast of your interest areas.

Get Industry Data Alerts

Why Allied Market Research?

Infallible Methodology

To ensure high-level data integrity, accurate analysis, and impeccable forecasts

Analyst Support

For complete satisfaction

Customization

On-demand customization of scope of the report to exactly meet your needs

TARGETED MARKET VIEW

Targeted market view to provide pertinent information and save time of readers