
Renters Insurance Market Research, 2034
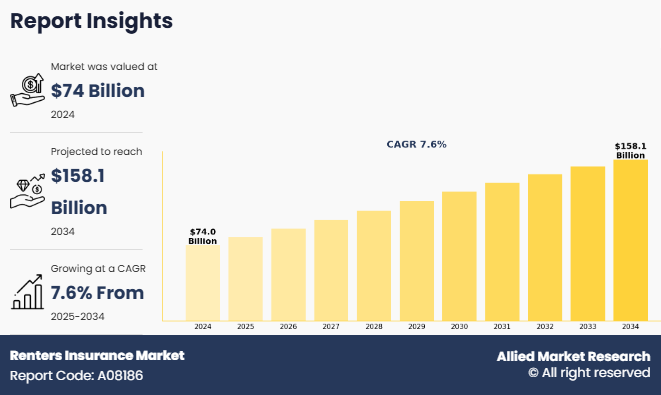
The renters insurance market was valued at $74 billion in 2024 and is estimated to reach $158.1 billion by 2034, exhibiting a CAGR of 7.6% from 2025 to 2034. The renters insurance industry includes companies that offer insurance policies to people who rent homes or apartments. Renters insurance provides financial protection for personal belongings in case of theft, fire, water damage, or other unexpected events. Renters coverage may also include liability if someone gets injured in the rented space. Unlike homeowners insurance, it does not cover the building itself, only the tenant’s possessions and personal liability. This type of insurance is often affordable and is becoming more popular as more people choose to rent rather than buy homes. The renters insurance market is growing due to increased awareness, digital access to policies, and the rise in renting among young adults and urban populations. It helps renters feel more secure and protected.
Key Takeaways:
- By Coverage Type, the liability coverage segment held the largest share in the renters insurance market for 2024.
- By Application, the residential segment held the largest share in the renters insurance market for 2024.
- By Distribution Channel, the agents and broker segment held the largest share in the renters insurance market for 2024.
- Region-wise, North America held the largest market share in 2024. However, Asia-Pacific is expected to witness the highest CAGR during the forecast period.
The renters insurance market is growing as more people move to cities and choose to rent homes or apartments. Urban renters often own valuable items like electronics, appliances, and smart devices that they want to protect. The rise of Internet of Things (IoT) products has led to higher demand for coverage of smart home devices, wearables, and connected technology. Consumers now prefer flexible insurance plans that suit their specific needs, pushing providers to offer customizable options. Extra services like fast repairs, on-site help, and accidental damage coverage help insurers stand out. As digital devices become a major part of daily life, renters demands stronger protection. This growing trend in urban living and tech use is boosting the demand for the renters insurance market. However, the lack of awareness and understanding about renters insurance prevents many renters from buying coverage, hindering the renters insurance market growth.
Furthermore, the rise in incidents of theft, fire, and natural disasters has increased the demand for renters insurance. People are now more aware of the risks and the importance of protecting their personal belongings. As more renters experience about such unexpected events, they are more interested to invest in renters insurance. This growing need for financial security is driving the renters insurance industry.
Segment Review
The Renters insurance market is segmented on the basis of coverage type, distribution channel, and application and region. By coverage, it is segmented into personal property coverage, liability coverage, and others. By distribution channel, it is classified into agents & broker, bancassurance, and others. By application, it is divided into residential and commerical, and By region, the market is studied across North America, Europe, Asia-Pacific, and LAMEA.
On the basis of application, it is segmented into residential and commerical. The global renters insurance market share was dominated by the residential segment in 2024, This is attributed to the rising number of tenants across urban areas, increasing awareness of property protection, and the affordability of renters insurance policies. In addition, growing incidences of theft, fire, and natural calamities have driven the demand for residential renters insurance, as tenants seek financial protection against potential property and liability losses.
However, the accidental protection plan segment is expected to register the highest CAGR during the forecast period owing to the increase in adoption of insurance coverage by businesses for rented office spaces, retail stores, and warehouses. Rising awareness about liability coverage, asset protection, and risk mitigation among commercial tenants is further fueling the demand for tailored renters insurance solutions in this segment.

On the basis of region, the Renters insurance market was dominated by the North America in 2024 and is expected to maintain its dominance in the upcoming years owing to high rental housing demand, stringent landlord insurance requirements, and widespread consumer awareness. The presence of major insurance providers and technological advancements in policy distribution also contribute to market growth. Additionally, frequent occurrences of natural disasters in the region encourage tenants to secure affordable protection through renters insurance policies.
However, the Asia-Pacific is expected to register the highest CAGR during the forecast period. This is attributed to the rapid urbanization, rising disposable incomes, and increasing awareness of insurance benefits among the growing middle-class population. Moreover, expanding rental housing markets in countries like China and India further support market growth.

Competition Analysis
The report analyzes the profiles of key players operating in the renters insurance market such as TD Insurance, State Farm Mutual Automobile Insurance Company, Allstate Insurance Company, Liberty Mutual Insurance Company, The Travelers Companies, Inc., Nationwide Mutual Insurance Company, Progressive Casualty Insurance Company, GEICO, Erie Indemnity Co., Farmers Group, Inc., USAA Insurance Group, Root Inc., Hippo Enterprises Inc., Kin Insurance Technology Hub, LLC., Assurant Inc., American Modern Insurance Group, The Hartford Insurance Group, Inc., Chubb Limited, Lemonade, Inc., and Westfield Insurance. These players have adopted various strategies to increase their market penetration and strengthen their position in the renters insurance market.
Recent Key Developments in the Renters Insurance Market
- In April 2024, Miami-based insurtech Kanguro Insurance launched its renters insurance in Texas, targeting the Latino community. They offer AI-powered policy creation, affordable bilingual coverage, and streamlined claims—all through partnerships with local agencies and property managers.
- In November 2023, Property management platform TurboTenant expanded its partnership with Sure, integrating digital renters insurance via Sure's API. This mobile-first implementation led to a 30% increase in policy adoption.
Top Impacting Factors
Driver
Increased Landlord Requirements for Renters Insurance
The increase in the number of landlords requiring tenants to have renters insurance is driving the growth of the renters insurance market. More landlords are now including renters insurance as a condition in lease agreements. This helps protect both the landlord and the tenant. If something goes wrong, like a fire or water damage, renters insurance can cover the cost of replacing a tenant’s personal belongings. It can also provide liability coverage if someone gets injured in the rented property. In addition, requiring renters insurance reduces potential conflicts and financial losses. It makes sure tenants can cover their own damages without relying on the landlord’s property insurance. This trend is becoming more common, especially in apartment complexes and multi-family housing. Tenants are also becoming more aware of the importance of having this protection. Renters insurance is usually affordable and offers peace of mind, knowing that personal belongings are covered in case of theft, damage, or disaster. As more landlords require it and more tenants see the benefits, the demand for renters insurance is increasing. This growing need is playing a big role in boosting the overall market.
Restraints
Lack of Awareness and Understanding about Renters Insurance
The growth of the renters insurance market is restraining due to the lack of awareness and understanding among consumers. Many renters do not know that renters insurance exists or what it actually covers. Some believe that their landlord’s insurance will protect their personal belongings, which is not true. Landlord insurance typically only covers the building structure, not the tenant’s personal items or liability. Renters often do not see the need for renters insurance. They may not realize that renters insurance can protect them from losses caused by theft, fire, water damage, or even personal liability if someone gets hurt in their rented home. This lack of knowledge makes people less likely to buy a policy, even though it is usually affordable and provides valuable protection.
In addition, some renters think that getting insurance is a complicated process. They may be unsure about how to compare plans or what coverage they need. This confusion can lead to hesitation and delay in purchasing a policy. Insurance providers and landlords have not always done enough to educate renters about the importance and benefits of renters insurance. Without proper information, many renters continue to live without coverage, leaving themselves at risk. To grow the market, more efforts are needed to inform and educate renters through marketing campaigns, simple explanations, and guidance from landlords and insurers. Increasing awareness and understanding could help more people realize the value of renters insurance and encourage them to buy it.
Opportunity
AI And Iot Integration for Proactive Risk Management and Pricing
The integration of artificial intelligence and the internet of things offers significant renters insurance market opportunity. Smart home devices such as sensors, cameras, and smart locks enable insurers to collect real-time data on rental property conditions, helping detect risks like water leaks, fire hazards, or unauthorized access early. AI analyzes this data to identify behavior patterns and predict potential risks, allowing insurers to alert tenants or provide advice to prevent damage, which reduces claims and enhances safety.
Additionally, AI and IoT enable more accurate and personalized pricing models by using real-time risk data instead of general statistics. This approach rewards safer behavior with lower premiums, making tenant insurance more affordable and appealing. These technological advancements improve risk management, loss prevention, and fair pricing, driving innovation and growth. According to the renters insurance market outlook, such trends are expected to play a crucial role in shaping the renters insurance market forecast and overall renters insurance market trends globally.
Key Benefits for Stakeholders
- The study provides an in-depth renters insurance market analysis along with the current trends and future estimations to elucidate the imminent investment pockets.
- Information about key drivers, restraints, & opportunities, and their impact analysis on the renters insurance market size is provided in the report.
- The Porter’s five forces analysis illustrates the potency of buyers and suppliers operating in the cybersecurity industry.
- The quantitative analysis of the global renters insurance market for the period 2024–2034 is provided to determine the renters insurance market potential.
Renters Insurance Market Report Highlights
| Aspects | Details |
| Market Size By 2034 | USD 158.1 billion |
| Growth Rate | CAGR of 7.6% |
| Forecast period | 2024 - 2034 |
| Report Pages | 281 |
| By Coverage Type |
|
| By Application |
|
| By Distribution Channel |
|
| By Region |
|
| Key Market Players | Liberty Mutual Insurance Company, Allstate Insurance Company, The Hartford Insurance Group, Inc., Chubb Limited, Hippo Enterprises Inc., TD Insurance, Progressive Casualty Insurance Company, Nationwide Mutual Insurance Company, Kin Insurance Technology Hub, LLC., Erie Indemnity Co., Lemonade, Inc., GEICO, USAA Insurance Group, American Modern Insurance Group, Westfield Insurance, The Travelers Companies, Inc., Farmers Group, Inc., State Farm Mutual Automobile Insurance Company, Assurant Inc., Root Inc. |
Analyst Review
As the renters insurance market continues to evolve, CXOs are evaluating the opportunities and challenges regarding this emerging technology. the renters insurance market is experiencing growth, driven by the increase in the demand for financial protection, especially among people living in rented homes and apartments. As consumers spend more on personal belongings like electronics, furniture, and household items, they are looking for ways to protect these valuables from unexpected events such as theft, fire, or water damage. Renters insurance offers peace of mind by covering repair or replacement costs, encouraging more renters to buy such plans. The growth in popularity of online platforms has also made it easier for tenants to compare and purchase policies, often during the rental agreement process. This ease of access and flexibility in coverage is fueling the market growth.
In addition, flexible renters insurance plans that fit different budgets and coverage needs are gaining popularity. These options provide affordable protection, making it easier for young adults, students, and low-income renters to get insured. Businesses that rent office spaces or equipment are also buying renters insurance to avoid financial losses due to damages or liability issues. Some government programs and landlord requirements are further encouraging the adoption of renters insurance among tenants.
Moreover, subscription-based renters insurance plans offering monthly payments and add-on benefits like emergency housing support and liability coverage are attracting a growing number of consumers. These models help reduce large direct costs and offer continuous protection. However, challenges remain in making sure renters clearly understand policy terms and limits. Insurers also face difficulties in managing high claim volumes and aligning services with customer expectations. Despite these challenges, the renters insurance market is expected to expand as more individuals and businesses seek reliable protection, reduce unexpected costs, and ensure peace of mind while renting.
Increased use of AI and IoT for personalized pricing, enhanced risk management, and growth in digital, flexible coverage options are the upcoming trends of Renters Insurance Market in the globe.
Residential is the leading application of Renters Insurance Market.
North America is the largest regional market for Renters Insurance.
$158.1 billion is the estimated industry size of Renters Insurance.
TD Insurance, State Farm Mutual Automobile Insurance Company, Allstate Insurance Company, Liberty Mutual Insurance Company , The Travelers Companies, Inc., Nationwide Mutual Insurance Company, Progressive Casualty Insurance Company, GEICO, Erie Indemnity Co., Farmers Group, Inc., USAA Insurance Group, Root Inc., Hippo Enterprises Inc., Kin Insurance Technology Hub, LLC., Assurant Inc., American Modern Insurance Group, The Hartford Insurance Group, Inc., Chubb Limited, Lemonade, Inc., and Westfield Insurance. are the top companies to hold the market share in Renters Insurance.
Loading Table Of Content...
Loading Research Methodology...

