Report Code: A16977 | Jun 2022 | Pages: 220 | ||
Tables: 158 | Charts: 58 |
|
The global revolving doors market size was valued at $908.60 million in 2021, and is projected to reach $1.4 billion by 2031, growing at a CAGR of 4.5% from 2022 to 2031.
Revolving doors contain three or four doors or leaves that rotate around a vertical axis and hang on a central shaft inside a cylindrical enclosure. In addition, they are preferred for their energy efficiency, as they act as airlocks, consequently dropping the energy bills of a residential or commercial building. These doors are designed to allow easy passage of multiple people in one go, which is not possible with a sliding or a swing door.
The COVID-19 pandemic forced many companies in the global revolving doors market to halt business operations for a short term to comply with new government regulations to curb the spread of the disease.
Rapid industrialization and urbanization in the developing and developed countries such as India, China, Brazil, the U.S., the UK, Mexico, and Canada, has boosted the growth of various industries such as commercial, industrial and manufacturing. This, in turn, is expected to boost the demand for revolving doors industry during the forecast period. In addition, increase in population, rise in disposable income, surge in employment rate, and improvement in standard of living in countries such as India, China, Mexico, Canada, Russia, Malaysia, and Thailand, have resulted in the growth of construction industries. This has accelerated the revolving doors market growth.
Revolving door is used at various places such as residential and commercial spaces, hospitals, and others. Factors such as energy saving, ease of operation, maintaining security, fast and accurate, cable free, and others, fuel its demand. Revolving doors in hospital makes it possible for wheelchair operators to travel conveniently; also, they can be used to secure a particular area in scientific labs and hospital. Heavy investment by government in construction and growth in the residential sector are expected to increase the revolving doors market share during the forcast period. However, high maintenance acts as a restraint for the market.
The COVID-19 pandemic forced many companies in the global revolving doors market to halt business operations for a short term to comply with new government regulations to curb the spread of the disease. This halt in operations directly impacted revenue flow of the global revolving door market. In addition, there was a halt in manufacturing of industrial products, owing to lack of raw materials and manpower in the lockdown period. Further, no new consignments were received by companies that operate in this sector. Hence, halt in industrial activities and lockdowns for several months affected the global revolving door market and the market is anticipated to witness a slow recovery during the forecast period.
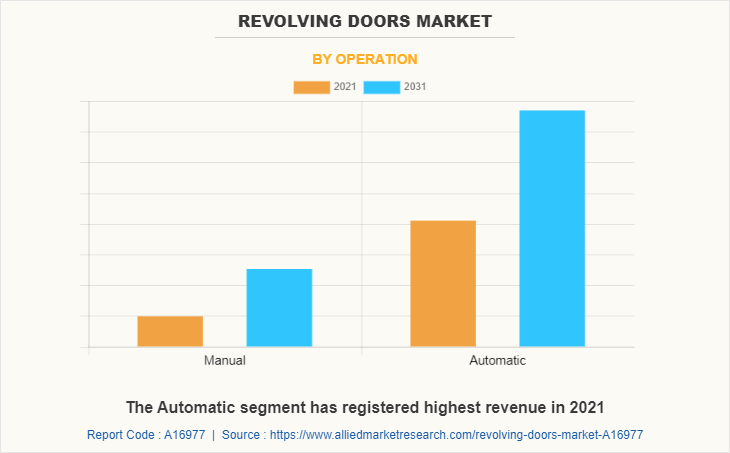
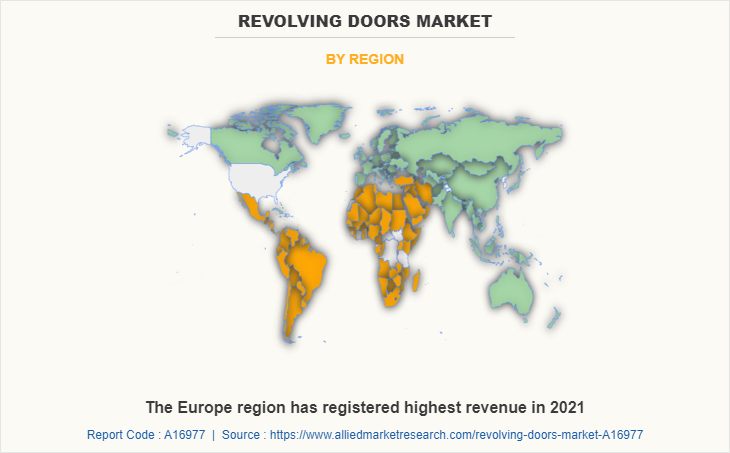
The revolving doors market is segmented into Operation, Product Type and End-Users. By operation, the revolving doors market is categorized into manual and automatic. In 2021, the automatic segment is highest revenue controbutor to the market, in terms of revenue, and is expected to maintain this trend in the coming years. On the basis of product type, the market is fragmented into three wings, four wings and others. Three wings segment is anticipated to dominate the global market throughout the forecast period. On the basis of end user, the market is categorized into commercial and industrial. Commercial segment is the highest revenue contributor to the market. By region, it is analyzed across North America, Europe, Asia-Pacific, and LAMEA. The Europe region is expected to hold the highest market share during the forecast period.
Major players are adopting product launch and acquisition as their key developmental strategies to improve the product portfolio of the revolving doors market. For instance, in August 2021, Royal Boon Edam International B.V. launched the next generation high security doors Tourlock 180 and Tourlock 120. This is expected to improve the product portfolio of the company.
Competitive Analysis
The key players profiled in the revolving doors market report include Assa Abloy Group, Auto Ingress, Deutschtec GmbH, Dormakaba Holding AG, DSS Automatic Doors, ERREKA Group, Grupsa Door System, GEZE GmbH, Landert Group AG, Manusa GEST, S.L, Nabtesco Corporation, PORTALP, Royal Boon Edam International B.V., Stanley Black & Decker, Inc., and Sanwa Holdings Corporation.
Revolving Doors Market Report Highlights
Aspects | Details |
---|---|
By Operation |
|
By Product Type |
|
By End-Users |
|
By Region |
|
Key Market Players | ERREKA Group, Royal Boon Edam International B.V., Stanley Black & Decker, Inc., Dormakaba Holding AG, ASSA ABLOY Group, DSS Automatic Doors, PORTALP, GEZE GmbH, Grupsa Door System, Landert Group AG, Deutschtec GmbH, Sanwa Holdings Corporation, Auto Ingress, Nabtesco Corporation, Manusa GEST, S.L |
CHAPTER 1:INTRODUCTION
1.1.Report description
1.2.Key benefits for stakeholders
1.3.Key market segments
1.4.Research methodology
1.4.1.Primary research
1.4.2.Secondary research
1.5.Analyst tools and models
CHAPTER 2:EXECUTIVE SUMMARY
2.1.CXO perspective
CHAPTER 3:MARKET OVERVIEW
3.1.Market definition and scope
3.2.Key Findings
3.2.1.Top Investment Pockets
3.2.2.Top Winning Strategies
3.2.3.Porter's five forces analysis
3.3.Key player positioning, 2021
3.4.Market dynamics
3.4.1.Drivers
3.4.1.1.Rapid urbanization & industrialization
3.4.1.2.Surge in residential & nonresidential construction
3.4.1.3.Increase in spending on home remodeling
3.4.2.Restraint
3.4.2.1.High initial costs and predictive maintenance
3.4.2.2.Low demand for automation in small & emerging economies
3.4.3.Opportunity
3.4.3.1.Rise in need for safety & security
3.5.COVID-19 Impact Analysis
CHAPTER 4:REVOLVING DOORS MARKET, BY OPERATION
4.1.Overview
4.1.1.Market size and forecast, by operation
4.2.Manual
4.2.1.Key market trends, growth factors, and opportunities
4.2.2.Market size and forecast, by region
4.2.3.Market size and forecast, by country
4.3.Automatic
4.3.1.Key market trends, growth factors, and opportunities
4.3.2.Market size and forecast, by region
4.3.3.Market size and forecast, by country
4.3.4.Market size and forecast, by product type
4.3.4.1.Three wings automatic doors market size and forecast by End User
CHAPTER 5:REVOLVING DOORS MARKET, BY PRODUCT TYPE
5.1.Market overview
5.1.1.Market size and forecast, by Product type
5.2.Three wings
5.2.1.Key market trends, growth factors, and opportunities
5.2.2.Market size and forecast, by region
5.2.3.Market size and forecast, by country
5.3.Four wings
5.3.1.Key market trends, growth factors, and opportunities
5.3.2.Market size and forecast, by region
5.3.3.Market size and forecast, by country
5.4.Others
5.4.1.Key market trends, growth factors, and opportunities
5.4.2.Market size and forecast, by region
5.4.3.Market size and forecast, by country
CHAPTER 6:REVOLVING DOORS MARKET, BY END USER
6.1.Market overview
6.1.1.Market size and forecast, by end user
6.2.Commercial
6.2.1.Key market trends, growth factors, and opportunities
6.2.2.Market size and forecast, by region
6.2.3.Market size and forecast, by country
6.3.Industrial
6.3.1.Key market trends, growth factors, and opportunities
6.3.2.Market size and forecast, by region
6.3.3.Market size and forecast, by country
CHAPTER 7:REVOLVING DOORS MARKET, BY REGION
7.1.Market overview
7.1.1.Market size and forecast
7.2.North America
7.2.1.Key market trends, growth factors, and opportunities
7.2.2.North America Market size and forecast, by operation
7.2.3.North America Market size and forecast, by product type
7.2.4.North America Market size and forecast, by end user
7.2.5.North America Market size and forecast, by country
7.2.5.1.U.S.
7.2.5.1.1.U.S. Market size and forecast, by operation
7.2.5.1.2.U.S. Market size and forecast, by product type
7.2.5.1.3.U.S. Market size and forecast, by end user
7.2.5.2.Canada
7.2.5.2.1.Canada Market size and forecast, by operation
7.2.5.2.2.Canada Market size and forecast, by product type
7.2.5.2.3.Canada Market size and forecast, by end user
7.2.5.3.Mexico
7.2.5.3.1.Mexico Market size and forecast, by operation
7.2.5.3.2.Mexico Market size and forecast, by product type
7.2.5.3.3.Mexico Market size and forecast, by end user
7.3.Europe
7.3.1.Key market trends, growth factors, and opportunities
7.3.2.Europe Market size and forecast, by operation
7.3.3.Europe Market size and forecast, by product type
7.3.4.Europe Market size and forecast, by end user
7.3.5.Europe Market size and forecast, by country
7.3.5.1.Germany
7.3.5.1.1.Germany Market size and forecast, by operation
7.3.5.1.2.Germany Market size and forecast, by product type
7.3.5.1.3.Germany Market size and forecast, by end user
7.3.5.2.Italy
7.3.5.2.1.Italy Market size and forecast, by operation
7.3.5.2.2.Italy Market size and forecast, by product type
7.3.5.2.3.Italy Market size and forecast, by end user
7.3.5.3.UK
7.3.5.3.1.UK Market size and forecast, by operation
7.3.5.3.2.UK Market size and forecast, by product type
7.3.5.3.3.UK Market size and forecast, by end user
7.3.5.4.France
7.3.5.4.1.France Market size and forecast, by operation
7.3.5.4.2.France Market size and forecast, by product type
7.3.5.4.3.France Market size and forecast, by end user
7.3.5.5.Rest of Europe
7.3.5.5.1.Rest of Europe Market size and forecast, by operation
7.3.5.5.2.Rest of Europe Market size and forecast, by product type
7.3.5.5.3.Rest of Europe Market size and forecast, by end user
7.4.Asia-Pacific
7.4.1.Key market trends, growth factors, and opportunities
7.4.2.Asia-Pacific Market size and forecast, by operation
7.4.3.Asia-Pacific Market size and forecast, by product type
7.4.4.Asia-Pacific Market size and forecast, by end user
7.4.5.Asia-Pacific Market size and forecast, by country
7.4.5.1.China
7.4.5.1.1.China Market size and forecast, by operation
7.4.5.1.2.China Market size and forecast, by product type
7.4.5.1.3.China Market size and forecast, by end user
7.4.5.2.Japan
7.4.5.2.1.Japan Market size and forecast, by operation
7.4.5.2.2.Japan Market size and forecast, by product type
7.4.5.2.3.Japan Market size and forecast, by end user
7.4.5.3.India
7.4.5.3.1.India Market size and forecast, by operation
7.4.5.3.2.India Market size and forecast, by product type
7.4.5.3.3.India Market size and forecast, by end user
7.4.5.4.South Korea
7.4.5.4.1.South Korea Market size and forecast, by operation
7.4.5.4.2.South Korea Market size and forecast, by product type
7.4.5.4.3.South Korea Market size and forecast, by end user
7.4.5.5.Rest of Asia-Pacific
7.4.5.5.1.Rest of Asia-Pacific Market size and forecast, by operation
7.4.5.5.2.Rest of Asia-Pacific Market size and forecast, by product type
7.4.5.5.3.Rest of Asia-Pacific Market size and forecast, by end user
7.5.LAMEA
7.5.1.Key market trends, growth factors, and opportunities
7.5.2.LAMEA Market size and forecast, by operation
7.5.3.LAMEA Market size and forecast, by product type
7.5.4.Market size and forecast, by end user
7.5.5.LAMEA Market size and forecast, by country
7.5.5.1.Latin America
7.5.5.1.1.Latin America Market size and forecast, by operation
7.5.5.1.2.Latin America Market size and forecast, by product type
7.5.5.1.3.Latin America Market size and forecast, by end user
7.5.5.2.Middle East
7.5.5.2.1.Middle East Market size and forecast, by operation
7.5.5.2.2.Middle East Market size and forecast, by product type
7.5.5.2.3.Middle East Market size and forecast, by end user
7.5.5.3.Africa
7.5.5.3.1.Africa Market size and forecast, by operation
7.5.5.3.2.Africa Market size and forecast, by product type
7.5.5.3.3.Africa Market size and forecast, by end user
CHAPTER 8:COMPANY PROFILES
8.1.ASSA ABLOY GROUP
8.1.1.Company overview
8.1.2.Key executive
8.1.3.Company snapshot
8.1.4.Operating business segments
8.1.5.Product portfolio
8.1.6.R&D expenses
8.1.7.Business performance
8.1.8.Key strategic moves and developments
8.2.AUTO INGRESS
8.2.1.Company overview
8.2.2.Key executive
8.2.3.Company snapshot
8.2.4.Product portfolio
8.3.DEUTSCHTEC GmbH
8.3.1.Company overview
8.3.2.Key executive
8.3.3.Company snapshot
8.3.4.Product portfolio
8.4.DORMAKABA HOLDING AG
8.4.1.Company overview
8.4.2.Key executive
8.4.3.Company snapshot
8.4.4.Operating business segments
8.4.5.Product portfolio
8.4.6.R&D expenses
8.4.7.Business performance
8.5.DSS AUTOMATIC DOORS
8.5.1.Company overview
8.5.2.Key executive
8.5.3.Company snapshot
8.5.4.Product portfolio
8.6.ERREKA GROUP
8.6.1.Company overview
8.6.2.Key executive
8.6.3.Company snapshot
8.6.4.Product portfolio
8.7.GRUPSA DOOR SYSTEM
8.7.1.Company overview
8.7.2.Key executive
8.7.3.Company snapshot
8.7.4.Product portfolio
8.8.GEZE GmbH
8.8.1.Company overview
8.8.2.Key executive
8.8.3.Company snapshot
8.8.4.Product portfolio
8.9.LANDERT GROUP AG
8.9.1.Company overview
8.9.2.Key executive
8.9.3.Company snapshot
8.9.4.Product portfolio
8.9.5.Key strategic moves and developments
8.10.MANUSA GEST, S.L.
8.10.1.Company overview
8.10.2.Company snapshot
8.10.3.Product portfolio
8.11.NABTESCO CORPORATION
8.11.1.Company overview
8.11.2.Key executive
8.11.3.Company snapshot
8.11.4.Operating business segments
8.11.5.Product portfolio
8.11.6.R&D expenses
8.11.7.Business performance
8.11.8.Key strategic moves and developments
8.12.PORTALP
8.12.1.Company overview
8.12.2.Key executive
8.12.3.Company snapshot
8.12.4.Product portfolio
8.13.ROYAL BOON EDAM INTERNATIONAL B.V.
8.13.1.Company overview
8.13.2.Key executive
8.13.3.Company snapshot
8.13.4.Product portfolio
8.13.5.Key strategic moves and developments
8.14.STANLEY BLACK & DECKER, INC. (STANLEY ACCESS TECHNOLOGIES LLC)
8.14.1.Company overview
8.14.2.Key executive
8.14.3.Company snapshot
8.14.4.Operating business segments
8.14.5.Product portfolio
8.14.6.R&D expenses
8.14.7.Business performance
8.14.8.Key strategic moves and developments
8.15.SANWA HOLDINGS CORPORATION
8.15.1.Company overview
8.15.2.Key executive
8.15.3.Company snapshot
8.15.4.Operating business segments
8.15.5.Product portfolio
8.15.6.R&D expenses
8.15.7.Business performance
8.15.8.Key strategic moves and developments
LIST OF TABLES
TABLE 01.REVOLVING DOORS MARKET REVENUE, BY OPERATION, 2021-2031 ($MILLION)
TABLE 02.REVOLVING DOORS MARKET REVENUE FOR MANUAL, BY REGION, 2021-2031 ($MILLION)
TABLE 03.REVOLVING DOORS MARKET REVENUE FOR AUTOMATIC, BY REGION, 2021-2031 ($MILLION)
TABLE 04.GLOBAL AUTOMATIC REVOLVING DOORS MARKET, BY PRODUCT TYPE, 2021-2031 ($MILLION)
TABLE 05.GLOBAL THREE WINGS AUTOMATIC REVOLVING DOORS MARKET, BY END USER, 2021-2031 ($MILLION)
TABLE 06.REVOLVING DOORS MARKET REVENUE, BY PRODUCT TYPE, 2021-2031 ($MILLION)
TABLE 07.REVOLVING DOORS MARKET REVENUE FOR THREE WINGS, BY REGION, 2021-2031 ($MILLION)
TABLE 08.REVOLVING DOORS MARKET REVENUE FOR FOUR WINGS, BY REGION, 2021-2031 ($MILLION)
TABLE 09.REVOLVING DOORS MARKET REVENUE FOR OTHERS, BY REGION, 2021-2031 ($MILLION)
TABLE 10.REVOLVING DOORS MARKET REVENUE, BY END USER, 2021-2031 ($MILLION)
TABLE 11.REVOLVING DOORS MARKET REVENUE FOR COMMERCIAL, BY REGION, 2021-2031 ($MILLION)
TABLE 12.REVOLVING DOORS MARKET REVENUE FOR INDUSTRIAL, BY REGION, 2021-2031 ($MILLION)
TABLE 13.REVOLVING DOORS MARKET, BY REGION, 2021-2031($MILLION)
TABLE 14.NORTH AMERICA REVOLVING DOORS MARKET, BY OPERATION, 2021-2031($MILLION)
TABLE 15.NORTH AMERICA REVOLVING DOORS MARKET REVENUE, BY PRODUCT TYPE, 2021-2031($MILLION)
TABLE 16.NORTH AMERICA REVOLVING DOORS MARKET REVENUE, BY END USER, 2021-2031($MILLION)
TABLE 17.NORTH AMERICA REVOLVING DOORS MARKET, BY COUNTRY, 2021-2031($MILLION)
TABLE 18.U.S. REVOLVING DOORS MARKET, BY OPERATION, 2021-2031($MILLION)
TABLE 19.U.S. REVOLVING DOORS MARKET, BY PRODUCT TYPE, 2021-2031($MILLION)
TABLE 20.U.S. REVOLVING DOORS MARKET, BY END USER, 2021-2031($MILLION)
TABLE 21.CANADA REVOLVING DOORS MARKET, BY OPERATION, 2021-2031($MILLION)
TABLE 22.CANADA REVOLVING DOORS MARKET, BY PRODUCT TYPE, 2021-2031($MILLION)
TABLE 23.CANADA REVOLVING DOORS MARKET, BY END USER, 2021-2031($MILLION)
TABLE 24.MEXICO REVOLVING DOORS MARKET, BY OPERATION, 2021-2031($MILLION)
TABLE 25.MEXICO REVOLVING DOORS MARKET, BY PRODUCT TYPE, 2021-2031($MILLION)
TABLE 26.MEXICO REVOLVING DOORS MARKET, BY END USER, 2021-2031($MILLION)
TABLE 27.EUROPE REVOLVING DOORS MARKET, BY OPERATION, 2021-2031($MILLION)
TABLE 28.EUROPE REVOLVING DOORS MARKET REVENUE, BY PRODUCT TYPE, 2021-2031($MILLION)
TABLE 29.EUROPE REVOLVING DOORS MARKET REVENUE, BY END USER, 2021-2031($MILLION)
TABLE 30.EUROPE REVOLVING DOORS MARKET, BY COUNTRY, 2021-2031($MILLION)
TABLE 31.GERMANY REVOLVING DOORS MARKET, BY OPERATION, 2021-2031($MILLION)
TABLE 32.GERMANY REVOLVING DOORS MARKET, BY PRODUCT TYPE, 2021-2031($MILLION)
TABLE 33.GERMANY REVOLVING DOORS MARKET, BY END USER, 2021-2031($MILLION)
TABLE 34.ITALY REVOLVING DOORS MARKET, BY OPERATION, 2021-2031($MILLION)
TABLE 35.ITALY REVOLVING DOORS MARKET, BY PRODUCT TYPE, 2021-2031($MILLION)
TABLE 36.ITALY REVOLVING DOORS MARKET, BY END USER, 2021-2031($MILLION)
TABLE 37.UK REVOLVING DOORS MARKET, BY OPERATION, 2021-2031($MILLION)
TABLE 38.UK REVOLVING DOORS MARKET, BY PRODUCT TYPE, 2021-2031($MILLION)
TABLE 39.UK REVOLVING DOORS MARKET, BY END USER, 2021-2031($MILLION)
TABLE 40.FRANCE REVOLVING DOORS MARKET, BY OPERATION, 2021-2031($MILLION)
TABLE 41.FRANCE REVOLVING DOORS MARKET, BY PRODUCT TYPE, 2021-2031($MILLION)
TABLE 42.FRANCE REVOLVING DOORS MARKET, BY END USER, 2021-2031($MILLION)
TABLE 43.REST OF EUROPE REVOLVING DOORS MARKET, BY OPERATION, 2021-2031($MILLION)
TABLE 44.REST OF EUROPE REVOLVING DOORS MARKET, BY PRODUCT TYPE, 2021-2031($MILLION)
TABLE 45.REST OF EUROPE REVOLVING DOORS MARKET, BY END USER, 2021-2031($MILLION)
TABLE 46.ASIA-PACIFIC REVOLVING DOORS MARKET, BY OPERATION, 2021-2031($MILLION)
TABLE 47.ASIA-PACIFIC REVOLVING DOORS MARKET REVENUE, BY PRODUCT TYPE, 2021-2031($MILLION)
TABLE 48.ASIA-PACIFIC REVOLVING DOORS MARKET REVENUE, BY END USER, 2021-2031($MILLION)
TABLE 49.ASIA-PACIFIC REVOLVING DOORS MARKET, BY COUNTRY, 2021-2031($MILLION)
TABLE 50.CHINA REVOLVING DOORS MARKET, BY OPERATION, 2021-2031($MILLION)
TABLE 51.CHINA REVOLVING DOORS MARKET, BY PRODUCT TYPE, 2021-2031($MILLION)
TABLE 52.CHINA REVOLVING DOORS MARKET, BY END USER, 2021-2031($MILLION)
TABLE 53.JAPAN REVOLVING DOORS MARKET, BY OPERATION, 2021-2031($MILLION)
TABLE 54.JAPAN REVOLVING DOORS MARKET, BY PRODUCT TYPE, 2021-2031($MILLION)
TABLE 55.JAPAN REVOLVING DOORS MARKET, BY END USER, 2021-2031($MILLION)
TABLE 56.INDIA REVOLVING DOORS MARKET, BY OPERATION, 2021-2031($MILLION)
TABLE 57.INDIA REVOLVING DOORS MARKET, BY PRODUCT TYPE, 2021-2031($MILLION)
TABLE 58.INDIA REVOLVING DOORS MARKET, BY END USER, 2021-2031($MILLION)
TABLE 59.SOUTH KOREA REVOLVING DOORS MARKET, BY OPERATION, 2021-2031($MILLION)
TABLE 60.SOUTH KOREA REVOLVING DOORS MARKET, BY PRODUCT TYPE, 2021-2031($MILLION)
TABLE 61.SOUTH KOREA REVOLVING DOORS MARKET, BY END USER, 2021-2031($MILLION)
TABLE 62.REST OF ASIA-PACIFIC REVOLVING DOORS MARKET, BY OPERATION, 2021-2031($MILLION)
TABLE 63.REST OF ASIA-PACIFIC REVOLVING DOORS MARKET, BY PRODUCT TYPE, 2021-2031($MILLION)
TABLE 64.REST OF ASIA-PACIFIC REVOLVING DOORS MARKET, BY END USER, 2021-2031($MILLION)
TABLE 65.LAMEA REVOLVING DOORS MARKET, BY OPERATION, 2021-2031($MILLION)
TABLE 66.LAMEA REVOLVING DOORS MARKET REVENUE, BY PRODUCT TYPE, 2021-2031($MILLION)
TABLE 67.LAMEA REVOLVING DOORS MARKET REVENUE, BY END USER, 2021-2031($MILLION)
TABLE 68.LAMEA REVOLVING DOORS MARKET, BY COUNTRY, 2021-2031($MILLION)
TABLE 69.LATIN AMERICA REVOLVING DOORS MARKET, BY OPERATION, 2021-2031($MILLION)
TABLE 70.LATIN AMERICA REVOLVING DOORS MARKET, BY PRODUCT TYPE, 2021-2031($MILLION)
TABLE 71.LATIN AMERICA REVOLVING DOORS MARKET, BY END USER, 2021-2031($MILLION)
TABLE 72.MIDDLE EAST REVOLVING DOORS MARKET, BY OPERATION, 2021-2031($MILLION)
TABLE 73.MIDDLE EAST REVOLVING DOORS MARKET, BY PRODUCT TYPE, 2021-2031($MILLION)
TABLE 74.MIDDLE EAST. REVOLVING DOORS MARKET, BY END USER, 2021-2031($MILLION)
TABLE 75.AFRICA REVOLVING DOORS MARKET, BY OPERATION, 2021-2031($MILLION)
TABLE 76.AFRICA REVOLVING DOORS MARKET, BY PRODUCT TYPE, 2021-2031($MILLION)
TABLE 77.AFRICA REVOLVING DOORS MARKET, BY END USER, 2021-2031($MILLION)
TABLE 78.ASSA ABLOY:KEY EXECUTIVE
TABLE 79.ASSA ABLOY: COMPANY SNAPSHOT
TABLE 80.ASSA ABLOY: OPERATING SEGMENTS
TABLE 81.ASSA ABLOY: PRODUCT PORTFOLIO
TABLE 82.AUTO INGRESS:KEY EXECUTIVE
TABLE 83.AUTO INGRESS: COMPANY SNAPSHOT
TABLE 84.AUTO INGRESS: PRODUCT PORTFOLIO
TABLE 85.DEUTSCHTEC:KEY EXECUTIVE
TABLE 86.DEUTSCHTEC: COMPANY SNAPSHOT
TABLE 87.DEUTSCHTEC: PRODUCT PORTFOLIO
TABLE 88.DORMAKABA:KEY EXECUTIVE
TABLE 89.DORMAKABA: COMPANY SNAPSHOT
TABLE 90.DORMAKABA: OPERATING SEGMENTS
TABLE 91.DORMAKABA: PRODUCT PORTFOLIO
TABLE 92.DSS AUTOMATIC DOORS:KEY EXECUTIVE
TABLE 93.DSS AUTOMATIC DOORS: COMPANY SNAPSHOT
TABLE 94.DSS AUTOMATIC DOORS: PRODUCT PORTFOLIO
TABLE 95.ERREKA:KEY EXECUTIVE
TABLE 96.ERREKA: COMPANY SNAPSHOT
TABLE 97.ERREKA: PRODUCT PORTFOLIO
TABLE 98.GRUPSA:KEY EXECUTIVE
TABLE 99.GRUPSA: COMPANY SNAPSHOT
TABLE 100.GRUPSA: PRODUCT PORTFOLIO
TABLE 101.GEZE:KEY EXECUTIVE
TABLE 102.GEZE: COMPANY SNAPSHOT
TABLE 103.ABC: PRODUCT PORTFOLIO
TABLE 104.LANDERT:KEY EXECUTIVE
TABLE 105.LANDERT: COMPANY SNAPSHOT
TABLE 106.LANDERT: PRODUCT PORTFOLIO
TABLE 107.MANUSA: COMPANY SNAPSHOT
TABLE 108.MANUSA: PRODUCT PORTFOLIO
TABLE 109.NABTESCO:KEY EXECUTIVE
TABLE 110.NABTESCO: COMPANY SNAPSHOT
TABLE 111.NABTESCO: OPERATING SEGMENTS
TABLE 112.NABTESCO: PRODUCT PORTFOLIO
TABLE 113.PORTALP:KEY EXECUTIVE
TABLE 114.PORTALP: COMPANY SNAPSHOT
TABLE 115.PORTALP: PRODUCT PORTFOLIO
TABLE 116.BOON EDAM: KEY EXECUTIVES
TABLE 117.BOON EDAM: COMPANY SNAPSHOT
TABLE 118.BOON EDAM: PRODUCT PORTFOLIO
TABLE 119.STANLEY BLACK & DECKER:KEY EXECUTIVE
TABLE 120.STANLEY BLACK & DECKER: COMPANY SNAPSHOT
TABLE 121.STANLEY BLACK & DECKER: OPERATING SEGMENTS
TABLE 122.STANLEY BLACK & DECKER: PRODUCT PORTFOLIO
TABLE 123.SANWA:KEY EXECUTIVE
TABLE 124.SANWA: COMPANY SNAPSHOT
TABLE 125.SANWA: OPERATING SEGMENTS
TABLE 126.SANWA: PRODUCT PORTFOLIO
LIST OF FIGURES
FIGURE 01.KEY MARKET SEGMENTS
FIGURE 02.EXECUTIVE SUMMARY
FIGURE 03.TOP INVESTMENT POCKETS
FIGURE 04.TOP WINNING STRATEGIES, BY YEAR, 2020–2021
FIGURE 05.TOP WINNING STRATEGIES, BY DEVELOPMENT, 2020–2021 (%)
FIGURE 06.TOP WINNING STRATEGIES, BY COMPANY, 2020–2021 (%)
FIGURE 07.LOW TO MODERATE BARGAINING POWER OF SUPPLIERS
FIGURE 08.LOW TO MODERATE BARGAINING POWER OF BUYERS
FIGURE 09.MODEARTE TO HIGH THREAT OF SUBSTITUTES
FIGURE 10.MODERATE THREAT OF NEW ENTRANTS
FIGURE 11.MODERATE TO HIGH INTENSITY OF RIVALRY
FIGURE 12.KEY PLAYER POSITIONING
FIGURE 13.REVOLVING DOORS MARKET, BY OPERATION, 2021-2031 (%)
FIGURE 14.COMPARATIVE SHARE ANALYSIS OF REVOLVING DOORS MARKET, FOR MANUAL, BY COUNTRY, 2021-2031 (%)
FIGURE 15.COMPARATIVE SHARE ANALYSIS OF REVOLVING DOORS MARKET, FOR AUTOMATIC, BY COUNTRY, Â 2021-2031 (%)
FIGURE 16.REVOLVING DOORS MARKET, BY PRODUCT TYPE, 2021-2031 (%)
FIGURE 17.COMPARATIVE SHARE ANALYSIS OF REVOLVING DOORS MARKET, FOR THREE WINGS, BY COUNTRY, Â 2021-2031 (%)
FIGURE 18.COMPARATIVE SHARE ANALYSIS OF REVOLVING DOORS MARKET, FOR FOUR WINGS, BY COUNTRY, Â 2021-2031 (%)
FIGURE 19.COMPARATIVE SHARE ANALYSIS OF REVOLVING DOORS MARKET, FOR OTHERS, BY COUNTRY, 2021-2031 (%)
FIGURE 20.REVOLVING DOORS MARKET, BY END USER, 2021-2031 (%)
FIGURE 21.COMPARATIVE SHARE ANALYSIS OF REVOLVING DOORS MARKET REVENUE, FOR COMMERCIAL, BY COUNTRY, 2021-2031 (%)
FIGURE 22.COMPARATIVE SHARE ANALYSIS OF REVOLVING DOORS MARKET REVENUE FOR INDUSTRIAL, BY COUNTRY, 2021-2031 (%)
FIGURE 23.REVOLVING DOORS MARKET, BY REGION, 2021-2031(%)
FIGURE 24.U.S. REVOLVING DOORS MARKET REVENUE, 2021-2031($MILLION)
FIGURE 25.CANADA REVOLVING DOORS MARKET REVENUE, 2021-2031($MILLION)
FIGURE 26.MEXICO REVOLVING DOORS MARKET REVENUE, 2021-2031($MILLION)
FIGURE 27.GERMANY REVOLVING DOORS MARKET REVENUE, 2021-2031($MILLION)
FIGURE 28.ITALY REVOLVING DOORS MARKET REVENUE, 2021-2031($MILLION)
FIGURE 29.UK REVOLVING DOORS MARKET REVENUE, 2021-2031($MILLION)
FIGURE 30.FRANCE REVOLVING DOORS MARKET REVENUE, 2021-2031($MILLION)
FIGURE 31.REST OF EUROPE REVOLVING DOORS MARKET REVENUE, 2021-2031($MILLION)
FIGURE 32.CHINA REVOLVING DOORS MARKET REVENUE, 2021-2031($MILLION)
FIGURE 33.JAPAN REVOLVING DOORS MARKET REVENUE, 2021-2031($MILLION)
FIGURE 34.INDIA REVOLVING DOORS MARKET REVENUE, 2021-2031($MILLION)
FIGURE 35.SOUTH KOREA REVOLVING DOORS MARKET REVENUE, 2021-2031($MILLION)
FIGURE 36.REST OF ASIA-PACIFIC REVOLVING DOORS MARKET REVENUE, 2021-2031($MILLION)
FIGURE 37.LATIN AMERICA REVOLVING DOORS MARKET REVENUE, 2021-2031($MILLION)
FIGURE 38.MIDDLE EAST REVOLVING DOORS MARKET REVENUE, 2021-2031($MILLION)
FIGURE 39.AFRICA. REVOLVING DOORS MARKET REVENUE, 2021-2031($MILLION)
FIGURE 40.ASSA ABLOY: R&D EXPENSES, 2019–2021($MILLION)
FIGURE 41.ASSA ABLOY: REVENUE, 2019–2021($MILLION)
FIGURE 42.ASSA ABLOY: REVENUE SHARE BY SEGMENT, 2021(%)
FIGURE 43.ASSA ABLOY: REVENUE SHARE BY REGION, 2021(%)
FIGURE 44.DORMAKABA: R&D EXPENSES, 2019–2021($MILLION)
FIGURE 45.DORMAKABA: REVENUE, 2019–2021($MILLION)
FIGURE 46.DORMAKABA: REVENUE SHARE BY SEGMENT, 2020(%)
FIGURE 47.DORMAKABA: REVENUE SHARE BY REGION, 2020(%)
FIGURE 48.NABTESCO: R&D EXPENSES, 2019–2021($MILLION)
FIGURE 49.NABTESCO: REVENUE, 2019–2021($MILLION)
FIGURE 50.NABTESCO: REVENUE SHARE BY SEGMENT, 2020(%)
FIGURE 51.NABTESCO: REVENUE SHARE BY REGION, 2020(%)
FIGURE 52.STANLEY BLACK & DECKER: R&D EXPENSES, 2019–2021($MILLION)
FIGURE 53.STANLEY BLACK & DECKER: REVENUE, 2019–2021($MILLION)
FIGURE 54.STANLEY BLACK & DECKER: REVENUE SHARE BY SEGMENT, 2021(%)
FIGURE 55.STANLEY BLACK & DECKER: REVENUE SHARE BY REGION, 2021(%)
FIGURE 56.SANWA: R&D EXPENSES, 2019–2021($MILLION)
FIGURE 57.SANWA: REVENUE, 2019–2021($MILLION)
FIGURE 58.SANWA: REVENUE SHARE BY SEGMENT, 2021(%)
According to the insights of the CXOs of leading companies, the revolving doors market holds high growth potential in the commercial and industrial sector. The market has witnessed significant growth over the past decade, owing to the rise in adoption of revolving doors such as three wings, four wings and others. Market players are also acquiring other companies and enhancing their product portfolios to increase their market potential in terms of geographic and customer base expansion. Moreover, the leading players in the market are producing affordable, and efficient revolving doors to cater to a large customer base.
Factors such as increase in construction activities has significant impact over the market growth in the recent years. In addition, increase in investment in commercial construction activities are expected to drive the growth of the global revolving doors market.
Furthermore, the market growth for revolving doors is highly dependent on industrial and commercial construction investments. Thus, increase in industrialization, and rise in demand for the commercial complexes and buildings fuels the market growth.
Among the analyzed regions, Europe has registered for the highest revenue in the global market throughout the forecast period, followed by North America, Asia-Pacific and LAMEA.
A. Rapid urbanization & industrialization and surge in residential & nonresidential construction are the upcoming trends of Revolving Doors Market in the world.
A. Commercial segment is the leading end-user of Revolving Doors Market
A. Europe is the largest regional market for Revolving Doors.
A. The global revolving doors market was valued at $908.6 million in 2021.
A. Assa Abloy Group, Auto Ingress, Deutschtec GmbH, Dormakaba Holding AG, DSS Automatic Doors, are the top companies to hold the market share in Revolving Doors
A. The report contains an exclusive company profile section, where leading 10 companies in the market are profiled. These profiles typically cover company overview, geographical presence, market dominance (in terms of revenue and volume sales), various strategies and recent developments.
A. The top ten market players are selected based on two key attributes - competitive strength and market positioning.
A. The base year calculated in the global revolving door market report is 2021.
Start reading instantly.
This Report and over 67,069+ more Reports, Available with Avenue Library. T&C*.
Enterprise
License/PDF
Library
Membership
*Taxes/Fees, if applicable will be added during checkout. All prices in USD
To ensure high-level data integrity, accurate analysis, and impeccable forecasts
For complete satisfaction
On-demand customization of scope of the report to exactly meet your needs
Targeted market view to provide pertinent information and save time of readers
Get insights on topics that are crucial for your business. Stay abreast of your interest areas.
Get Industry Data AlertsTo ensure high-level data integrity, accurate analysis, and impeccable forecasts
For complete satisfaction
On-demand customization of scope of the report to exactly meet your needs
Targeted market view to provide pertinent information and save time of readers