Report Code: A05859 | Jun 2021 | Pages: 234 | ||
Tables: 119 | Charts: 77 |
|
Pandemic disrupted the entire world and affected many industries.
Get detailed COVID-19 impact analysis on the Rigid Plastic Packaging Market
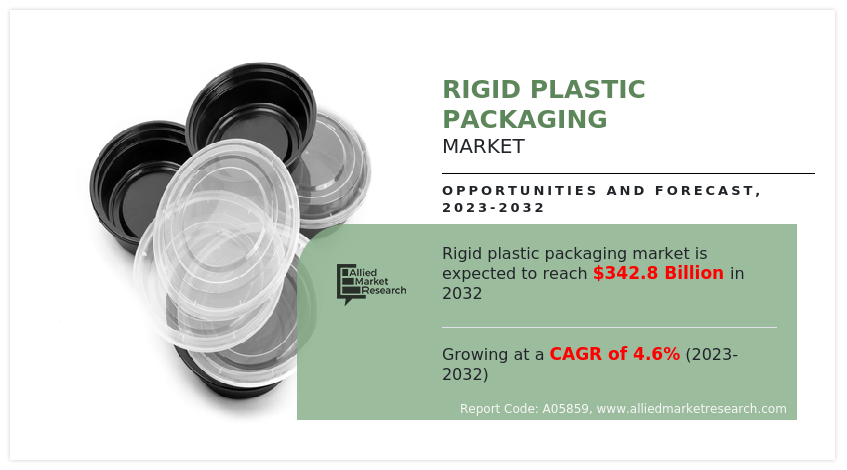
Request Now !The global rigid plastic packaging market was valued at $182,070.0 million in 2020, and is projected to reach $270,595.1 million by 2028, growing at a CAGR of 4.9% from 2021 to 2028. Rigid plastic packaging involves utilization of plastic materials such as polypropylene (PP), high-density polyethylene (HDPE), and polyethylene (PET) for packaging of new bottles and containers. These materials are durable and lightweight. Polyethylene and polypropylene packaging solutions are applicable across various industries such as food & beverages, agriculture, aerospace, automotive, and medical.
Emergence of COVID-19 has mixed effect on the rigid plastics packaging market in 2020, and the market is estimated to witness relatively slow growth till the end of 2021. The market was primarily hit by several obstacles in the packaging industry including availability of food, health and safety measures, deliverables, contractual obligations, and project delays or cancellations.
The growth of the rigid plastic packaging market is majorly driven by rapid expansion of the food & beverage industry, which, in turn, fuels the demand for bottles, jars, fruit juice containers, food package container, and foodie bags. For instance, the U.S. hotel market reached around $154.34 billion by 2021. Rise in demand for cycle wheel, containers, and electronics switches further fuels the growth of global rigid plastic packaging market. In addition, development of the automotive industry is anticipated to drive the growth of the market. For instance, according to the Trading Economics, the Mexico car production is anticipated to grow at rate of 43.2% from 2021 to 2023.
In addition, rigid plastic packaging solution is used in various industry verticals such as agriculture, medical, personal care, and pharmaceuticals, owing to rise in demand for plastic packaging systems. The healthcare industry in various countries such as the UK, the U.S., and India is growing at a significant pace, due to increase in investments in this sector by government. For instance, in 2018, the UK Government spent $252.9 billion on the healthcare industry. This is expected to rise in demand for containers, bottles, and tubes to store medicines.
The major players such as ALPLA Werke Alwin Lehner GmbH & Co KG and Amcor Plc. are engaged in offering plastic packaging solutions. For instance, in May 2021, ALPLA Werke Alwin Lehner GmbH & Co KG launched a cap made up of polypropylene (PP) for viscous liquids such as mayonnaise and ketchup. Polypropylene serves as an ideal packaging solution and is cost-effective.
Furthermore, increase in government spending on construction building activities, is anticipated to boost the growth of the rigid plastic packaging market. For instance, in December 2018, the construction industry of Spain accounted for 5.8% of country’s GDP. Furthermore, the Indian construction industry experienced growth by 5.6% from 2016 to 2020.
However, stringent government regulations toward the use of plastic and fluctuation in raw material prices are anticipated to restrain the growth of the global rigid plastic packaging market. On the contrary, rise in e-commerce sales is anticipated to provide lucrative opportunities for the growth of the market.
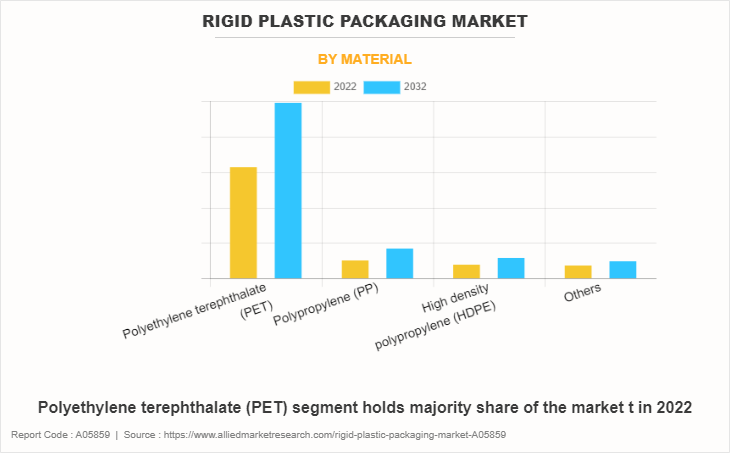
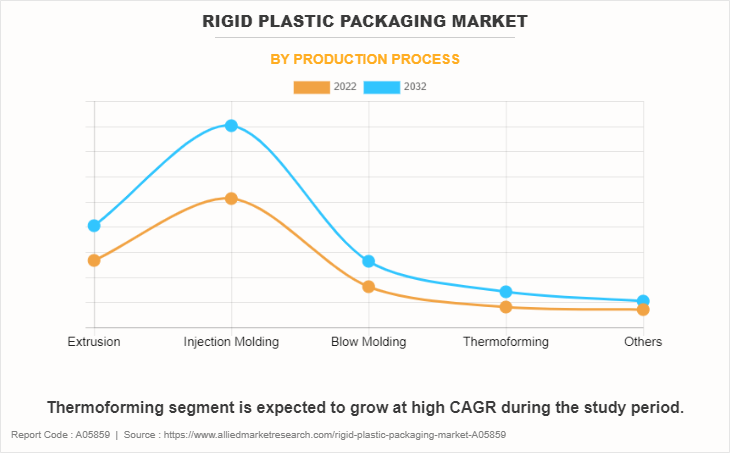
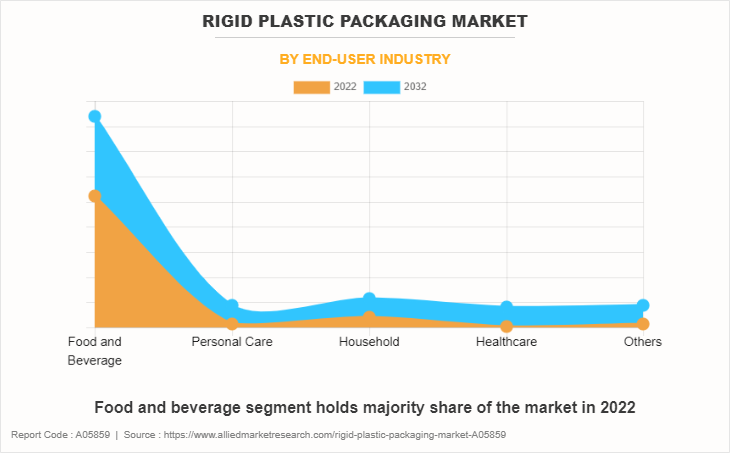
The global rigid plastic packaging market is segmented into material, production process, end-user industry, and region. Depending on material, the market is segregated into polyethylene (PET), polypropylene (PP), high-density polyethylene (HDPE), and others. The polyethylene (PET) segment dominated the market in 2020, owing to associated benefits of polyethylene such as low cost, robustness, and enhanced chemical resistance. On the basis of production process, the market is fragmented into extrusion, injection molding, blow molding, thermoforming, and others. The injection molding segment led the global rigid plastic packaging market in 2020, as injection molding exhibits features such as high efficiency, enhanced strength, and low labor costs. . By end-user industry, the market is categorized into food & beverages, personal care, household, healthcare, and others. The food & beverage segment registered the highest growth in the market in 2020, owing to rise in demand for jars, bottles, and containers from the food & beverage industry
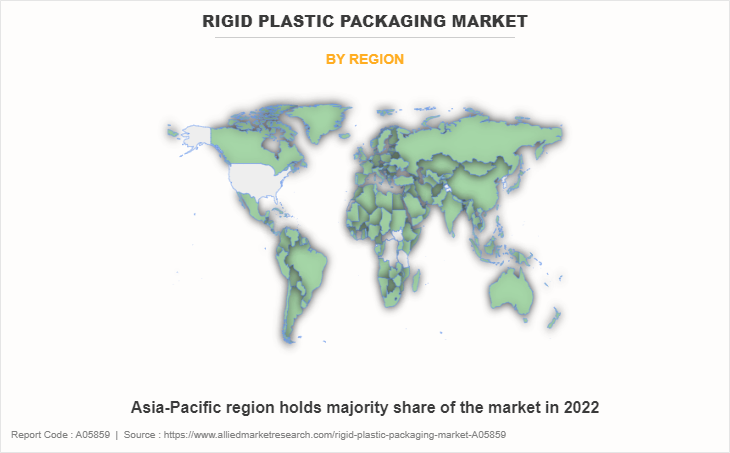
Region wise, the market is analyzed across North America (U.S., Canada, and Mexico), Europe (Germany, France, UK, Russia, and rest of Europe), Asia-Pacific (China, Japan, India, Australia, and rest of Asia-Pacific), and LAMEA (Latin America, the Middle East, and Africa). Asia-Pacific is expected to govern the market during the forecast period, owing to rise in industrialization and rapid urbanization.
The key market players profiled in the report include ALPLA-Werke Alwin Lehner GmbH & Co KG, Amcor Limited, DS Smith Plc, Berry Plastics Corporation, Klöckner Pentaplast, Plastipak Holdings, Inc., Pactiv Evergreen Inc, Sealed Air Corporation, Silgan Holdings, Inc., and Sonoco Products Company.
The key players in this market adopted product launch, partnership, and expansion as their key strategies to meet the changing consumer demands. For instance, in May 2019, Klöckner Pentaplast partnered with German Plastic Packaging Industry Association (IK) to start a pilot project for the recycling of PET food plastic trays. The pilot project is aimed toward creating a closed-loop recycling process, especially for recycling of rigid plastic trays used for food packaging and utilizing the recycled plastic for new product manufacturing.
Key Benefits For Stakeholders
Global Rigid Plastic Packaging Market Segments
By Material
By Production Process
By End-user Industry
By Region
KEY PLAYERS
Rigid Plastic Packaging Market Report Highlights
Aspects | Details |
---|---|
By Material |
|
By Production Process |
|
By End-user Industry |
|
By Region |
|
Key Market Players | Silgan Holdings, Inc., ALPLA-Werke Alwin Lehner GmbH & Co KG, DS Smith Plc, BERRY GLOBAL GROUP INC., Sonoco Products Company., Amcor Plc, Pactiv Evergreen Inc, KLÖCKNER PENTAPLAST GROUP (KP HOLDING GmbH & CO. KG), Plastipak Holdings, Inc., Sealed Air Corporation |
CHAPTER 1:INTRODUCTION
1.1.Report description
1.2.Key benefits for stakeholders
1.3.Key market segments
1.4.Research methodology
1.4.1.Primary research
1.4.2.Secondary research
1.4.3.Analyst tools and models
CHAPTER 2:EXECUTIVE SUMMARY
2.1.Key findings
2.2.CXO perspective
CHAPTER 3:MARKET OVERVIEW
3.1.Market definition and scope
3.2.Key findings
3.2.1.Top Investment Pockets
3.2.2.Top Winning Strategies
3.3.Porter's five forces analysis
3.4.Key player positioning, 2020
3.5.Market dynamics
3.5.1.Drivers
3.5.1.1.The rise in the global consumption of consumer goods
3.5.1.2.Improved recycling rates for packaging
3.5.1.3.Low cost of rigid plastics
3.5.2.Restraints
3.5.2.1.Rise in the end user shift toward flexible packaging
3.5.2.2.Stringent regulations
3.5.2.3.Fluctuation in raw material prices
3.5.3.Opportunity
3.5.3.1.Rise in e-commerce sales globally
3.6.COVID-19 Impact analysis
CHAPTER 4:RIGID PLASTIC PACKAGING MARKET, BY MATERIAL
4.1.Overview
4.1.1.Market size and forecast, by material
4.2.Polyethylene terephthalate (PET)
4.2.1.Key market trends, growth factors, and opportunities
4.2.2.Market size and forecast, by region
4.2.3.Market analysis, by country
4.3.Polypropylene (PP)
4.3.1.Key market trends, growth factors, and opportunities
4.3.2.Market size and forecast, by region
4.3.3.Market analysis, by country
4.4.High-density polyethylene (HDPE)
4.4.1.Key market trends, growth factors, and opportunities
4.4.2.Market size and forecast, by region
4.4.3.Market analysis, by country
4.5.Others
4.5.1.Key market trends, growth factors, and opportunities
4.5.2.Market size and forecast, by region
4.5.3.Market analysis, by country
CHAPTER 5:GLOBAL RIGID PLASTIC PACKAGING MARKET, BY PRODUCTION PROCESS
5.1.Overview
5.1.1.Market size and forecast, by production process
5.2.Extrusion
5.2.1.Key market trends, growth factors, and opportunities
5.2.2.Market size and forecast, by region
5.2.3.Market analysis, by country
5.3.Injection molding
5.3.1.Key market trends, growth factors, and opportunities
5.3.2.Market size and forecast, by region
5.3.3.Market analysis, by country
5.4.Blow molding
5.4.1.Key market trends, growth factors, and opportunities
5.4.2.Market size and forecast, by region
5.4.3.Market analysis, by country
5.5.Thermoforming
5.5.1.Key market trends, growth factors, and opportunities
5.5.2.Market size and forecast, by region
5.5.3.Market analysis, by country
5.6.Others
5.6.1.Key market trends, growth factors, and opportunities
5.6.2.Market size and forecast, by region
5.6.3.Market analysis, by country
CHAPTER 6:RIGID PLASTICS PACKAGING MARKET, BY END USER INDUSTRY
6.1.Overview
6.1.1.Market size and forecast, by end user industry
6.2.Food & beverage
6.2.1.Key market trends, growth factors, and opportunities
6.2.2.Market size and forecast, by region
6.2.3.Market analysis, by country
6.3.Personal care
6.3.1.Key market trends, growth factors, and opportunities
6.3.2.Market size and forecast, by region
6.3.3.Market analysis, by country
6.4.Household
6.4.1.Key market trends, growth factors, and opportunities
6.4.2.Market size and forecast, by region
6.4.3.Market analysis, by country
6.5.Healthcare
6.5.1.Key market trends, growth factors, and opportunities
6.5.2.Market size and forecast, by region
6.5.3.Market analysis, by country
6.6.Others
6.6.1.Key market trends, growth factors, and opportunities
6.6.2.Market size and forecast, by region
6.6.3.Market analysis, by country
CHAPTER 7:RIGID PLASTIC PACKAGING MARKET, BY REGION
7.1.Overview
7.1.1.Market size and forecast, by region
7.2.North America
7.2.1.Key market trends, growth factors, and opportunities
7.2.2.Market size and forecast, by material
7.2.3.Market size and forecast, by production process
7.2.4.Market size and forecast, by end user industry
7.2.5.Market analysis, by country
7.2.5.1.U.S.
7.2.5.1.1.Market size and forecast, by material
7.2.5.1.2.Market size and forecast, by production process
7.2.5.1.3.Market size and forecast, by end user industry
7.2.5.2.Canada
7.2.5.2.1.Market size and forecast, by material
7.2.5.2.2.Market size and forecast, by production process
7.2.5.2.3.Market size and forecast, by end user industry
7.2.5.3.Mexico
7.2.5.3.1.Market size and forecast, by material
7.2.5.3.2.Market size and forecast, by production process
7.2.5.3.3.Market size and forecast, by end user industry
7.3.Europe
7.3.1.Key market trends, growth factors, and opportunities
7.3.2.Market size and forecast, by material
7.3.3.Market size and forecast, by production process
7.3.4.Market size and forecast, by end user industry
7.3.5.Market analysis, by country
7.3.5.1.Germany
7.3.5.1.1.Market size and forecast, by material
7.3.5.1.2.Market size and forecast, by production process
7.3.5.1.3.Market size and forecast, by end user industry
7.3.5.2.France
7.3.5.2.1.Market size and forecast, by material
7.3.5.2.2.Market size and forecast, by production process
7.3.5.2.3.Market size and forecast, by end user industry
7.3.5.3.UK
7.3.5.3.1.Market size and forecast, by material
7.3.5.3.2.Market size and forecast, by production process
7.3.5.3.3.Market size and forecast, by end user industry
7.3.5.4.Russia
7.3.5.4.1.Market size and forecast, by material
7.3.5.4.2.Market size and forecast, by production process
7.3.5.4.3.Market size and forecast, by end user industry
7.3.5.5.Rest of Europe
7.3.5.5.1.Market size and forecast, by material
7.3.5.5.2.Market size and forecast, by production process
7.3.5.5.3.Market size and forecast, by end user industry
7.4.Asia-Pacific
7.4.1.Key market trends, growth factors, and opportunities
7.4.2.Market size and forecast, by material
7.4.3.Market size and forecast, by production process
7.4.4.Market size and forecast, by end user industry
7.4.5.Market analysis, by country
7.4.5.1.Japan
7.4.5.1.1.Market size and forecast, by material
7.4.5.1.2.Market size and forecast, by production process
7.4.5.1.3.Market size and forecast, by end user industry
7.4.5.2.China
7.4.5.2.1.Market size and forecast, by material
7.4.5.2.2.Market size and forecast, by production process
7.4.5.2.3.Market size and forecast, by end user industry
7.4.5.3.India
7.4.5.3.1.Market size and forecast, by material
7.4.5.3.2.Market size and forecast, by production process
7.4.5.3.3.Market size and forecast, by end user industry
7.4.5.4.Australia
7.4.5.4.1.Market size and forecast, by material
7.4.5.4.2.Market size and forecast, by production process
7.4.5.4.3.Market size and forecast, by end user industry
7.4.5.5.Rest of Asia-Pacific
7.4.5.5.1.Market size and forecast, by material
7.4.5.5.2.Market size and forecast, by production process
7.4.5.5.3.Market size and forecast, by end user industry
7.5.LAMEA
7.5.1.Key market trends, growth factors, and opportunities
7.5.2.Market size and forecast, by material
7.5.3.Market size and forecast, by production process
7.5.4.Market size and forecast, by end user industry
7.5.5.Market analysis, by country
7.5.5.1.Latin America
7.5.5.1.1.Market size and forecast, by material
7.5.5.1.2.Market size and forecast, by production process
7.5.5.1.3.Market size and forecast, by end user industry
7.5.5.2.Middle East
7.5.5.2.1.Market size and forecast, by material
7.5.5.2.2.Market size and forecast, by production process
7.5.5.2.3.Market size and forecast, by end user industry
7.5.5.3.Africa
7.5.5.3.1.Market size and forecast, by material
7.5.5.3.2.Market size and forecast, by production process
7.5.5.3.3.Market size and forecast, by end user industry
CHAPTER 8:COMPANY PROFILES
8.1.ALPLA WERKE ALWIN LEHNER GmbH & CO KG
8.1.1.Company overview
8.1.2.Key Executives
8.1.3.Company snapshot
8.1.4.Product portfolio
8.1.5.Key strategic moves and developments
8.2.AMCOR PLC
8.2.1.Company overview
8.2.2.Key Executives
8.2.3.Company snapshot
8.2.4.Operating business segments
8.2.5.Product portfolio
8.2.6.R&D Expenditure
8.2.7.Business performance
8.2.8.Key strategic moves and developments
8.3.BERRY GLOBAL GROUP INC.
8.3.1.Company overview
8.3.2.Key Executives
8.3.3.Company snapshot
8.3.4.Operating business segments
8.3.5.Product portfolio
8.3.6.R&D Expenditure
8.3.7.Business performance
8.3.8.Key strategic moves and developments
8.4.DS SMITH PLC
8.4.1.Company overview
8.4.2.Key Executives
8.4.3.Company snapshot
8.4.4.Operating business segments
8.4.5.Product portfolio
8.4.6.R&D Expenditure
8.4.7.Business performance
8.4.8.Key strategic moves and developments
8.5.KLÖCKNER PENTAPLAST GROUP (KP HOLDING GmbH & CO. KG)
8.5.1.Company overview
8.5.2.Key Executives
8.5.3.Company snapshot
8.5.4.Product portfolio
8.5.5.R&D Expenditure
8.5.6.Business performance
8.5.7.Key strategic moves and developments
8.6.PLASTIPAK HOLDINGS, INC.
8.6.1.Company overview
8.6.2.Key Executives
8.6.3.Company snapshot
8.6.4.Product portfolio
8.7.Pactiv Evergreen Inc.
8.7.1.Company overview
8.7.2.Key Executives
8.7.3.Company snapshot
8.7.4.Operating business segments
8.7.5.Product portfolio
8.7.6.R&D Expenditure
8.7.7.Business performance
8.8.Sealed Air Corporation
8.8.1.Company overview
8.8.2.Key Executives
8.8.3.Company snapshot
8.8.4.Operating business segments
8.8.5.Product portfolio
8.8.6.R&D Expenditure
8.8.7.Business performance
8.9.SILGAN HOLDINGS INC.
8.9.1.Company overview
8.9.2.Key Executives
8.9.3.Company snapshot
8.9.4.Operating business segments
8.9.5.Product portfolio
8.9.6.Business performance
8.9.7.Key strategic moves and developments
8.10.SONOCO PRODUCTS COMPANY
8.10.1.Company overview
8.10.2.Key Executives
8.10.3.Company snapshot
8.10.4.Operating business segments
8.10.5.Product portfolio
8.10.6.R&D Expenditure
8.10.7.Business performance
LIST OF TABLES
TABLE 01.GLOBAL RIGID PLASTIC PACKAGING MARKET REVENUE, BY MATERIAL, 2020-2028 ($MILLION)
TABLE 02.RIGID PLASTICS PACKAGING MARKET REVENUE FOR POLYETHYLENE TEREPHTHALATE (PET), BY REGION, 2020–2028 ($MILLION)
TABLE 03.RIGID PLASTICS PACKAGING MARKET REVENUE FOR POLYPROPYLENE (PP), BY REGION 2018–2026 ($MILLION)
TABLE 04.RIGID PLASTICS PACKAGING MARKET REVENUE FOR HIGH-DENSITY POLYETHYLENE (HDPE), BY REGION, 2020–2028 ($MILLION)
TABLE 05.RIGID PLASTICS PACKAGING MARKET REVENUE FOR OTHERS, BY REGION 2020–2028 ($MILLION)
TABLE 06.GLOBAL RIGID PLASTIC PACKAGING MARKET REVENUE, BY PRODUCTION PROCESS, 2020-2028 ($MILLION)
TABLE 07.RIGID PLASTIC PACKAGING MARKET REVENUE FOR EXTRUSION, BY REGION 2020–2028 ($MILLION)
TABLE 08.RIGID PLASTIC PACKAGING MARKET REVENUE FOR INJECTION MOLDING BY REGION 2020–2028 ($MILLION)
TABLE 09.RIGID PLASTIC PACKAGING MARKET REVENUE FOR BLOW MOLDING, BY REGION, 2020–2028 ($MILLION)
TABLE 10.RIGID PLASTIC PACKAGING MARKET REVENUE FOR THERMOFORMING, BY REGION 2020–2028 ($MILLION)
TABLE 11.RIGID PLASTIC PACKAGING MARKET REVENUE FOR OTHERS, BY REGION 2020–2028 ($MILLION)
TABLE 12.GLOBAL RIGID PLASTICS PACKAGING MARKET REVENUE, BY END USER INDUSTRY, 2020–2028 ($MILLION)
TABLE 13.RIGID PLASTICS PACKAGING MARKET REVENUE FOR FOOD & BEVERAGE, BY REGION, 2020–2028 ($MILLION)
TABLE 14.RIGID PLASTICS PACKAGING MARKET REVENUE FOR PERSONAL CARE, BY REGION, 2020–2028 ($MILLION)
TABLE 15.RIGID PLASTICS PACKAGING MARKET REVENUE FOR HOUSEHOLD, BY REGION, 2020–2028 ($MILLION)
TABLE 16.RIGID PLASTICS PACKAGING MARKET REVENUE FOR HEALTHCARE, BY REGION, 2020–2028 ($MILLION)
TABLE 17.RIGID PLASTICS PACKAGING MARKET REVENUE FOR OTHERS, BY REGION 2020–2028 ($MILLION)
TABLE 18.GLOBAL RIGID PLASTICS PACKAGING MARKET REVENUE, BY REGION 2020–2028 ($MILLION)
TABLE 19.NORTH AMERICA RIGID PLASTICS PACKAGING MARKET REVENUE, BY MATERIAL 2020–2028 ($MILLION)
TABLE 20.NORTH AMERICA RIGID PLASTICS PACKAGING MARKET REVENUE, BY PRODUCTION PROCESS, 2020–2028 ($MILLION)
TABLE 21.NORTH AMERICA RIGID PLASTICS PACKAGING MARKET REVENUE, BY END USER INDUSTRY, 2020–2028 ($MILLION)
TABLE 22.NORTH AMERICA RIGID PLASTICS PACKAGING MARKET REVENUE, BY COUNTRY, 2020–2028 ($MILLION)
TABLE 23.U.S. RIGID PLASTICS PACKAGING MARKET REVENUE, BY MATERIAL, 2020–2028 ($MILLION)
TABLE 24.U.S. RIGID PLASTICS PACKAGING MARKET REVENUE, BY PRODUCTION PROCESS, 2020–2028 ($MILLION)
TABLE 25.U.S. RIGID PLASTICS PACKAGING MARKET REVENUE, BY END USER INDUSTRY, 2020–2028 ($MILLION)
TABLE 26.CANADA RIGID PLASTICS PACKAGING MARKET REVENUE, BY MATERIAL, 2020–2028 ($MILLION)
TABLE 27.CANADA RIGID PLASTICS PACKAGING MARKET REVENUE, BY PRODUCTION PROCESS, 2020–2028 ($MILLION)
TABLE 28.CANADA RIGID PLASTICS PACKAGING MARKET REVENUE, BY END USER INDUSTRY, 2020–2028 ($MILLION)
TABLE 29.MEXICO RIGID PLASTICS PACKAGING MARKET REVENUE, BY MATERIAL, 2020–2028 ($MILLION)
TABLE 30.MEXICO RIGID PLASTICS PACKAGING MARKET REVENUE, BY PRODUCTION PROCESS, 2020–2028 ($MILLION)
TABLE 31.MEXICO RIGID PLASTICS PACKAGING MARKET REVENUE, BY END USER INDUSTRY, 2020–2028 ($MILLION)
TABLE 32.EUROPE RIGID PLASTICS PACKAGING MARKET REVENUE, BY MATERIAL 2020–2028 ($MILLION)
TABLE 33.EUROPE RIGID PLASTICS PACKAGING MARKET REVENUE, BY PRODUCTION PROCESS, 2020–2028 ($MILLION)
TABLE 34.EUROPE RIGID PLASTICS PACKAGING MARKET REVENUE, BY END USER INDUSTRY, 2020–2028 ($MILLION)
TABLE 35.EUROPE RIGID PLASTICS PACKAGING MARKET REVENUE, BY COUNTRY, 2020–2028 ($MILLION)
TABLE 36.GERMANY RIGID PLASTICS PACKAGING MARKET REVENUE, BY MATERIAL, 2020–2028 ($MILLION)
TABLE 37.GERMANY RIGID PLASTICS PACKAGING MARKET REVENUE, BY PRODUCTION PROCESS, 2020–2028 ($MILLION)
TABLE 38.GERMANY RIGID PLASTICS PACKAGING MARKET REVENUE, BY END USER INDUSTRY, 2020–2028 ($MILLION)
TABLE 39.FRANCE RIGID PLASTICS PACKAGING MARKET REVENUE, BY MATERIAL, 2020–2028 ($MILLION)
TABLE 40.FRANCE RIGID PLASTICS PACKAGING MARKET REVENUE, BY PRODUCTION PROCESS, 2020–2028 ($MILLION)
TABLE 41.FRANCE RIGID PLASTICS PACKAGING MARKET REVENUE, BY END USER INDUSTRY, 2020–2028 ($MILLION)
TABLE 42.UK RIGID PLASTICS PACKAGING MARKET REVENUE, BY MATERIAL, 2020–2028 ($MILLION)
TABLE 43.UK RIGID PLASTICS PACKAGING MARKET REVENUE, BY PRODUCTION PROCESS, 2020–2028 ($MILLION)
TABLE 44.UK RIGID PLASTICS PACKAGING MARKET REVENUE, BY END USER INDUSTRY, 2020–2028 ($MILLION)
TABLE 45.RUSSIA RIGID PLASTICS PACKAGING MARKET REVENUE, BY MATERIAL, 2020–2028 ($MILLION)
TABLE 46.RUSSIA RIGID PLASTICS PACKAGING MARKET REVENUE, BY PRODUCTION PROCESS, 2020–2028 ($MILLION)
TABLE 47.RUSSIA RIGID PLASTICS PACKAGING MARKET REVENUE, BY END USER INDUSTRY, 2020–2028 ($MILLION)
TABLE 48.REST OF EUROPE RIGID PLASTICS PACKAGING MARKET REVENUE, BY MATERIAL, 2020–2028 ($MILLION)
TABLE 49.REST OF EUROPE RIGID PLASTICS PACKAGING MARKET REVENUE, BY PRODUCTION PROCESS, 2020–2028 ($MILLION)
TABLE 50.REST OF EUROPE RIGID PLASTICS PACKAGING MARKET REVENUE, BY END USER INDUSTRY, 2020–2028 ($MILLION)
TABLE 51.ASIA-PACIFIC RIGID PLASTICS PACKAGING MARKET REVENUE, BY MATERIAL, 2020–2028 ($MILLION)
TABLE 52.ASIA-PACIFIC RIGID PLASTICS PACKAGING MARKET REVENUE, BY PRODUCTION PROCESS, 2020–2028 ($MILLION)
TABLE 53.ASIA-PACIFIC RIGID PLASTICS PACKAGING MARKET REVENUE, BY END USER INDUSTRY, 2020–2028 ($MILLION)
TABLE 54.ASIA-PACIFIC RIGID PLASTICS PACKAGING MARKET REVENUE, BY COUNTRY, 2020–2028 ($MILLION)
TABLE 55.JAPAN RIGID PLASTICS PACKAGING MARKET REVENUE, BY MATERIAL, 2020–2028 ($MILLION)
TABLE 56.JAPAN RIGID PLASTICS PACKAGING MARKET REVENUE, BY PRODUCTION PROCESS, 2020–2028 ($MILLION)
TABLE 57.JAPAN RIGID PLASTICS PACKAGING MARKET REVENUE, BY END USER INDUSTRY, 2020–2028 ($MILLION)
TABLE 58.CHINA RIGID PLASTICS PACKAGING MARKET REVENUE, BY MATERIAL, 2020–2028 ($MILLION)
TABLE 59.CHINA RIGID PLASTICS PACKAGING MARKET REVENUE, BY PRODUCTION PROCESS, 2020–2028 ($MILLION)
TABLE 60.CHINA RIGID PLASTICS PACKAGING MARKET REVENUE, BY END USER INDUSTRY, 2020–2028 ($MILLION)
TABLE 61.INDIA RIGID PLASTICS PACKAGING MARKET REVENUE, BY MATERIAL, 2020–2028 ($MILLION)
TABLE 62.INDIA RIGID PLASTICS PACKAGING MARKET REVENUE, BY PRODUCTION PROCESS, 2020–2028 ($MILLION)
TABLE 63.INDIA RIGID PLASTICS PACKAGING MARKET REVENUE, BY END USER INDUSTRY, 2020–2028 ($MILLION)
TABLE 64.AUSTRALIA RIGID PLASTICS PACKAGING MARKET REVENUE, BY MATERIAL, 2020–2028 ($MILLION)
TABLE 65.AUSTRALIA RIGID PLASTICS PACKAGING MARKET REVENUE, BY PRODUCTION PROCESS, 2020–2028 ($MILLION)
TABLE 66.AUSTRALIA RIGID PLASTICS PACKAGING MARKET REVENUE, BY END USER INDUSTRY, 2020–2028 ($MILLION)
TABLE 67.REST OF ASIA-PACIFIC RIGID PLASTICS PACKAGING MARKET REVENUE, BY MATERIAL, 2020–2028 ($MILLION)
TABLE 68.REST OF ASIA-PACIFIC RIGID PLASTICS PACKAGING MARKET REVENUE, BY PRODUCTION PROCESS, 2020–2028 ($MILLION)
TABLE 69.REST OF ASIA-PACIFIC RIGID PLASTICS PACKAGING MARKET REVENUE, BY END USER INDUSTRY, 2020–2028 ($MILLION)
TABLE 70.LAMEA RIGID PLASTICS PACKAGING MARKET REVENUE, BY MATERIAL, 2020–2028 ($MILLION)
TABLE 71.LAMEA RIGID PLASTICS PACKAGING MARKET REVENUE, BY PRODUCTION PROCESS, 2020–2028 ($MILLION)
TABLE 72.LAMEA RIGID PLASTICS PACKAGING MARKET REVENUE, BY END USER INDUSTRY, 2020–2028 ($MILLION)
TABLE 73.LAMEA RIGID PLASTICS PACKAGING MARKET REVENUE, BY COUNTRY, 2020–2028 ($MILLION)
TABLE 74.LATIN AMERICA RIGID PLASTICS PACKAGING MARKET REVENUE, BY MATERIAL, 2020–2028 ($MILLION)
TABLE 75.LATIN AMERICA RIGID PLASTICS PACKAGING MARKET REVENUE, BY PRODUCTION PROCESS, 2020–2028 ($MILLION)
TABLE 76.LATIN AMERICA RIGID PLASTICS PACKAGING MARKET REVENUE, BY END USER INDUSTRY, 2020–2028 ($MILLION)
TABLE 77.MIDDLE EAST RIGID PLASTICS PACKAGING MARKET REVENUE, BY MATERIAL, 2020–2028 ($MILLION)
TABLE 78.MIDDLE EAST RIGID PLASTICS PACKAGING MARKET REVENUE, BY PRODUCTION PROCESS, 2020–2028 ($MILLION)
TABLE 79.MIDDLE EAST RIGID PLASTICS PACKAGING MARKET REVENUE, BY END USER INDUSTRY, 2020–2028 ($MILLION)
TABLE 80.AFRICA RIGID PLASTICS PACKAGING MARKET REVENUE, BY MATERIAL, 2020–2028 ($MILLION)
TABLE 81.AFRICA RIGID PLASTICS PACKAGING MARKET REVENUE, BY PRODUCTION PROCESS, 2020–2028 ($MILLION)
TABLE 82.AFRICA RIGID PLASTICS PACKAGING MARKET REVENUE, BY END USER INDUSTRY, 2020–2028 ($MILLION)
TABLE 83.ALPLA: KEY EXECUTIVES
TABLE 84.ALPLA: COMPANY SNAPSHOT
TABLE 85.ALPLA: PRODUCT PORTFOLIO
TABLE 86.AMCOR: KEY EXECUTIVES
TABLE 87.AMCOR: COMPANY SNAPSHOT
TABLE 88.AMCOR: OPERATING SEGMENTS
TABLE 89.AMCOR: PRODUCT PORTFOLIO
TABLE 90.BERRY GLOBAL: KEY EXECUTIVES
TABLE 91.BERRY GLOBAL: COMPANY SNAPSHOT
TABLE 92.BERRY GLOBAL: OPERATING SEGMENTS
TABLE 93.BERRY GLOBAL: PRODUCT PORTFOLIO
TABLE 94.DS SMITH: KEY EXECUTIVES
TABLE 95.DS SMITH: COMPANY SNAPSHOT
TABLE 96.DS SMITH: OPERATING SEGMENTS
TABLE 97.DS SMITH: PRODUCT PORTFOLIO
TABLE 98.KLÖCKNER: KEY EXECUTIVES
TABLE 99.KLÖCKNER: COMPANY SNAPSHOT
TABLE 100.KLÖCKNER: PRODUCT PORTFOLIO
TABLE 101.PLASTIPAK: KEY EXECUTIVES
TABLE 102.PLASTIPAK: COMPANY SNAPSHOT
TABLE 103.PLASTIPAK: PRODUCT PORTFOLIO
TABLE 104.PACTIV EVERGREEN INC: KEY EXECUTIVES
TABLE 105.PACTIV EVERGREEN INC: COMPANY SNAPSHOT
TABLE 106.PACTIV EVERGREEN INC: OPERATING SEGMENTS
TABLE 107.PACTIV EVERGREEN INC: PRODUCT PORTFOLIO
TABLE 108.SEALED AIR CORPORATION: KEY EXECUTIVES
TABLE 109.SEALED AIR CORPORATION: COMPANY SNAPSHOT
TABLE 110.SEALED AIR CORPORATION: OPERATING SEGMENTS
TABLE 111.SEALED AIR CORPORATION: PRODUCT PORTFOLIO
TABLE 112.SILGAN: KEY EXECUTIVES
TABLE 113.SILGAN: COMPANY SNAPSHOT
TABLE 114.SILGAN: OPERATING SEGMENTS
TABLE 115.SILGAN: PRODUCT PORTFOLIO
TABLE 116.SONOCO: KEY EXECUTIVES
TABLE 117.SONOCO: COMPANY SNAPSHOT
TABLE 118.SONOCO: OPERATING SEGMENTS
TABLE 119.SONOCO: PRODUCT PORTFOLIO
LIST OF FIGURES
FIGURE 01.KEY MARKET SEGMENTS
FIGURE 02.EXECUTIVE SUMMARY
FIGURE 03.GLOBAL RIGID PLASTIC PACKAGING MARKET: KEY PLAYERS
FIGURE 04.TOP INVESTMENT POCKETS
FIGURE 05.TOP WINNING STRATEGIES, BY YEAR, 2017–2021
FIGURE 06.TOP WINNING STRATEGIES, BY DEVELOPMENT, 2017–2021 (%)
FIGURE 07.TOP WINNING STRATEGIES, BY COMPANY, 2017–2021 (%)
FIGURE 08.LOW BARGAINING POWER OF SUPPLIERS
FIGURE 09.MODERATE BARGAINING POWER OF BUYERS
FIGURE 10.LOW TO MODERATE THREAT OF SUBSTITUTES
FIGURE 11.MODERATE THREAT OF NEW ENTRANTS
FIGURE 12.MODERATE INTENSITY OF RIVALRY
FIGURE 13.KEY PLAYER POSITIONING
FIGURE 14.MARKET DYNAMICS
FIGURE 15.GLOBAL RIGID PLASTIC PACKAGING MARKET, BY MATERIAL, 2020–2028
FIGURE 16.COMPARATIVE SHARE ANALYSIS OF POLYETHYLENE TEREPHTHALATE (PET) RIGID PLASTICS PACKAGING MARKET, BY COUNTRY, 2020 & 2028 (%)
FIGURE 17.COMPARATIVE SHARE ANALYSIS OF POLYPROPYLENE (PP) RIGID PLASTICS PACKAGING MARKET, BY COUNTRY, 2020 & 2028 (%)
FIGURE 18.COMPARATIVE SHARE ANALYSIS OF HIGH-DENSITY POLYETHYLENE (HDPE)RIGID PLASTICS PACKAGING MARKET, BY COUNTRY, 2020 & 2028 (%)
FIGURE 19.COMPARATIVE SHARE ANALYSIS OF RIGID PLASTICS PACKAGING MARKET FOR OTHERS, BY COUNTRY, 2020 & 2028 (%)
FIGURE 20.GLOBAL RIGID PLASTIC PACKAGING MARKET, BY PRODUCTION PROCESS, 2020-2028 (%)
FIGURE 21.COMPARATIVE SHARE ANALYSIS OF RIGID PLASTIC PACKAGING MARKET FOR EXTRUSION, BY COUNTRY, 2020–2028 ($MILLION)
FIGURE 22.COMPARATIVE SHARE ANALYSIS OF RIGID PLASTIC PACKAGING MARKET FOR INJECTION MOLDING, BY COUNTRY, 2020–2028 ($MILLION)
FIGURE 23.COMPARATIVE SHARE ANALYSIS OF RIGID PLASTIC PACKAGING MARKET FOR BLOW MOLDING, BY COUNTRY, 2020–2028 ($MILLION)
FIGURE 24.COMPARATIVE SHARE ANALYSIS OF RIGID PLASTIC PACKAGING MARKET FOR THERMOFORMING, BY COUNTRY, 2020–2028 ($MILLION)
FIGURE 25.COMPARATIVE SHARE ANALYSIS OF RIGID PLASTIC PACKAGING MARKET FOR OTHERS, BY COUNTRY, 2020–2028 ($MILLION)
FIGURE 26.GLOBAL RIGID PLASTICS PACKAGING MARKET, BY END USER INDUSTRY, 2020–2028
FIGURE 27.COMPARATIVE SHARE ANALYSIS OF FOOD & BEVERAGE RIGID PLASTIC PACKAGING MARKET, BY COUNTRY, 2020 & 2028 (%)
FIGURE 28.COMPARATIVE SHARE ANALYSIS OF PERSONAL CARE RIGID PLASTIC PACKAGING MARKET, BY COUNTRY, 2020 & 2028 (%)
FIGURE 29.COMPARATIVE SHARE ANALYSIS OF HOUSEHOLD RIGID PLASTIC PACKAGING MARKET, BY COUNTRY, 2020 & 2028 (%)
FIGURE 30.COMPARATIVE SHARE ANALYSIS OF HEALTHCARE RIGID PLASTICS PACKAGING MARKET, BY COUNTRY, 2020 & 2028 (%)
FIGURE 31.COMPARATIVE SHARE ANALYSIS OF OTHERS RIGID PLASTICS PACKAGING MARKET, BY COUNTRY, 2020 & 2028 (%)
FIGURE 32.GLOBAL RIGID PLASTICS PACKAGING MARKET, BY REGION, 2020–2028
FIGURE 33.U.S. RIGID PLASTICS PACKAGING MARKET REVENUE, 2020–2028 ($MILLION)
FIGURE 34.CANADA RIGID PLASTICS PACKAGING MARKET REVENUE, 2020–2028 ($MILLION)
FIGURE 35.MEXICO RIGID PLASTICS PACKAGING MARKET REVENUE, 2020–2028 ($MILLION)
FIGURE 36.GERMANY RIGID PLASTICS PACKAGING MARKET REVENUE, 2020–2028 ($MILLION)
FIGURE 37.FRANCE RIGID PLASTICS PACKAGING MARKET REVENUE, 2020–2028 ($MILLION)
FIGURE 38.UK RIGID PLASTICS PACKAGING MARKET REVENUE, 2020–2028 ($MILLION)
FIGURE 39.RUSSIA RIGID PLASTICS PACKAGING MARKET REVENUE, 2020–2028 ($MILLION)
FIGURE 40.REST OF EUROPE RIGID PLASTICS PACKAGING MARKET REVENUE, 2020–2028 ($MILLION)
FIGURE 41.JAPAN RIGID PLASTICS PACKAGING MARKET REVENUE, 2020–2028 ($MILLION)
FIGURE 42.CHINA RIGID PLASTICS PACKAGING MARKET REVENUE, 2020–2028 ($MILLION)
FIGURE 43.INDIA RIGID PLASTICS PACKAGING MARKET REVENUE, 2020–2028 ($MILLION)
FIGURE 44.AUSTRALIA RIGID PLASTICS PACKAGING MARKET REVENUE, 2020–2028 ($MILLION)
FIGURE 45.REST OF ASIA-PACIFIC RIGID PLASTICS PACKAGING MARKET REVENUE, 2020–2028 ($MILLION)
FIGURE 46.LATIN AMERICA RIGID PLASTICS PACKAGING MARKET REVENUE, 2020–2028 ($MILLION)
FIGURE 47.MIDDLE EAST RIGID PLASTICS PACKAGING MARKET REVENUE, 2020–2028 ($MILLION)
FIGURE 48.AFRICA EAST RIGID PLASTICS PACKAGING MARKET REVENUE, 2020–2028 ($MILLION)
FIGURE 49.AMCOR: R&D EXPENDITURE, 2018–2020 ($MILLION)
FIGURE 50.AMCOR: REVENUE, 2018–2020 ($MILLION)
FIGURE 51.AMCOR: REVENUE SHARE BY SEGMENT, 2020(%)
FIGURE 52.AMCOR: REVENUE SHARE BY REGION, 2020 (%)
FIGURE 53.BERRY GLOBAL: R&D EXPENDITURE, 2018–2020 ($MILLION)
FIGURE 54.BERRY GLOBAL: REVENUE, 2018–2020 ($MILLION)
FIGURE 55.BERRY GLOBAL: REVENUE SHARE BY SEGMENT, 2020(%)
FIGURE 56.BERRY GLOBAL: REVENUE SHARE BY REGION, 2020 (%)
FIGURE 57.DS SMITH: R&D EXPENDITURE, 2018–2020 ($MILLION)
FIGURE 58.DS SMITH: REVENUE, 2018–2020 ($MILLION)
FIGURE 59.DS SMITH: REVENUE SHARE BY REGION, 2020 (%)
FIGURE 60.KLOCKNER: R&D EXPENDITURE, 2018–2020 ($MILLION)
FIGURE 61.KLÖCKNER: REVENUE, 2018–2020 ($MILLION)
FIGURE 62.KLOCKNER: REVENUE SHARE BY REGION, 2020 (%)
FIGURE 63.PACTIV EVERGREEN INC: R&D EXPENDITURE, 2018–2020 ($MILLION)
FIGURE 64.PACTIV EVERGEEEN INC: REVENUE, 2018–2020 ($MILLION)
FIGURE 65.PACTIV EVERGREEN INC: REVENUE SHARE BY SEGMENT, 2020 (%)
FIGURE 66.PACTIV EVERGREEN INC: REVENUE SHARE BY REGION, 2020 (%)
FIGURE 67.SEALED AIR CORPORATION: R&D EXPENDITURE, 2018–2020 ($MILLION)
FIGURE 68.SEALED AIR CORPORATION: REVENUE, 2018–2020 ($MILLION)
FIGURE 69.SEALED AIR CORPORATION: REVENUE SHARE BY SEGMENT, 2020(%)
FIGURE 70.SEALED AIR CORPORATION: REVENUE SHARE BY REGION, 2020 (%)
FIGURE 71.SILGAN: REVENUE, 2018–2020 ($MILLION)
FIGURE 72.SILGAN: REVENUE SHARE BY SEGMENT, 2020 (%)
FIGURE 73.SILGAN: REVENUE SHARE BY REGION, 2020 (%)
FIGURE 74.SONOCO: R&D EXPENDITURE, 2018–2020 ($MILLION)
FIGURE 75.SONOCO: REVENUE, 2018–2020 ($MILLION)
FIGURE 76.SONOCO: REVENUE SHARE BY SEGMENT, 2020 (%)
FIGURE 77.SONOCO: REVENUE SHARE BY REGION, 2020 (%)
Over the years, the rigid plastics packaging industry has created significant value for consumer companies through innovations that reduce production & shipping costs and design advances that enable brand differentiation & boost their sales. Rigid plastic is used to manufacture jars, bottles, soft drink containers, cosmetics, personal care, and pharmaceutical products. Material such as high-density poly ethylene (HDPE), polypropylene (PP), polyethylene terephthalate (PET), and polyvinyl chloride (PVC) are used, owing to their associated benefits such as prolonged durability, robust & economic nature, easy availability.
The market growth in emerging countries is fueled by rise in consumer demand, while growth in mature consumer markets is driven by demographic changes. In addition, surge in disposable income and rapid urbanization create a new customer base for consumer goods companies. There is a strong correlation between the average income per person and packaging consumption that makes emerging markets lag behind the developed market, in terms of rigid plastics packaging consumption.
Another key driver of the global rigid plastics packaging market is the escalating online retail, which creates high scope for board packaging used to protect goods for delivery. The demographic shift toward smaller and single households further boosts the demand for smaller pack sizes and single portion packs, creating more packaging per unit of products consumed.
Among the analyzed regions, Asia-Pacific is expected to account for the highest revenue during the forecast period, owing to dense population and rise in demand for packaging industries, followed by Europe, North America, and LAMEA.
A. Factors such as a rise in demand for packaging in home & personal care goods, fresh food & beverage, and retail industries, along with the growth of the pharmaceutical industry
A. The global rigid plastics packaging market was valued at $216.85 billion in 2018.
A. To get latest version of rigid plastic packaging market report
A. The key trends in the market are an increase in global consumption of consumer goods and a rise in e-commerce sales globally.
A. Product launch and product development are some of the key growth strategies adopted by the rigid plastic packaging market players.
A. On the basis of top growing big corporation we select top 10 players.
A. The leading players operating in the global market are ALPLA-Werke Alwin Lehner GmbH & Co KG, Amcor Limited, DS Smith Plc, Berry Plastics Corporation, Klöckner Pentaplast
A. Asia-Pacific is expected to provide more business opportunities for rigid plastic packaging in the future.
Start reading instantly.
This Report and over 66,983+ more Reports, Available with Avenue Library. T&C*.
Enterprise
License/PDF
Library
Membership
*Taxes/Fees, if applicable will be added during checkout. All prices in USD
To ensure high-level data integrity, accurate analysis, and impeccable forecasts
For complete satisfaction
On-demand customization of scope of the report to exactly meet your needs
Targeted market view to provide pertinent information and save time of readers
Get insights on topics that are crucial for your business. Stay abreast of your interest areas.
Get Industry Data AlertsTo ensure high-level data integrity, accurate analysis, and impeccable forecasts
For complete satisfaction
On-demand customization of scope of the report to exactly meet your needs
Targeted market view to provide pertinent information and save time of readers