0
2022
Roadside Drug Testing Devices Market

Roadside Drug Testing Devices Market

by Sample Type (Saliva, Breath, Others), by Substance (Drugs, Alcohol), by End User (Highway Police, Drug Enforcement Agencies): Global Opportunity Analysis and Industry Forecast, 2021-2031

Report Code: A15453
Nov 2022 | Pages: 203
Tables: 141
Charts: 57
  • Formats*:

  • pdf

    Single User License, Five User
    License & Enterprise User License

  • xls

    Data Pack Excel License

  • ppt

    It comes with the additional cost
    of $2500.00 contact sales.


Roadside Drug Testing Devices Market Research, 2031

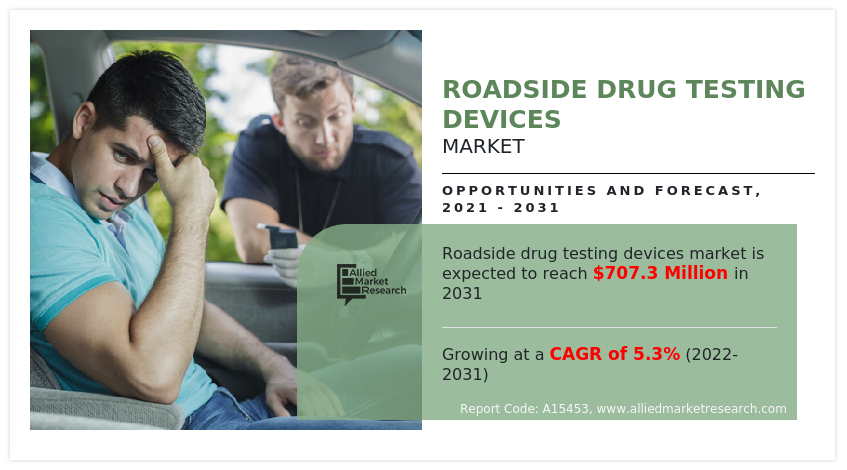
The global roadside drug testing devices market size was valued at $421.8 million in 2021, and is projected to reach $707.3 million by 2031, growing at a CAGR of 5.3% from 2022 to 2031.

Roadside drug testing is screening of presence of drugs & alcohol in the blood while driving motor vehicles. It includes different devices such as breathalyzers and oral fluid testing kit. Oral fluid test kits are the ones where saliva sample is taken from the driver and is used to test the presence of traces of alcohol in blood. These tests are carried out as it is strictly prohibited to be under the influence of drugs while driving.
According to the National Highway Traffic Safety Administration, since the beginning of 2021, the percentage of people staying home per day has dropped from a high of 26% in January to approximately 23% in May and June. This suggests that while more people are traveling outside the home in 2021, the rates have not returned to pre-pandemic levels. However, these rates were normalized since second half of 2021 which is boosting the market trends of roadside drug testing devices, owing to increasing in consumption of drugs & alcohol while driving among the major younger population.

Roadside Drug Testing Devices Market

Increase in prevalence of drink and drive all over the globe, propel the growth of the market during the roadside drug testing devices market forecast. For instance, according to a report by the National Institute on Alcohol Abuse and Alcoholism in 2019, 10,142 people lost their lives as a result of drunk driving. Alarming rise in prevalence of death due to drink & drive is a primary factor fueling the growth of the global market. Further, advances in drug testing devices used for screening contribute to the market expansion. In addition, it is projected that new norms & regulations by drug enforcement management is projected to propel the growth of the market. However, wrong result displayed by the devices and high cost of the devices restrain the expansion of the market. 

Alcohol and drugs are detected with the help of breathalyzers, drug wipes, and oral fluids. Breathalyzers are compact, portable devices with a mouthpiece and two liquid-filled chambers, which determine the amount of alcohol in the system of persons suspected of being intoxicated. The subject exhales into a test container that is filled with a liquid potassium dichromate solution that is orange-red. Surfaces are examined for any indications of drug residue using a technique known as the drug wipe. Sweat or saliva tests may also be used on people. Law enforcement authorities may quickly screen drivers they suspect of being under the influence of narcotics using the drug wipe at the roadside.

World Health Organization (WHO) states that the risk of road accidents is increased due to increase in dependence on the psychoactive drug used. For instance, the risk of a fatal crash occurring among those who have used amphetamines is about 5 times the risk of someone who has not used it. Further, in high-income countries, around 20% of the injured drivers have excess alcohol content in their blood. As a result, there is a in demand for breath analyzers, driving the growth of the market. Furthermore, remarkable government funding for deployment of breath analyzers to control alcohol & drug abuse is expected to drive the demand for the breath analyzers. In addition to this, adoption of breath analyzers by police & other law enforcement authorities around the globe will accelerate the market growth in the forecast period.

Although the growth of the market is driven by many factors, there are few concerns that may hinder the growth of the market. Inaccurate results associated with roadside drug testing devices is one such factor that hampers the market growth. The device shows false results or negative results in some cases which is mainly due to technical errors associated with the device and malfunctioning due to cold weather conditions. In case of cold weather, batteries of devices are mainly affected and may get discharged early and frequently which may affect the results accuracy. Moreover, sometimes the results shown may be false due to the minor errors associated with the devices. In addition, sample contamination is also one of the main factors leading to the inaccurate results, thus causing hindrance to the growth of the market.

Impact of COVID-19 on Roadside Drug Testing Devices Market

Severe Acute Respiratory Syndrome Corona Virus-2 (SARS-CoV-2) is an infectious disease caused by the novel coronavirus (COVID-19), which originated in the Wuhan district in China in the late 2019, and since has spread to 212 countries. The virus was initially referred to as “novel coronavirus 2019” (2019-nCoV) by the WHO, However, on February 11, 2020, it was given the official name of SARS-CoV-2 by the International Committee on Taxonomy of Viruses. The WHO declared COVID-19 as pandemic on March 11, 2020, and by September 1, 2020, over 28.1 million people have been infected globally with over 909,000 deaths.

Nearly all industries have been impacted by the outbreak of COVID-19. Coronavirus crises forced healthcare organizations to devote the majority of their funds to fighting COVID-19. In addition, according to the National Highway Traffic Safety Administration, since the beginning of 2021, the percentage of people staying home per day has dropped from a high of 26% in January to approximately 23% in May and June. This suggests that while more people are traveling outside the home in 2021, the rates have not returned to pre-pandemic levels. However, these rates were normalized since second half of 2021 which is boosting the roadside drug testing devices market growth, owing to increasing in consumption of drugs & alcohol while driving among the major younger population.

The roadside drug testing devices Industry is segmented into sample type, substance type, and end users. By sample type, the market is categorized into saliva, breath, and others. On the basis of substance type, the market is segregated into drugs and alcohol. End-user wise, the market is segmented into highway police and drug enforcement management. As per region, the market is analyzed across North America (the U.S., Canada, and Mexico), Europe (Germany, France, the UK, Italy, Spain, and rest of Europe), Asia-Pacific (Japan, China, Australia, India, South Korea, and rest of Asia-Pacific), and LAMEA (Brazil, South Africa, Saudi Arabia, and rest of LAMEA). 

By Sample Type Segment Review

Roadside Drug Testing Devices Market

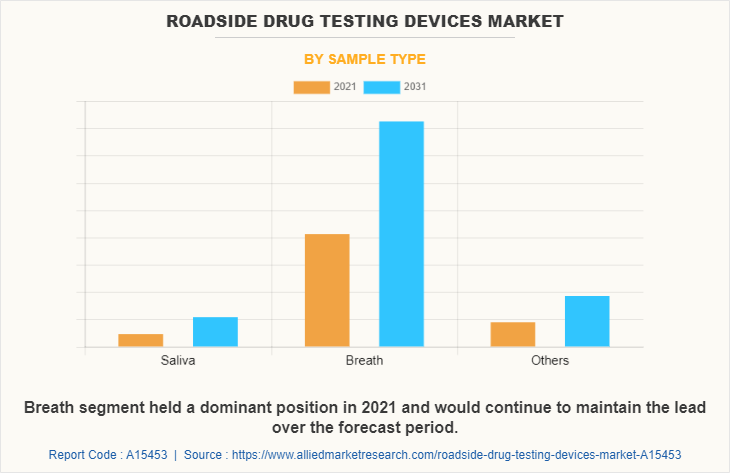
On the basis of sample type, the breath segment dominated the market and is expected to register the highest CAGR, owing to wide availability and new product launches & approval in this category. 
By Substance Segment Review

Roadside Drug Testing Devices Market

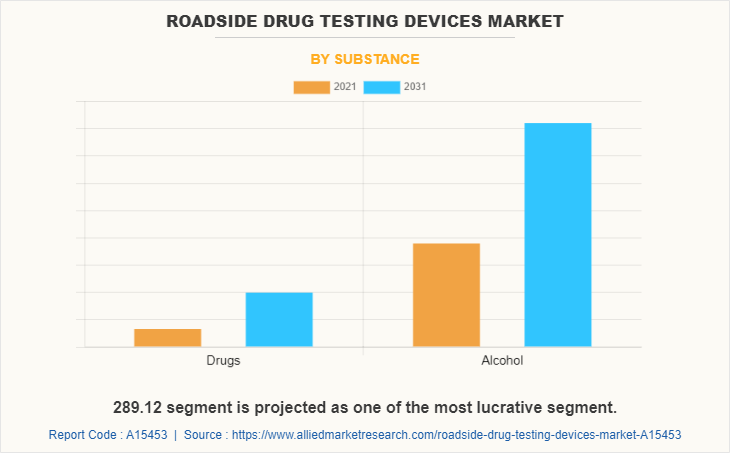
On the basis of substance type, the alcohol segment was the major revenue contributor in 2021 and is expected to register the highest CAGR, owing to surge in the incidence of deaths due to drink & drive. 
By End User Segment Review 

Roadside Drug Testing Devices Market

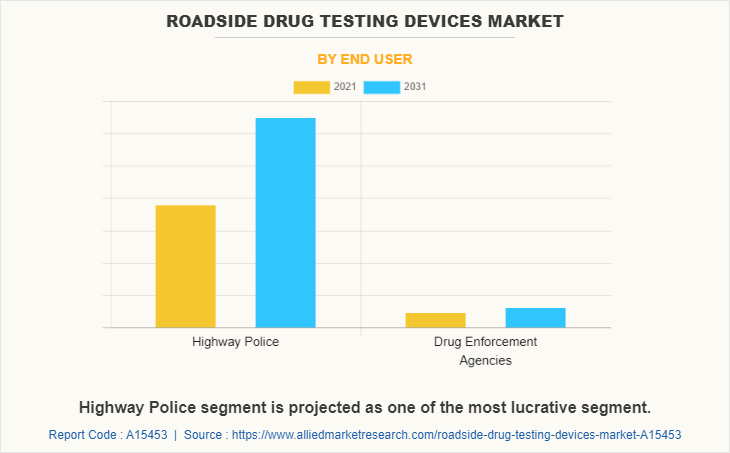
On the basis of end user, the highway police segment dominated the market in 2021 and is expected to register the highest CAGR, owing to surge in the number of driving motor vehicles under the influence of alcohol & drugs. 
Region Segment Review

Roadside Drug Testing Devices Market

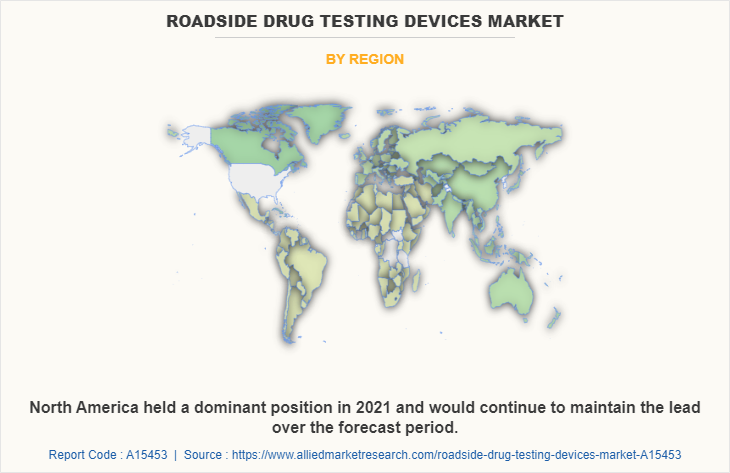
Region wise, North America had the highest roadside drug testing devices market share in 2021, and is expected to maintain its lead during the forecast period, owing to high prevalence rate of the alcoholism in this region. However, Asia-Pacific is expected to register the highest CAGR, due to the presence of high population base and untapped market opportunities. 

Some of the major companies that operate in the market include Abbott Laboratories., AK GlobalTech Corporation, Alcohol Countermeasure Systems Corp., Cannabix Technologies, Dräger, Intelligent fingerprinting, Lifeloc Technologies, Inc., Oranoxis Inc., Thermo Fisher Scientific, Inc., and UriTox LLC. 

Key Benefits For Stakeholders

  • This report provides a quantitative analysis of the market segments, current trends, estimations, and dynamics of the roadside drug testing devices market analysis from 2021 to 2031 to identify the prevailing roadside drug testing devices market opportunity.
  • The market research is offered along with information related to key drivers, restraints, and opportunities.
  • Porter's five forces analysis highlights the potency of buyers and suppliers to enable stakeholders make profit-oriented business decisions and strengthen their supplier-buyer network.
  • In-depth analysis of the roadside drug testing devices market segmentation assists to determine the prevailing market opportunities.
  • Major countries in each region are mapped according to their revenue contribution to the global market.
  • Market player positioning facilitates benchmarking and provides a clear understanding of the present position of the market players.
  • The report includes the analysis of the regional as well as global roadside drug testing devices market trends, key players, market segments, application areas, and market growth strategies.

Roadside Drug Testing Devices Market Report Highlights

Aspects Details
Market Size By 2031 USD 707.3 million
Growth Rate CAGR of 5.3%
Forecast period 2021 - 2031
Report Pages 203
By Sample Type
  • Saliva
  • Breath
  • Others
By Substance
  • Drugs
  • Alcohol
By End User
  • Highway Police
  • Drug Enforcement Agencies
By Region
  • North America  (U.S., Canada, Mexico)
  • Europe  (Germany, France, UK, Italy, Spain, Rest of Europe)
  • Asia-Pacific  (Japan, China, Australia, India, South Korea, Rest of Asia-Pacific)
  • LAMEA  (Brazil, Saudi Arabia, South Africa, Rest of LAMEA)
Key Market Players Dräger, AK GlobalTech Corporation, Lifeloc Technologies, Inc., Intelligent Fingerprinting, Oranoxis Inc., Cannabix Technologies Inc., Abbott Laboratories, Alcohol Countermeasure Systems Corp., Thermo Fisher Scientific, Inc., UriTox LLC.
 
  • CHAPTER 1:INTRODUCTION

    • 1.1.Report description

    • 1.2.Key market segments

    • 1.3.Key benefits to the stakeholders

    • 1.4.Research Methodology

      • 1.4.1.Secondary research

      • 1.4.2.Primary research

      • 1.4.3.Analyst tools and models

  • CHAPTER 2:EXECUTIVE SUMMARY

    • 2.1.Key findings of the study

    • 2.2.CXO Perspective

  • CHAPTER 3:MARKET OVERVIEW

    • 3.1.Market definition and scope

    • 3.2.Key findings

      • 3.2.1.Top investment pockets

    • 3.3.Porter’s five forces analysis

    • 3.4.Top player positioning

    • 3.5.Market dynamics

      • 3.5.1.Drivers

      • 3.5.2.Restraints

      • 3.5.3.Opportunities

    • 3.6.COVID-19 Impact Analysis on the market

  • CHAPTER 4: ROADSIDE DRUG TESTING DEVICES MARKET, BY SAMPLE TYPE

    • 4.1 Overview

      • 4.1.1 Market size and forecast

    • 4.2 Saliva

      • 4.2.1 Key market trends, growth factors and opportunities

      • 4.2.2 Market size and forecast, by region

      • 4.2.3 Market share analysis by country

    • 4.3 Breath

      • 4.3.1 Key market trends, growth factors and opportunities

      • 4.3.2 Market size and forecast, by region

      • 4.3.3 Market share analysis by country

    • 4.4 Others

      • 4.4.1 Key market trends, growth factors and opportunities

      • 4.4.2 Market size and forecast, by region

      • 4.4.3 Market share analysis by country

  • CHAPTER 5: ROADSIDE DRUG TESTING DEVICES MARKET, BY SUBSTANCE

    • 5.1 Overview

      • 5.1.1 Market size and forecast

    • 5.2 Drugs

      • 5.2.1 Key market trends, growth factors and opportunities

      • 5.2.2 Market size and forecast, by region

      • 5.2.3 Market share analysis by country

    • 5.3 Alcohol

      • 5.3.1 Key market trends, growth factors and opportunities

      • 5.3.2 Market size and forecast, by region

      • 5.3.3 Market share analysis by country

  • CHAPTER 6: ROADSIDE DRUG TESTING DEVICES MARKET, BY END USER

    • 6.1 Overview

      • 6.1.1 Market size and forecast

    • 6.2 Highway Police

      • 6.2.1 Key market trends, growth factors and opportunities

      • 6.2.2 Market size and forecast, by region

      • 6.2.3 Market share analysis by country

    • 6.3 Drug Enforcement Agencies

      • 6.3.1 Key market trends, growth factors and opportunities

      • 6.3.2 Market size and forecast, by region

      • 6.3.3 Market share analysis by country

  • CHAPTER 7: ROADSIDE DRUG TESTING DEVICES MARKET, BY REGION

    • 7.1 Overview

      • 7.1.1 Market size and forecast

    • 7.2 North America

      • 7.2.1 Key trends and opportunities

      • 7.2.2 North America Market size and forecast, by Sample Type

      • 7.2.3 North America Market size and forecast, by Substance

      • 7.2.4 North America Market size and forecast, by End User

      • 7.2.5 North America Market size and forecast, by country

        • 7.2.5.1 U.S.
          • 7.2.5.1.1 Key market trends, growth factors and opportunities
          • 7.2.5.1.2 Market size and forecast, by Sample Type
          • 7.2.5.1.3 Market size and forecast, by Substance
          • 7.2.5.1.4 Market size and forecast, by End User
        • 7.2.5.2 Canada
          • 7.2.5.2.1 Key market trends, growth factors and opportunities
          • 7.2.5.2.2 Market size and forecast, by Sample Type
          • 7.2.5.2.3 Market size and forecast, by Substance
          • 7.2.5.2.4 Market size and forecast, by End User
        • 7.2.5.3 Mexico
          • 7.2.5.3.1 Key market trends, growth factors and opportunities
          • 7.2.5.3.2 Market size and forecast, by Sample Type
          • 7.2.5.3.3 Market size and forecast, by Substance
          • 7.2.5.3.4 Market size and forecast, by End User
    • 7.3 Europe

      • 7.3.1 Key trends and opportunities

      • 7.3.2 Europe Market size and forecast, by Sample Type

      • 7.3.3 Europe Market size and forecast, by Substance

      • 7.3.4 Europe Market size and forecast, by End User

      • 7.3.5 Europe Market size and forecast, by country

        • 7.3.5.1 Germany
          • 7.3.5.1.1 Key market trends, growth factors and opportunities
          • 7.3.5.1.2 Market size and forecast, by Sample Type
          • 7.3.5.1.3 Market size and forecast, by Substance
          • 7.3.5.1.4 Market size and forecast, by End User
        • 7.3.5.2 France
          • 7.3.5.2.1 Key market trends, growth factors and opportunities
          • 7.3.5.2.2 Market size and forecast, by Sample Type
          • 7.3.5.2.3 Market size and forecast, by Substance
          • 7.3.5.2.4 Market size and forecast, by End User
        • 7.3.5.3 UK
          • 7.3.5.3.1 Key market trends, growth factors and opportunities
          • 7.3.5.3.2 Market size and forecast, by Sample Type
          • 7.3.5.3.3 Market size and forecast, by Substance
          • 7.3.5.3.4 Market size and forecast, by End User
        • 7.3.5.4 Italy
          • 7.3.5.4.1 Key market trends, growth factors and opportunities
          • 7.3.5.4.2 Market size and forecast, by Sample Type
          • 7.3.5.4.3 Market size and forecast, by Substance
          • 7.3.5.4.4 Market size and forecast, by End User
        • 7.3.5.5 Spain
          • 7.3.5.5.1 Key market trends, growth factors and opportunities
          • 7.3.5.5.2 Market size and forecast, by Sample Type
          • 7.3.5.5.3 Market size and forecast, by Substance
          • 7.3.5.5.4 Market size and forecast, by End User
        • 7.3.5.6 Rest of Europe
          • 7.3.5.6.1 Key market trends, growth factors and opportunities
          • 7.3.5.6.2 Market size and forecast, by Sample Type
          • 7.3.5.6.3 Market size and forecast, by Substance
          • 7.3.5.6.4 Market size and forecast, by End User
    • 7.4 Asia-Pacific

      • 7.4.1 Key trends and opportunities

      • 7.4.2 Asia-Pacific Market size and forecast, by Sample Type

      • 7.4.3 Asia-Pacific Market size and forecast, by Substance

      • 7.4.4 Asia-Pacific Market size and forecast, by End User

      • 7.4.5 Asia-Pacific Market size and forecast, by country

        • 7.4.5.1 Japan
          • 7.4.5.1.1 Key market trends, growth factors and opportunities
          • 7.4.5.1.2 Market size and forecast, by Sample Type
          • 7.4.5.1.3 Market size and forecast, by Substance
          • 7.4.5.1.4 Market size and forecast, by End User
        • 7.4.5.2 China
          • 7.4.5.2.1 Key market trends, growth factors and opportunities
          • 7.4.5.2.2 Market size and forecast, by Sample Type
          • 7.4.5.2.3 Market size and forecast, by Substance
          • 7.4.5.2.4 Market size and forecast, by End User
        • 7.4.5.3 Australia
          • 7.4.5.3.1 Key market trends, growth factors and opportunities
          • 7.4.5.3.2 Market size and forecast, by Sample Type
          • 7.4.5.3.3 Market size and forecast, by Substance
          • 7.4.5.3.4 Market size and forecast, by End User
        • 7.4.5.4 India
          • 7.4.5.4.1 Key market trends, growth factors and opportunities
          • 7.4.5.4.2 Market size and forecast, by Sample Type
          • 7.4.5.4.3 Market size and forecast, by Substance
          • 7.4.5.4.4 Market size and forecast, by End User
        • 7.4.5.5 South Korea
          • 7.4.5.5.1 Key market trends, growth factors and opportunities
          • 7.4.5.5.2 Market size and forecast, by Sample Type
          • 7.4.5.5.3 Market size and forecast, by Substance
          • 7.4.5.5.4 Market size and forecast, by End User
        • 7.4.5.6 Rest of Asia-Pacific
          • 7.4.5.6.1 Key market trends, growth factors and opportunities
          • 7.4.5.6.2 Market size and forecast, by Sample Type
          • 7.4.5.6.3 Market size and forecast, by Substance
          • 7.4.5.6.4 Market size and forecast, by End User
    • 7.5 LAMEA

      • 7.5.1 Key trends and opportunities

      • 7.5.2 LAMEA Market size and forecast, by Sample Type

      • 7.5.3 LAMEA Market size and forecast, by Substance

      • 7.5.4 LAMEA Market size and forecast, by End User

      • 7.5.5 LAMEA Market size and forecast, by country

        • 7.5.5.1 Brazil
          • 7.5.5.1.1 Key market trends, growth factors and opportunities
          • 7.5.5.1.2 Market size and forecast, by Sample Type
          • 7.5.5.1.3 Market size and forecast, by Substance
          • 7.5.5.1.4 Market size and forecast, by End User
        • 7.5.5.2 Saudi Arabia
          • 7.5.5.2.1 Key market trends, growth factors and opportunities
          • 7.5.5.2.2 Market size and forecast, by Sample Type
          • 7.5.5.2.3 Market size and forecast, by Substance
          • 7.5.5.2.4 Market size and forecast, by End User
        • 7.5.5.3 South Africa
          • 7.5.5.3.1 Key market trends, growth factors and opportunities
          • 7.5.5.3.2 Market size and forecast, by Sample Type
          • 7.5.5.3.3 Market size and forecast, by Substance
          • 7.5.5.3.4 Market size and forecast, by End User
        • 7.5.5.4 Rest of LAMEA
          • 7.5.5.4.1 Key market trends, growth factors and opportunities
          • 7.5.5.4.2 Market size and forecast, by Sample Type
          • 7.5.5.4.3 Market size and forecast, by Substance
          • 7.5.5.4.4 Market size and forecast, by End User
  • CHAPTER 8: COMPANY LANDSCAPE

    • 8.1. Introduction

    • 8.2. Top winning strategies

    • 8.3. Product Mapping of Top 10 Player

    • 8.4. Competitive Dashboard

    • 8.5. Competitive Heatmap

    • 8.6. Key developments

  • CHAPTER 9: COMPANY PROFILES

    • 9.1 Abbott Laboratories

      • 9.1.1 Company overview

      • 9.1.2 Company snapshot

      • 9.1.3 Operating business segments

      • 9.1.4 Product portfolio

      • 9.1.5 Business performance

      • 9.1.6 Key strategic moves and developments

    • 9.2 AK GlobalTech Corporation

      • 9.2.1 Company overview

      • 9.2.2 Company snapshot

      • 9.2.3 Operating business segments

      • 9.2.4 Product portfolio

      • 9.2.5 Business performance

      • 9.2.6 Key strategic moves and developments

    • 9.3 Alcohol Countermeasure Systems Corp.

      • 9.3.1 Company overview

      • 9.3.2 Company snapshot

      • 9.3.3 Operating business segments

      • 9.3.4 Product portfolio

      • 9.3.5 Business performance

      • 9.3.6 Key strategic moves and developments

    • 9.4 Cannabix Technologies Inc.

      • 9.4.1 Company overview

      • 9.4.2 Company snapshot

      • 9.4.3 Operating business segments

      • 9.4.4 Product portfolio

      • 9.4.5 Business performance

      • 9.4.6 Key strategic moves and developments

    • 9.5 Dräger

      • 9.5.1 Company overview

      • 9.5.2 Company snapshot

      • 9.5.3 Operating business segments

      • 9.5.4 Product portfolio

      • 9.5.5 Business performance

      • 9.5.6 Key strategic moves and developments

    • 9.6 Intelligent Fingerprinting

      • 9.6.1 Company overview

      • 9.6.2 Company snapshot

      • 9.6.3 Operating business segments

      • 9.6.4 Product portfolio

      • 9.6.5 Business performance

      • 9.6.6 Key strategic moves and developments

    • 9.7 Lifeloc Technologies, Inc.

      • 9.7.1 Company overview

      • 9.7.2 Company snapshot

      • 9.7.3 Operating business segments

      • 9.7.4 Product portfolio

      • 9.7.5 Business performance

      • 9.7.6 Key strategic moves and developments

    • 9.8 Oranoxis Inc.

      • 9.8.1 Company overview

      • 9.8.2 Company snapshot

      • 9.8.3 Operating business segments

      • 9.8.4 Product portfolio

      • 9.8.5 Business performance

      • 9.8.6 Key strategic moves and developments

    • 9.9 Thermo Fisher Scientific, Inc.

      • 9.9.1 Company overview

      • 9.9.2 Company snapshot

      • 9.9.3 Operating business segments

      • 9.9.4 Product portfolio

      • 9.9.5 Business performance

      • 9.9.6 Key strategic moves and developments

    • 9.10 UriTox LLC.

      • 9.10.1 Company overview

      • 9.10.2 Company snapshot

      • 9.10.3 Operating business segments

      • 9.10.4 Product portfolio

      • 9.10.5 Business performance

      • 9.10.6 Key strategic moves and developments

  • LIST OF TABLES

  • TABLE 1. GLOBAL ROADSIDE DRUG TESTING DEVICES MARKET, BY SAMPLE TYPE, 2021-2031 (REVENUE, $MILLION)
    TABLE 2. ROADSIDE DRUG TESTING DEVICES MARKET FOR SALIVA, BY REGION, 2021-2031 (REVENUE, $MILLION)
    TABLE 3. ROADSIDE DRUG TESTING DEVICES MARKET FOR SALIVA, BY COUNTRY, 2021-2031 (REVENUE, $MILLION)
    TABLE 4. ROADSIDE DRUG TESTING DEVICES MARKET FOR BREATH, BY REGION, 2021-2031 (REVENUE, $MILLION)
    TABLE 5. ROADSIDE DRUG TESTING DEVICES MARKET FOR BREATH, BY COUNTRY, 2021-2031 (REVENUE, $MILLION)
    TABLE 6. ROADSIDE DRUG TESTING DEVICES MARKET FOR OTHERS, BY REGION, 2021-2031 (REVENUE, $MILLION)
    TABLE 7. ROADSIDE DRUG TESTING DEVICES MARKET FOR OTHERS, BY COUNTRY, 2021-2031 (REVENUE, $MILLION)
    TABLE 8. GLOBAL ROADSIDE DRUG TESTING DEVICES MARKET, BY SUBSTANCE, 2021-2031 (REVENUE, $MILLION)
    TABLE 9. ROADSIDE DRUG TESTING DEVICES MARKET FOR DRUGS, BY REGION, 2021-2031 (REVENUE, $MILLION)
    TABLE 10. ROADSIDE DRUG TESTING DEVICES MARKET FOR DRUGS, BY COUNTRY, 2021-2031 (REVENUE, $MILLION)
    TABLE 11. ROADSIDE DRUG TESTING DEVICES MARKET FOR ALCOHOL, BY REGION, 2021-2031 (REVENUE, $MILLION)
    TABLE 12. ROADSIDE DRUG TESTING DEVICES MARKET FOR ALCOHOL, BY COUNTRY, 2021-2031 (REVENUE, $MILLION)
    TABLE 13. GLOBAL ROADSIDE DRUG TESTING DEVICES MARKET, BY END USER, 2021-2031 (REVENUE, $MILLION)
    TABLE 14. ROADSIDE DRUG TESTING DEVICES MARKET FOR HIGHWAY POLICE, BY REGION, 2021-2031 (REVENUE, $MILLION)
    TABLE 15. ROADSIDE DRUG TESTING DEVICES MARKET FOR HIGHWAY POLICE, BY COUNTRY, 2021-2031 (REVENUE, $MILLION)
    TABLE 16. ROADSIDE DRUG TESTING DEVICES MARKET FOR DRUG ENFORCEMENT AGENCIES, BY REGION, 2021-2031 (REVENUE, $MILLION)
    TABLE 17. ROADSIDE DRUG TESTING DEVICES MARKET FOR DRUG ENFORCEMENT AGENCIES, BY COUNTRY, 2021-2031 (REVENUE, $MILLION)
    TABLE 18. ROADSIDE DRUG TESTING DEVICES MARKET, BY REGION, 2021-2031 (REVENUE, $MILLION)
    TABLE 19. NORTH AMERICA ROADSIDE DRUG TESTING DEVICES MARKET, BY SAMPLE TYPE, 2021-2031 (REVENUE, $MILLION)
    TABLE 20. NORTH AMERICA ROADSIDE DRUG TESTING DEVICES MARKET, BY SUBSTANCE, 2021-2031 (REVENUE, $MILLION)
    TABLE 21. NORTH AMERICA ROADSIDE DRUG TESTING DEVICES MARKET, BY END USER, 2021-2031 (REVENUE, $MILLION)
    TABLE 22. NORTH AMERICA ROADSIDE DRUG TESTING DEVICES MARKET, BY COUNTRY, 2021-2031 (REVENUE, $MILLION)
    TABLE 23. U.S. ROADSIDE DRUG TESTING DEVICES MARKET, BY SAMPLE TYPE, 2021-2031 (REVENUE, $MILLION)
    TABLE 24. U.S. ROADSIDE DRUG TESTING DEVICES MARKET, BY SUBSTANCE, 2021-2031 (REVENUE, $MILLION)
    TABLE 25. U.S. ROADSIDE DRUG TESTING DEVICES MARKET, BY END USER, 2021-2031 (REVENUE, $MILLION)
    TABLE 26. CANADA ROADSIDE DRUG TESTING DEVICES MARKET, BY SAMPLE TYPE, 2021-2031 (REVENUE, $MILLION)
    TABLE 27. CANADA ROADSIDE DRUG TESTING DEVICES MARKET, BY SUBSTANCE, 2021-2031 (REVENUE, $MILLION)
    TABLE 28. CANADA ROADSIDE DRUG TESTING DEVICES MARKET, BY END USER, 2021-2031 (REVENUE, $MILLION)
    TABLE 29. MEXICO ROADSIDE DRUG TESTING DEVICES MARKET, BY SAMPLE TYPE, 2021-2031 (REVENUE, $MILLION)
    TABLE 30. MEXICO ROADSIDE DRUG TESTING DEVICES MARKET, BY SUBSTANCE, 2021-2031 (REVENUE, $MILLION)
    TABLE 31. MEXICO ROADSIDE DRUG TESTING DEVICES MARKET, BY END USER, 2021-2031 (REVENUE, $MILLION)
    TABLE 32. EUROPE ROADSIDE DRUG TESTING DEVICES MARKET, BY SAMPLE TYPE, 2021-2031 (REVENUE, $MILLION)
    TABLE 33. EUROPE ROADSIDE DRUG TESTING DEVICES MARKET, BY SUBSTANCE, 2021-2031 (REVENUE, $MILLION)
    TABLE 34. EUROPE ROADSIDE DRUG TESTING DEVICES MARKET, BY END USER, 2021-2031 (REVENUE, $MILLION)
    TABLE 35. EUROPE ROADSIDE DRUG TESTING DEVICES MARKET, BY COUNTRY, 2021-2031 (REVENUE, $MILLION)
    TABLE 36. GERMANY ROADSIDE DRUG TESTING DEVICES MARKET, BY SAMPLE TYPE, 2021-2031 (REVENUE, $MILLION)
    TABLE 37. GERMANY ROADSIDE DRUG TESTING DEVICES MARKET, BY SUBSTANCE, 2021-2031 (REVENUE, $MILLION)
    TABLE 38. GERMANY ROADSIDE DRUG TESTING DEVICES MARKET, BY END USER, 2021-2031 (REVENUE, $MILLION)
    TABLE 39. FRANCE ROADSIDE DRUG TESTING DEVICES MARKET, BY SAMPLE TYPE, 2021-2031 (REVENUE, $MILLION)
    TABLE 40. FRANCE ROADSIDE DRUG TESTING DEVICES MARKET, BY SUBSTANCE, 2021-2031 (REVENUE, $MILLION)
    TABLE 41. FRANCE ROADSIDE DRUG TESTING DEVICES MARKET, BY END USER, 2021-2031 (REVENUE, $MILLION)
    TABLE 42. UK ROADSIDE DRUG TESTING DEVICES MARKET, BY SAMPLE TYPE, 2021-2031 (REVENUE, $MILLION)
    TABLE 43. UK ROADSIDE DRUG TESTING DEVICES MARKET, BY SUBSTANCE, 2021-2031 (REVENUE, $MILLION)
    TABLE 44. UK ROADSIDE DRUG TESTING DEVICES MARKET, BY END USER, 2021-2031 (REVENUE, $MILLION)
    TABLE 45. ITALY ROADSIDE DRUG TESTING DEVICES MARKET, BY SAMPLE TYPE, 2021-2031 (REVENUE, $MILLION)
    TABLE 46. ITALY ROADSIDE DRUG TESTING DEVICES MARKET, BY SUBSTANCE, 2021-2031 (REVENUE, $MILLION)
    TABLE 47. ITALY ROADSIDE DRUG TESTING DEVICES MARKET, BY END USER, 2021-2031 (REVENUE, $MILLION)
    TABLE 48. SPAIN ROADSIDE DRUG TESTING DEVICES MARKET, BY SAMPLE TYPE, 2021-2031 (REVENUE, $MILLION)
    TABLE 49. SPAIN ROADSIDE DRUG TESTING DEVICES MARKET, BY SUBSTANCE, 2021-2031 (REVENUE, $MILLION)
    TABLE 50. SPAIN ROADSIDE DRUG TESTING DEVICES MARKET, BY END USER, 2021-2031 (REVENUE, $MILLION)
    TABLE 51. REST OF EUROPE ROADSIDE DRUG TESTING DEVICES MARKET, BY SAMPLE TYPE, 2021-2031 (REVENUE, $MILLION)
    TABLE 52. REST OF EUROPE ROADSIDE DRUG TESTING DEVICES MARKET, BY SUBSTANCE, 2021-2031 (REVENUE, $MILLION)
    TABLE 53. REST OF EUROPE ROADSIDE DRUG TESTING DEVICES MARKET, BY END USER, 2021-2031 (REVENUE, $MILLION)
    TABLE 54. ASIA-PACIFIC ROADSIDE DRUG TESTING DEVICES MARKET, BY SAMPLE TYPE, 2021-2031 (REVENUE, $MILLION)
    TABLE 55. ASIA-PACIFIC ROADSIDE DRUG TESTING DEVICES MARKET, BY SUBSTANCE, 2021-2031 (REVENUE, $MILLION)
    TABLE 56. ASIA-PACIFIC ROADSIDE DRUG TESTING DEVICES MARKET, BY END USER, 2021-2031 (REVENUE, $MILLION)
    TABLE 57. ASIA-PACIFIC ROADSIDE DRUG TESTING DEVICES MARKET, BY COUNTRY, 2021-2031 (REVENUE, $MILLION)
    TABLE 58. JAPAN ROADSIDE DRUG TESTING DEVICES MARKET, BY SAMPLE TYPE, 2021-2031 (REVENUE, $MILLION)
    TABLE 59. JAPAN ROADSIDE DRUG TESTING DEVICES MARKET, BY SUBSTANCE, 2021-2031 (REVENUE, $MILLION)
    TABLE 60. JAPAN ROADSIDE DRUG TESTING DEVICES MARKET, BY END USER, 2021-2031 (REVENUE, $MILLION)
    TABLE 61. CHINA ROADSIDE DRUG TESTING DEVICES MARKET, BY SAMPLE TYPE, 2021-2031 (REVENUE, $MILLION)
    TABLE 62. CHINA ROADSIDE DRUG TESTING DEVICES MARKET, BY SUBSTANCE, 2021-2031 (REVENUE, $MILLION)
    TABLE 63. CHINA ROADSIDE DRUG TESTING DEVICES MARKET, BY END USER, 2021-2031 (REVENUE, $MILLION)
    TABLE 64. AUSTRALIA ROADSIDE DRUG TESTING DEVICES MARKET, BY SAMPLE TYPE, 2021-2031 (REVENUE, $MILLION)
    TABLE 65. AUSTRALIA ROADSIDE DRUG TESTING DEVICES MARKET, BY SUBSTANCE, 2021-2031 (REVENUE, $MILLION)
    TABLE 66. AUSTRALIA ROADSIDE DRUG TESTING DEVICES MARKET, BY END USER, 2021-2031 (REVENUE, $MILLION)
    TABLE 67. INDIA ROADSIDE DRUG TESTING DEVICES MARKET, BY SAMPLE TYPE, 2021-2031 (REVENUE, $MILLION)
    TABLE 68. INDIA ROADSIDE DRUG TESTING DEVICES MARKET, BY SUBSTANCE, 2021-2031 (REVENUE, $MILLION)
    TABLE 69. INDIA ROADSIDE DRUG TESTING DEVICES MARKET, BY END USER, 2021-2031 (REVENUE, $MILLION)
    TABLE 70. SOUTH KOREA ROADSIDE DRUG TESTING DEVICES MARKET, BY SAMPLE TYPE, 2021-2031 (REVENUE, $MILLION)
    TABLE 71. SOUTH KOREA ROADSIDE DRUG TESTING DEVICES MARKET, BY SUBSTANCE, 2021-2031 (REVENUE, $MILLION)
    TABLE 72. SOUTH KOREA ROADSIDE DRUG TESTING DEVICES MARKET, BY END USER, 2021-2031 (REVENUE, $MILLION)
    TABLE 73. REST OF ASIA-PACIFIC ROADSIDE DRUG TESTING DEVICES MARKET, BY SAMPLE TYPE, 2021-2031 (REVENUE, $MILLION)
    TABLE 74. REST OF ASIA-PACIFIC ROADSIDE DRUG TESTING DEVICES MARKET, BY SUBSTANCE, 2021-2031 (REVENUE, $MILLION)
    TABLE 75. REST OF ASIA-PACIFIC ROADSIDE DRUG TESTING DEVICES MARKET, BY END USER, 2021-2031 (REVENUE, $MILLION)
    TABLE 76. LAMEA ROADSIDE DRUG TESTING DEVICES MARKET, BY SAMPLE TYPE, 2021-2031 (REVENUE, $MILLION)
    TABLE 77. LAMEA ROADSIDE DRUG TESTING DEVICES MARKET, BY SUBSTANCE, 2021-2031 (REVENUE, $MILLION)
    TABLE 78. LAMEA ROADSIDE DRUG TESTING DEVICES MARKET, BY END USER, 2021-2031 (REVENUE, $MILLION)
    TABLE 79. LAMEA ROADSIDE DRUG TESTING DEVICES MARKET, BY COUNTRY, 2021-2031 (REVENUE, $MILLION)
    TABLE 80. BRAZIL ROADSIDE DRUG TESTING DEVICES MARKET, BY SAMPLE TYPE, 2021-2031 (REVENUE, $MILLION)
    TABLE 81. BRAZIL ROADSIDE DRUG TESTING DEVICES MARKET, BY SUBSTANCE, 2021-2031 (REVENUE, $MILLION)
    TABLE 82. BRAZIL ROADSIDE DRUG TESTING DEVICES MARKET, BY END USER, 2021-2031 (REVENUE, $MILLION)
    TABLE 83. SAUDI ARABIA ROADSIDE DRUG TESTING DEVICES MARKET, BY SAMPLE TYPE, 2021-2031 (REVENUE, $MILLION)
    TABLE 84. SAUDI ARABIA ROADSIDE DRUG TESTING DEVICES MARKET, BY SUBSTANCE, 2021-2031 (REVENUE, $MILLION)
    TABLE 85. SAUDI ARABIA ROADSIDE DRUG TESTING DEVICES MARKET, BY END USER, 2021-2031 (REVENUE, $MILLION)
    TABLE 86. SOUTH AFRICA ROADSIDE DRUG TESTING DEVICES MARKET, BY SAMPLE TYPE, 2021-2031 (REVENUE, $MILLION)
    TABLE 87. SOUTH AFRICA ROADSIDE DRUG TESTING DEVICES MARKET, BY SUBSTANCE, 2021-2031 (REVENUE, $MILLION)
    TABLE 88. SOUTH AFRICA ROADSIDE DRUG TESTING DEVICES MARKET, BY END USER, 2021-2031 (REVENUE, $MILLION)
    TABLE 89. REST OF LAMEA ROADSIDE DRUG TESTING DEVICES MARKET, BY SAMPLE TYPE, 2021-2031 (REVENUE, $MILLION)
    TABLE 90. REST OF LAMEA ROADSIDE DRUG TESTING DEVICES MARKET, BY SUBSTANCE, 2021-2031 (REVENUE, $MILLION)
    TABLE 91. REST OF LAMEA ROADSIDE DRUG TESTING DEVICES MARKET, BY END USER, 2021-2031 (REVENUE, $MILLION)
    TABLE 92.ABBOTT LABORATORIES: COMPANY SNAPSHOT
    TABLE 93.ABBOTT LABORATORIES: OPERATING SEGMENTS
    TABLE 94.ABBOTT LABORATORIES: PRODUCT PORTFOLIO
    TABLE 95.ABBOTT LABORATORIES: NET SALES
    TABLE 96.ABBOTT LABORATORIES: KEY STRATERGIES
    TABLE 97.AK GLOBALTECH CORPORATION: COMPANY SNAPSHOT
    TABLE 98.AK GLOBALTECH CORPORATION: OPERATING SEGMENTS
    TABLE 99.AK GLOBALTECH CORPORATION: PRODUCT PORTFOLIO
    TABLE 100.AK GLOBALTECH CORPORATION: NET SALES
    TABLE 101.AK GLOBALTECH CORPORATION: KEY STRATERGIES
    TABLE 102.ALCOHOL COUNTERMEASURE SYSTEMS CORP.: COMPANY SNAPSHOT
    TABLE 103.ALCOHOL COUNTERMEASURE SYSTEMS CORP.: OPERATING SEGMENTS
    TABLE 104.ALCOHOL COUNTERMEASURE SYSTEMS CORP.: PRODUCT PORTFOLIO
    TABLE 105.ALCOHOL COUNTERMEASURE SYSTEMS CORP.: NET SALES
    TABLE 106.ALCOHOL COUNTERMEASURE SYSTEMS CORP.: KEY STRATERGIES
    TABLE 107.CANNABIX TECHNOLOGIES INC.: COMPANY SNAPSHOT
    TABLE 108.CANNABIX TECHNOLOGIES INC.: OPERATING SEGMENTS
    TABLE 109.CANNABIX TECHNOLOGIES INC.: PRODUCT PORTFOLIO
    TABLE 110.CANNABIX TECHNOLOGIES INC.: NET SALES
    TABLE 111.CANNABIX TECHNOLOGIES INC.: KEY STRATERGIES
    TABLE 112.DRÄGER: COMPANY SNAPSHOT
    TABLE 113.DRÄGER: OPERATING SEGMENTS
    TABLE 114.DRÄGER: PRODUCT PORTFOLIO
    TABLE 115.DRÄGER: NET SALES
    TABLE 116.DRÄGER: KEY STRATERGIES
    TABLE 117.INTELLIGENT FINGERPRINTING: COMPANY SNAPSHOT
    TABLE 118.INTELLIGENT FINGERPRINTING: OPERATING SEGMENTS
    TABLE 119.INTELLIGENT FINGERPRINTING: PRODUCT PORTFOLIO
    TABLE 120.INTELLIGENT FINGERPRINTING: NET SALES
    TABLE 121.INTELLIGENT FINGERPRINTING: KEY STRATERGIES
    TABLE 122.LIFELOC TECHNOLOGIES, INC.: COMPANY SNAPSHOT
    TABLE 123.LIFELOC TECHNOLOGIES, INC.: OPERATING SEGMENTS
    TABLE 124.LIFELOC TECHNOLOGIES, INC.: PRODUCT PORTFOLIO
    TABLE 125.LIFELOC TECHNOLOGIES, INC.: NET SALES
    TABLE 126.LIFELOC TECHNOLOGIES, INC.: KEY STRATERGIES
    TABLE 127.ORANOXIS INC.: COMPANY SNAPSHOT
    TABLE 128.ORANOXIS INC.: OPERATING SEGMENTS
    TABLE 129.ORANOXIS INC.: PRODUCT PORTFOLIO
    TABLE 130.ORANOXIS INC.: NET SALES
    TABLE 131.ORANOXIS INC.: KEY STRATERGIES
    TABLE 132.THERMO FISHER SCIENTIFIC, INC.: COMPANY SNAPSHOT
    TABLE 133.THERMO FISHER SCIENTIFIC, INC.: OPERATING SEGMENTS
    TABLE 134.THERMO FISHER SCIENTIFIC, INC.: PRODUCT PORTFOLIO
    TABLE 135.THERMO FISHER SCIENTIFIC, INC.: NET SALES
    TABLE 136.THERMO FISHER SCIENTIFIC, INC.: KEY STRATERGIES
    TABLE 137.URITOX LLC.: COMPANY SNAPSHOT
    TABLE 138.URITOX LLC.: OPERATING SEGMENTS
    TABLE 139.URITOX LLC.: PRODUCT PORTFOLIO
    TABLE 140.URITOX LLC.: NET SALES
    TABLE 141.URITOX LLC.: KEY STRATERGIES
  • LIST OF FIGURES

  • FIGURE 1.ROADSIDE DRUG TESTING DEVICES MARKET SEGMENTATION
    FIGURE 2.ROADSIDE DRUG TESTING DEVICES MARKET,2021-2031
    FIGURE 3.ROADSIDE DRUG TESTING DEVICES MARKET,2021-2031
    FIGURE 4. TOP INVESTMENT POCKETS, BY REGION
    FIGURE 5.PORTER FIVE-1
    FIGURE 6.PORTER FIVE-2
    FIGURE 7.PORTER FIVE-3
    FIGURE 8.PORTER FIVE-4
    FIGURE 9.PORTER FIVE-5
    FIGURE 10.TOP PLAYER POSITIONING
    FIGURE 11.ROADSIDE DRUG TESTING DEVICES MARKET:DRIVERS, RESTRAINTS AND OPPORTUNITIES
    FIGURE 12.ROADSIDE DRUG TESTING DEVICES MARKET,BY SAMPLE TYPE,2021(%)
    FIGURE 13.COMPARATIVE SHARE ANALYSIS OF SALIVA ROADSIDE DRUG TESTING DEVICES MARKET,2021-2031(%)
    FIGURE 14.COMPARATIVE SHARE ANALYSIS OF BREATH ROADSIDE DRUG TESTING DEVICES MARKET,2021-2031(%)
    FIGURE 15.COMPARATIVE SHARE ANALYSIS OF OTHERS ROADSIDE DRUG TESTING DEVICES MARKET,2021-2031(%)
    FIGURE 16.ROADSIDE DRUG TESTING DEVICES MARKET,BY SUBSTANCE,2021(%)
    FIGURE 17.COMPARATIVE SHARE ANALYSIS OF DRUGS ROADSIDE DRUG TESTING DEVICES MARKET,2021-2031(%)
    FIGURE 18.COMPARATIVE SHARE ANALYSIS OF ALCOHOL ROADSIDE DRUG TESTING DEVICES MARKET,2021-2031(%)
    FIGURE 19.ROADSIDE DRUG TESTING DEVICES MARKET,BY END USER,2021(%)
    FIGURE 20.COMPARATIVE SHARE ANALYSIS OF HIGHWAY POLICE ROADSIDE DRUG TESTING DEVICES MARKET,2021-2031(%)
    FIGURE 21.COMPARATIVE SHARE ANALYSIS OF DRUG ENFORCEMENT AGENCIES ROADSIDE DRUG TESTING DEVICES MARKET,2021-2031(%)
    FIGURE 22.ROADSIDE DRUG TESTING DEVICES MARKET BY REGION,2021
    FIGURE 23.U.S. ROADSIDE DRUG TESTING DEVICES MARKET,2021-2031($MILLION)
    FIGURE 24.CANADA ROADSIDE DRUG TESTING DEVICES MARKET,2021-2031($MILLION)
    FIGURE 25.MEXICO ROADSIDE DRUG TESTING DEVICES MARKET,2021-2031($MILLION)
    FIGURE 26.GERMANY ROADSIDE DRUG TESTING DEVICES MARKET,2021-2031($MILLION)
    FIGURE 27.FRANCE ROADSIDE DRUG TESTING DEVICES MARKET,2021-2031($MILLION)
    FIGURE 28.UK ROADSIDE DRUG TESTING DEVICES MARKET,2021-2031($MILLION)
    FIGURE 29.ITALY ROADSIDE DRUG TESTING DEVICES MARKET,2021-2031($MILLION)
    FIGURE 30.SPAIN ROADSIDE DRUG TESTING DEVICES MARKET,2021-2031($MILLION)
    FIGURE 31.REST OF EUROPE ROADSIDE DRUG TESTING DEVICES MARKET,2021-2031($MILLION)
    FIGURE 32.JAPAN ROADSIDE DRUG TESTING DEVICES MARKET,2021-2031($MILLION)
    FIGURE 33.CHINA ROADSIDE DRUG TESTING DEVICES MARKET,2021-2031($MILLION)
    FIGURE 34.AUSTRALIA ROADSIDE DRUG TESTING DEVICES MARKET,2021-2031($MILLION)
    FIGURE 35.INDIA ROADSIDE DRUG TESTING DEVICES MARKET,2021-2031($MILLION)
    FIGURE 36.SOUTH KOREA ROADSIDE DRUG TESTING DEVICES MARKET,2021-2031($MILLION)
    FIGURE 37.REST OF ASIA-PACIFIC ROADSIDE DRUG TESTING DEVICES MARKET,2021-2031($MILLION)
    FIGURE 38.BRAZIL ROADSIDE DRUG TESTING DEVICES MARKET,2021-2031($MILLION)
    FIGURE 39.SAUDI ARABIA ROADSIDE DRUG TESTING DEVICES MARKET,2021-2031($MILLION)
    FIGURE 40.SOUTH AFRICA ROADSIDE DRUG TESTING DEVICES MARKET,2021-2031($MILLION)
    FIGURE 41.REST OF LAMEA ROADSIDE DRUG TESTING DEVICES MARKET,2021-2031($MILLION)
    FIGURE 42. TOP WINNING STRATEGIES, BY YEAR
    FIGURE 43. TOP WINNING STRATEGIES, BY DEVELOPMENT
    FIGURE 44. TOP WINNING STRATEGIES, BY COMPANY
    FIGURE 45.PRODUCT MAPPING OF TOP 10 PLAYERS
    FIGURE 46.COMPETITIVE DASHBOARD
    FIGURE 47.COMPETITIVE HEATMAP OF TOP 10 KEY PLAYERS
    FIGURE 48.ABBOTT LABORATORIES.: NET SALES ($MILLION)
    FIGURE 49.AK GLOBALTECH CORPORATION.: NET SALES ($MILLION)
    FIGURE 50.ALCOHOL COUNTERMEASURE SYSTEMS CORP..: NET SALES ($MILLION)
    FIGURE 51.CANNABIX TECHNOLOGIES INC..: NET SALES ($MILLION)
    FIGURE 52.DRÄGER.: NET SALES ($MILLION)
    FIGURE 53.INTELLIGENT FINGERPRINTING.: NET SALES ($MILLION)
    FIGURE 54.LIFELOC TECHNOLOGIES, INC..: NET SALES ($MILLION)
    FIGURE 55.ORANOXIS INC..: NET SALES ($MILLION)
    FIGURE 56.THERMO FISHER SCIENTIFIC, INC..: NET SALES ($MILLION)
    FIGURE 57.URITOX LLC..: NET SALES ($MILLION)


This section provides the opinions of the top level CXOs on the roadside drug testing devices market. Roadside drug testing is a process of screening of traces of illegal drugs or alcohol by using sample such as blood, saliva, sweat, or by allowing the subject to exhale into the portable breathalyzer. The exhaled gas inside the breathalyzer is screened by the technique of gas chromatography and mass spectrometry. 

The roadside drug testing devices include devices where samples such as blood, saliva, sweat, and breath are used. The breathalyzers are devices which analyzes exhaled breath of the subjects. Driving while intoxicated (DWI), sometimes known as driving under the influence (DUI), is when a person operates a vehicle while having a blood alcohol content (BAC) level of at least 0.08%. Overconsumption of alcohol slows down the driver's respiration rate and reaction time. Moreover, rise in the number of alcohol consumers further boosts the growth of the market.  

North America is expected to witness the highest growth in terms of revenue, owing to rise in the prevalence of roadside accidents and presence of key players that manufacture & develop roadside drug testing devices. However, inaccurate results from roadside drug testing can hamper the market growth.

PURCHASE OPTIONS

Call or Email us

U.S.-Canada Toll-free: +1-800-792-5285
Int'l : +1-503-894-6022
Europe : +44-845-528-1300
Email : help@alliedmarketresearch.com
 
FREQUENTLY ASKED QUESTIONS?

A. Increase in consumption of drink and drive all over the globe, propel the growth of the roadside drug testing devices market.

A. Drug detection is the leading application of Roadside Drug Testing Devices Market.

A. North America is the largest regional market for Roadside Drug Testing Devices.

A. The global roadside drug testing devices market is projected to reach $707.28 million by 2031, with a CAGR of 5.3% from 2022 to 2031.

A. Some of the major companies that operate in the market include Abbott Laboratories., AK GlobalTech Corporation, Alcohol Countermeasure Systems Corp., Cannabix Technologies, Dräger, Intelligent fingerprinting, Lifeloc Technologies, Inc., Oranoxis Inc., Thermo Fisher Scientific, Inc., and UriTox LLC.

A. The base year is 2021 in Roadside Drug Testing Devices market.

A. Yes, the Roadside Drug Testing Devices market report provides PORTER Analysis.

Looking for Customization?

 Customization Request

Have a Question?

 Speak with Analyst

Any Confusion?

 Inquire Before Buying

Have a glance of the Report

  Request Sample
RELATED TAGS

Purchase Full Report of
Roadside Drug Testing Devices Market

Start reading instantly.
This Report and over 68,418+ more Reports, Available with Avenue Library. T&C*.

  • Online Only
  • $3,570
  • Online cloud access only
  • Restricted print, copy, paste & download
  • Read only
  • Free industry update
    (Within 180 days)
  • Free report update in next update cycle
    (Nov 2023 - Nov 2024)
  • Data Pack
  • $3,840
  • Restricted to one authorized user
  • One print only
  • Available in
    Excel
  • Free industry update
    (Within 180 days)
  •   Free report update in next update cycle
    (Nov 2023 - Nov 2024)
  • Single User
  • $5,730
  • Restricted to one authorized user
  • One print only
  • Available in
    PDF
  • Free industry update
    (Within 180 days)
  •   Free report update in next update cycle
    (Nov 2023 - Nov 2024)
  • Five Users
  • $6,450
  • Limited to five authorized users
  • Print upto five copies
  • Available in
    PDF
  • Free industry update
    (Within 180 days)
  •   Free report update in next update cycle
    (Nov 2023 - Nov 2024)
  • Enterprise
    License/PDF

  • $9,600
  • Unlimited
    within
    company/enterprise
  • Available in Excel & PDF
  • Free industry update
    (Within 180 days)
  •   Free report update in next update cycle
    (Nov 2023 - Nov 2024)
  • Library
    Membership

  • $999 $ 1,175
    Per User/ Per month/ Billed annually
  • Published Content
    E-access
  • Company Profiles
    E-access
  • Newly Added Content Access
  • 10 PDF
    Downloads
  • 5 Excel Data
    Pack Downloads
  • 250 Company Profiles PDF Downloads
  • Buy Now

*Taxes/Fees, if applicable will be added during checkout. All prices in USD

RELATED REPORTS
 

Why Allied Market Research?


Infallible Methodology

To ensure high-level data integrity, accurate analysis, and impeccable forecasts

Analyst Support

For complete satisfaction

Customization

On-demand customization of scope of the report to exactly meet your needs

TARGETED MARKET VIEW

Targeted market view to provide pertinent information and save time of readers

Get fresh content delivered

Get insights on topics that are crucial for your business. Stay abreast of your interest areas.

Get Industry Data Alerts

Why Allied Market Research?

Infallible Methodology

To ensure high-level data integrity, accurate analysis, and impeccable forecasts

Analyst Support

For complete satisfaction

Customization

On-demand customization of scope of the report to exactly meet your needs

TARGETED MARKET VIEW

Targeted market view to provide pertinent information and save time of readers