
Sales Tax Software Market Research, 2033
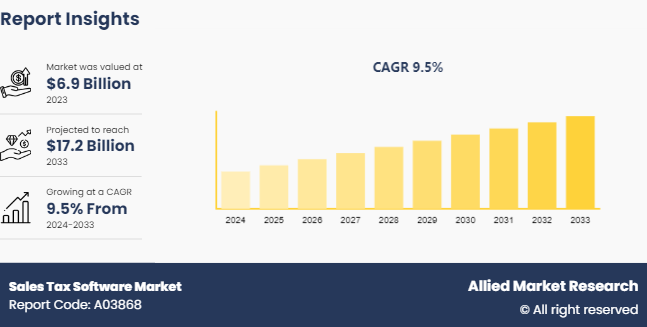
The global sales tax software market size was valued at $6.9 billion in 2023, and is projected to reach $17.2 billion by 2033, growing at a CAGR of 9.5% from 2024 to 2033. Sales tax software is a specialized tool designed to automate the calculation, reporting, and compliance of sales tax obligations for businesses.
Market Introduction and Definition
Sales tax software is a tool that simplifies, automates, and integrates the sales tax calculation, management, and reporting processes for businesses. It offers solutions such as consumer use tax management, value-added tax, tax return filing, and integration with financial databases.
Key features and benefits of sales tax software include automation of tax calculation, reporting, and filing processes using AI and machine learning algorithms, cloud-based solutions for enhanced flexibility and accessibility, user-friendly interfaces to enable easy navigation of complex tax regulations, integration with ERP and accounting systems, advanced reporting and analytics capabilities, compliance with global tax regulations, and enhanced security and data privacy measures.
Key Takeaways
The sales tax software market share study covers 20 countries. The research includes a segment analysis of each country in terms of value for the projected period 2024-2033.
More than 1,500 product literatures, industry releases, annual reports, and other such documents of major sales tax software industry participants along with authentic industry journals, trade associations' releases, and government websites have been reviewed for generating high-value industry insights.
The study integrated high-quality data, professional opinions and analysis, and critical independent perspectives. The research approach is intended to provide a balanced view of global markets and to assist stakeholders in making educated decisions in order to achieve their most ambitious growth objectives.
Key market dynamics
The sales tax software market is gaining traction due to the shift towards automation and integration, driven by rise in demand for streamlined tax processes and availability of cloud-based solutions at competitive prices. These factors are fostering growth in the market, with focus on simplifying tax calculations, management, and reporting through advanced software solutions such as consumer use tax management and tax filing. Moreover, the market is witnessing rise in demand for IoT devices, further driving growth during sales tax software market forecast period.
However, challenges such as substantial initial investments and the need for specialized skill sets are expected to potentially hinder the sales tax software market growth. On the contrary, growing emphasis on regional integration and harmonization of tax legislation, with rise in demand for accessible and cost-effective platforms is expected to provide lucrative growth opportunities during the sales tax software market forecast period.
Consumer Trends in Global Sales Tax Software Market
Rise in demand for automation in tax compliance processes, driven by integration of AI and machine learning algorithms in advanced software solutions is the latest consumer trend in the global sales tax software market. This automation revolutionizes tax calculation, reporting, and filing processes, enabling businesses to reduce errors, ensure compliance with evolving regulations, and optimize resource allocation. In addition, the market is witnessing a shift towards cloud-based solutions for enhanced flexibility, providing real-time updates, seamless integration with existing systems, and accessibility from anywhere. This trend caters to the need for agility in adapting to changing compliance requirements and market conditions, reflecting a consumer preference for scalable and adaptable tax compliance solutions. Furthermore, there is a growing focus on user-friendly interfaces in sales tax software, emphasizing intuitive design to minimize the learning curve for users and enable them to navigate complex tax regulations with ease. This emphasis on usability enhances productivity and reduces the likelihood of errors, aligning with consumer preferences for software solutions that are easy to use and efficient.
Market Segmentation
The sales tax software market is segmented into solution, deployment mode, industry vertical, and region. On the basis of solution, the market is divided into consumer use tax management, tax filings, and others. On the basis of deployment mode, the market is bifurcated into on-premises and cloud. On the basis of industry vertical, the market is categorized into BFSI, transportation, retail, IT and telecom, healthcare, and others. Region-wise, the market is analyzed across North America, Europe, Asia-Pacific, Latin America, and Middle East & Africa.
Regional/Country Market Outlook
In the U.S., top sales tax software is playing an important role in driving the adoption of sales tax software market size in various industries. For instance, in September 2023, in the U.S., Ryan, a leading global tax services and software provider, acquired the sales and use tax recovery services and audit defense business line from Avalara, a leading provider of tax compliance automation software for businesses of all sizes.
In Europe, the sales tax software market is driven by strict VAT laws and increasing cross-border transactions. The growing emphasis on multicurrency solutions to cater to businesses operating across different countries in the Europe, a focus on real-time tax computation for accurate compliance, and a rising integration of sales tax software with ERP and accounting systems is gaining traction. For instance, in April 2023, Taxually, one of the leading European cloud-native VAT software providers, announced that Califonia-based LumaTax joined their family of Enterprise-grade automated tax software solutions. This acquisition enables Taxually to accelerate growth globally across both Enterprise and E-commerce segments and to further expand its leading indirect tax product suite.
Business owners in the U.S. prefer free and unlimited federal and state e-filing solutions, while also showing rise in interest in data and document management features to simplify tax audits. Automation of end-to-end indirect tax processes is becoming more prevalent, and companies are enhancing their software with proprietary content databases to ensure compliance. For instance, in May 2021, LumaTax landed $4 million in new funding led by Trilogy Equity Partners. The 4-year-old startup that spun out of Seattle’s Pioneer Square Labs initially targeted small businesses to automate their sales tax reporting process. But over the past year, the 14-person company has landed dozens of top CPA firms as customers.
Industry Trends
In the e-commerce industry, e-commerce sales tax software has become an indispensable tool. It is designed to simplify the process of calculating and managing sales taxes for online transactions. The complexity arises from the need to comply with various local tax obligations, which can differ significantly from one jurisdiction to another. The local tax obligation complexity is compounded when users consider the frequency of changes in tax laws and rates, as well as the different rules for various types of products and services. For instance, Avalara designs its eCommerce sales tax software to enable the U.S. businesses to manage the demanding tax obligations imposed by the state efficiently and accurately or manage requirements by other local tax authorities.
Sales tax compliance is a constantly evolving challenge for businesses, with technology and regulations changing the business landscape at a rapid pace. In February 2024, NXTPOWER’s partnership with Sales Tax DataLINK streamlined its compliance processes, overcoming the hurdles of varying sales tax rates and jurisdictions.
Competitive Landscape
The major players operating in the sales tax software market include APEX Analytix, LLC, Avalara Inc., Intuit Inc., LumaTax, Inc., Ryan, LLC, Sage Intacct, Inc., Sales Tax DataLINK, Sovos Compliance, LLC, Thomson Reuters, and Vertex, Inc. Other players in the sales tax software market include Wolters Kluwer, CFS Tax Software Inc., Xero Limited, and others.
Recent Key Strategies and Developments in Sales Tax Software Industry
In May 2024, Avalara, Inc., a leading provider of cloud-based tax compliance automation for businesses of all sizes, expanded its partnership with Shopify Inc., a provider of essential internet infrastructure for commerce, by joining the Shopify Tax Platform. Through the expanded partnership, Shopify merchants of any size can easily manage and automate global tax compliance with Avalara.
In May 2023, CereTax, the intelligent sales tax solution, launched its new user interface, designed to simplify the sales tax automation process for businesses of all sizes. The new portal, which is part of CereTax's cloud-based tax automation platform, allows users to easily manage and automate their sales tax processes, including tax calculation, robust rules, and in-depth reporting. The interface was built with simplicity and ease of use in mind, allowing businesses to operate efficiently and without interruption.
Key Sources Referred
Internal Revenue Service
Sales Tax Institute
Government Accountability Office
International Tax Authorities
CIO Magazine
The Wall Street Journal
International Journal of Tax Administration
Journal of Accountancy
Key Benefits for Stakeholders
- This report provides a quantitative analysis of the market segments, current trends, estimations, and dynamics of the sales tax software market analysis from 2024 to 2033 to identify the prevailing sales tax software market opportunities.
- The market research is offered along with information related to key drivers, restraints, and opportunities.
- Porter's five forces analysis highlights the potency of buyers and suppliers to enable stakeholders make profit-oriented business decisions and strengthen their supplier-buyer network.
- In-depth analysis of the sales tax software market segmentation assists to determine the prevailing market opportunities.
- Major countries in each region are mapped according to their revenue contribution to the global market.
- Market player positioning facilitates benchmarking and provides a clear understanding of the present position of the market players.
- The report includes the analysis of the regional as well as global sales tax software market trends, key players, market segments, application areas, and market growth strategies.
Sales Tax Software Market Report Highlights
| Aspects | Details |
| Market Size By 2033 | USD 17.2 Billion |
| Growth Rate | CAGR of 9.5% |
| Forecast period | 2024 - 2033 |
| Report Pages | 254 |
| By Solution |
|
| By Deployment Mode |
|
| By Industry Vertical |
|
| By Region |
|
| Key Market Players | Xero Limited, Wolters Kluwer, LumaTax, Inc., Vertex, Inc., Thomson Reuters, Sales Tax DataLINK, Avalara Inc., Sovos Compliance, LLC, Sage Intacct, Inc., Ryan, LLC, CFS Tax Software Inc., APEX Analytix, LLC, Intuit Inc. |
Sales tax software is a tool designed to automate the calculation, reporting, and compliance of sales tax obligations, integrating with accounting systems to streamline the management of sales tax.
The total market value of the sales tax software market is $6.9 billion in 2023.
The market value of the sales tax software market in 2033 will be $17.2 billion.
The forecast period for sales tax software market is 2024 to 2033.
The base year is 2023 in sales tax software market.
Loading Table Of Content...

