
Satellite Data Services Market Summary
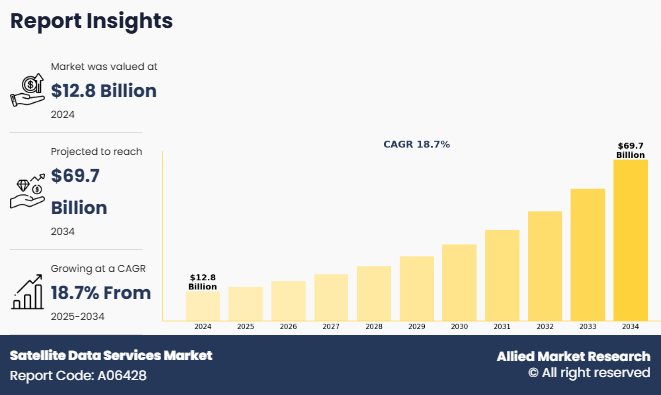
The global satellite data services market size was valued at $12.8 billion in 2024, and is projected to reach $ 69.7 billion by 2034, growing at a CAGR of 18.7% from 2025 to 2034.
Key Market Trends and Insights
Region wise, North America generated the highest revenue in 2024.
The global satellite data services market share was dominated by the environmental segment in 2024 and is expected to maintain its dominance in the upcoming years
The government and military segment is expected to witness the highest growth during the forecast
Market Size & Forecast
- 2024 Market Size: USD 12.8 Billion
- 2034 Projected Market Size: USD 69.7 Billion
- Compound Annual Growth Rate (CAGR) (2025-2034): 18.7%
- North America: Generated the highest revenue in 2024
Key Takeaways
- On the basis of vertical, the environmental segment held the largest share in the satellite data services market in 2024.
- By service, the image data segment was the major shareholder in 2024.
- By end use, the government and military segment dominated the market, in terms of share, in 2024.
- Region wise, North America region held the largest market share in 2024.
Satellite data service is the process of collecting information about the Earth, gathered by manmade satellites in their orbits. Satellites deliver information about surface and weather changes on the planet. Satellite data services deal with capturing images of Earth or other planets with the assistance of imaging satellites. Utilizing these images for commercial purposes is known as commercial satellite imaging, which includes various applications such as environment monitoring & management, security of energy resources, surveillance of border areas, and mapping of construction projects.
In addition, earth imagery is vital in various applications, including infrastructure planning & construction, exploitation of new energy sources, disaster management, green mapping, traffic management, and topographical mapping. The most common use for satellite data is in Earth Observation (EO). Moreover, satellite data is widely used in the development of smart cities and connected vehicles. Urban planners use this data to understand settlement trends and ensure efficient infrastructure management.
For instance, In August 2024, Azercosmos, Azerbaijan's space agency, partnered with the Civil Aviation Authority of Botswana to provide satellite data services maket through the Azerspace-1 telecommunications satellite. With this collaboration, Botswana is expected to receive satellite data via the satellite's African C-band coverage for the first time. The agreement aims to enhance Botswana's data capabilities, supporting various applications such as aviation management and communication services. Moreover, In September 2024, Planet Labs Germany GmbH signed a three-year contract with the German Space Agency at the German Aerospace Center (DLR) to provide Earth observation data products and services. This collaboration aims to support research and development initiatives by offering German researchers access to Planet's satellite data. The partnership builds upon a decade-long relationship, with DLR incorporating Planet's data into their research programs since 2009 through the RapidEye Science Archive.
Increase in government focus on development of the space exploration industry is driving the growth of the satellite data services market growth. Increased funding, supportive policies, and national space programs are driving demand for satellite-based insights in areas such as defense, climate monitoring, and infrastructure planning, fostering innovation and encouraging private sector participation in satellite data services industry. Furthermore, increase in demand for earth observation satellites, and rise in use of satellite data in disaster response and climate monitoring have driven the demand for satellite data services.
However, high initial costs of satellite deployment and maintenance are significantly hampering the growth of the satellite data services market share. Launching and operating satellites require substantial capital investment, which poses a major barrier for startups and smaller enterprises. These high costs also limit the frequency of satellite launches and updates, reducing access to up-to-date data. In developing regions, the financial constraints further restrict governments and organizations from leveraging satellite services. As a result, the expansion of satellite data applications across sectors such as agriculture, disaster management, and urban planning faces considerable challenges. Moreover, regulatory challenges related to data privacy and international usage are major factors that hamper the growth of the satellite data services market growth.
On the contrary, the integration of AI and machine learning in satellite data analytics presents a lucrative opportunity for the satellite data services. These technologies enhance the speed, accuracy, and depth of data interpretation, enabling real-time insights for applications like disaster response, crop monitoring, and urban planning. AI-driven automation also reduces manual processing, making satellite data more accessible and cost-effective. As demand grows for intelligent, actionable insights across industries, the adoption of AI-powered satellite analytics is expected to significantly boost satellite data services market potential and innovation.
Segment Review
The satellite data services market is segmented on the basis of vertical, service, end use, and region. On the basis of vertical, the satellite data services industry is divided into energy & power, defense & intelligence, engineering & infrastructure, environmental, agriculture, maritime, insurance, transportation & logistics and others. By service, it is bifurcated into data analytics and image data. On the basis of end use, it is categorized into commercial and government & military. Region wise, it is studied across North America, Europe, Asia-Pacific, and LAMEA.

By Vertical
On the basis of vertical, the environmental segment attained the highest satellite data services market share in 2024. This is driven by the rising global emphasis on climate monitoring, natural resource management, and disaster preparedness. Governments and environmental agencies increasingly rely on satellite data to track deforestation, monitor air and water quality, and assess the impact of climate change. The ability to obtain high-resolution, real-time insights from satellite imagery enables effective planning and policy-making. International agreements and sustainability goals have further boosted demand for satellite-based environmental monitoring, positioning this environmental as a critical area of application within the broader satellite data services industry.

By Service
On the basis of service, the image data segment acquired the highest market share in 2024 in the satellite data services market. This is due to its extensive application across various industries, including agriculture, defense, urban planning, and environmental monitoring. High-resolution satellite imagery enables precise analysis of land use, crop health, infrastructure development, and natural disasters. The growing demand for real-time and historical imagery to support decision-making and policy implementation has further driven the segment's growth. Advancements in imaging technologies, along with the increased launch of Earth observation satellites, have made image data more accessible and valuable, solidifying its dominant position in the market.

By Region
Region wise, North America emerged as the leading region in the satellite data services market size in 2024, securing the highest market share due to strong government initiatives, advanced technological infrastructure, and a robust space ecosystem. The presence of key players such as NASA, SpaceX, and Maxar Technologies has fueled innovation and frequent satellite launches. The region's increasing reliance on satellite data for defense, environmental monitoring, and commercial applications such as agriculture and telecommunications—has strengthened market demand. Ongoing investments in AI-based satellite analytics and public-private partnerships have further propelled North America’s dominance in the global satellite data services.
However, Asia-Pacific is projected to grow at the fastest rate in the satellite data services market forecast period, driven by increasing government investments in space programs, expanding commercial satellite deployments, and rising demand for Earth observation services. Countries such as China, India, and Japan are launching advanced satellites to support applications in agriculture, urban planning, disaster management, and defense.
The report focuses on growth prospects, restraints, and trends of the satellite data services market analysis. The study provides Porter’s five forces analysis to understand the impact of numerous factors, such as bargaining power of suppliers, competitive intensity of competitors, threat of new entrants, threat of substitutes, and bargaining power of buyers, on the satellite data services.
Competitive Analysis
The report analyses the profiles of key players operating in the satellite data services market such as Airbus S.A.S., East View Geospatial Inc., ImageSat International, L3Harris Technologies, Inc., Maxar Technologies, Planet Labs Inc., Satellite Imaging Corporation, SpecTIR LLC, Trimble Inc. and Ursa Space Systems Inc. These players have adopted various strategies to increase their market penetration and strengthen their position in the satellite data services.
Top Impacting Factors
Increase in Government Focus on Development of the Space Exploration Industry
The growing government focus on space exploration is significantly driving the demand for satellite data services across the globe. Many countries are prioritizing the expansion of their space programs, investing heavily in satellite technology to enhance national capabilities in defense, communication, environmental monitoring, and disaster management. Initiatives such as satellite constellations, Earth observation missions, and scientific research projects are generating vast volumes of data that require advanced satellite data services market for interpretation and application. For instance, in November 2024, Mitsubishi Electric Corporation, MUFG Bank, Ltd., Satellite Data Service Corporation, and GHGSat Inc. entered a partnership to utilize satellite data for visualizing greenhouse gas (GHG) emissions and absorption. This collaboration aims to develop a service that offers companies and local governments analyzing information on global GHG emissions, facilitating the monitoring and analysis of emission trends and specific observation points. Thus, the increase in government focus for the development of space exploration industry is anticipated to be the major driving factor for the growth of market.
In addition, public-private partnerships are being encouraged to support innovation, reduce costs, and expand satellite infrastructure. Government agencies are also increasingly using satellite data for policy-making, infrastructure planning, and resource management, recognizing its value in driving national development. As a result, the satellite data services is witnessing substantial growth, with rising opportunities for analytics, real-time monitoring, and decision-making support. This increased focus is helping shape a robust ecosystem that fosters technological advancement and long-term satellite data services market expansion.
Increase in Demand for Earth Observation Satellites
The rise in demand for Earth observation satellites is a major factor driving growth in the satellite data services market demand. These satellites capture detailed images and data about the Earth’s surface, atmosphere, and oceans, enabling valuable insights across multiple sectors such as agriculture, environmental monitoring, disaster management, urban planning, and defense. For instance, in September 2024, NASA awarded a contract to Pixxel, an Indian private spacecraft company specializing in hyperspectral imaging and Earth observation, as part of its $476 million Commercial SmallSat Data Acquisition Program On-Ramp1 Multiple Award. Pixxel is among the eight companies selected to provide Earth-observation data from commercial sources. This initiative aims to support NASA's research and application activities that contribute to enhancing life on Earth.
Moreover, as governments, businesses, and research organizations increasingly rely on accurate, real-time data for decision-making, the need for comprehensive satellite data services has surged. Advances in satellite technology, including higher resolution sensors and increased satellite launches, have expanded data availability and improved service quality. In addition, the growing adoption of remote sensing for climate change tracking, natural resource management, and infrastructure development is fueling demand for Earth observation data. This trend encourages continuous innovation in data analytics and storage solutions, further expanding the market potential for satellite data services globally.
Rise in Use of Satellite Data in Disaster Response and Climate Monitoring
The rise in use of satellite data in disaster response and climate monitoring is significantly driving the growth of the satellite data services market. Satellite data provides real-time, high-resolution imagery and environmental information that is crucial for predicting, tracking, and responding to natural disasters such as hurricanes, floods, wildfires, and earthquakes. Governments and humanitarian organizations rely on satellite data for early warning systems, rapid damage assessment, and efficient resource deployment during emergencies. For instance, in March 2025, Juvare partnered with ICEYE to enhance disaster response capabilities by leveraging real-time satellite-driven solutions, integrating satellite data services to improve situational awareness and emergency decision-making. In addition, satellite-based monitoring plays a vital role in tracking climate change indicators like glacier retreat, sea level rise, greenhouse gas emissions, and deforestation. This helps policymakers and researchers develop effective strategies for mitigation and adaptation. With the growing frequency and severity of natural disasters and increasing global concern over climate change, demand for accurate, continuous, and timely satellite data is on the rise. As a result, the market is expanding rapidly, offering essential support for environmental resilience and disaster management.
High Initial Costs of Satellite Deployment and Maintenance
High initial costs associated with satellite deployment and maintenance are significantly hampering the growth of the satellite data services market. Building, launching, and operating satellites require substantial capital investment, often running into hundreds of millions of dollars. These costs include satellite manufacturing, launch services, ground infrastructure, and ongoing maintenance and monitoring. For many small and medium-sized enterprises, such high upfront expenses act as a major barrier to entry, limiting their participation in the market. In addition, the risks associated with satellite failure or delays in launch further deter investment. While technological advancements and reusable launch systems have helped reduce costs to some extent, affordability remains a challenge for widespread adoption. Moreover, the need for highly skilled personnel and sophisticated ground systems adds to operational costs. As a result, the high capital requirements can slow market growth by restricting innovation, limiting service expansion, and concentrating market power among a few large players with sufficient financial resources.
Regulatory Challenges Related to Data Privacy and International Usage
Regulatory challenges related to data privacy and international usage are increasingly hampering the demand for the satellite data services market trends. As satellite data becomes more detailed and widely accessible, concerns over the protection of sensitive information have grown. Governments and regulatory bodies across the world are imposing strict rules on how satellite data can be collected, shared, and used—particularly when it involves defense, national security, or surveillance applications. These regulations often differ by country, creating complex compliance requirements for global satellite data service providers. In addition, cross-border data sharing is subject to geopolitical tensions and legal restrictions, limiting market access and collaboration opportunities. Such fragmented and evolving regulatory landscapes increase the cost and complexity of operations for both established companies and new entrants. Consequently, these legal and compliance hurdles slow the pace of innovation, restrict data availability, and create uncertainty that can deter investment and limit the growth of the market.
Integration of AI and Machine Learning in Satellite Data Analytics
The integration of artificial intelligence (AI) and machine learning (ML) into satellite data analytics presents satellite data services market opportunities. For instance, in November 2022, Microsoft partnered with Planet to enhance climate adaptation efforts in Africa by integrating artificial intelligence (AI) with satellite data. This partnership supports Microsoft's AI for Good Labs' expansion into Nairobi, Kenya, and Cairo, Egypt, aiming to empower Africa-based data scientists with access to Planet's satellite imagery across the continent. Moreover, as AI and ML technologies enhance the ability to process and analyze vast volumes of satellite imagery and geospatial data with greater speed, accuracy, and efficiency. These advanced tools can automatically detect patterns, track environmental changes, predict natural disasters, and support real-time decision-making in sectors such as agriculture, defense, urban planning, and climate monitoring. AI-driven analytics reduce human error, improve response times, and enable users to extract actionable insights from complex datasets. In addition, the use of AI allows for the development of predictive models and automated workflows, expanding the applicability of satellite data across industries. As demand for real-time intelligence and precision-based services grows, the integration of AI and ML will play a critical role in transforming satellite data into smarter, more valuable solutions, driving innovation and expanding market potential.
Growing Demand for Satellite-based Connectivity in Remote Regions
The growing demand for satellite-based connectivity in remote and underserved regions presents a lucrative opportunity for the satellite data services market. Many areas across the globe, particularly in developing countries, lack access to reliable terrestrial communication infrastructure due to geographical challenges or economic constraints. Satellite services offer a viable solution by providing uninterrupted connectivity regardless of terrain, distance, or infrastructure limitations. This is especially valuable for remote education, telemedicine, disaster response, and agricultural monitoring. With increased focus on digital inclusion and global internet access, governments and private enterprises are investing heavily in satellite connectivity projects. In addition, emerging technologies such as low Earth orbit (LEO) satellite constellations promise faster, more affordable data transmission, further enhancing accessibility. As demand for real-time data and communication in isolated areas continues to rise, satellite data services are positioned to play a crucial role in bridging the digital divide, creating significant market growth potential across multiple sectors and regions.
Key Benefits for Stakeholders
- This report provides a quantitative analysis of the market segments, current trends, estimations, and dynamics of the market from 2024 to 2034 to identify the prevailing satellite data services market forecast.
- Market research is offered along with information related to key drivers, restraints, and opportunities.
- Porter's five forces analysis highlights the potency of buyers and suppliers to enable stakeholders to make profit-oriented business decisions and strengthen their supplier-buyer network.
- In-depth analysis of the satellite data services market segmentation assists to determine the prevailing market opportunities.
- Major countries in each region are mapped according to their revenue contribution to the global market.
- Market player positioning facilitates benchmarking and provides a clear understanding of the present position of the satellite data services market players.
- The report includes the analysis of the regional as well as global satellite data service market trends, key players, market segments, application areas, and market growth strategies.
Satellite Data Services Market Report Highlights
| Aspects | Details |
| Market Size By 2034 | USD 69.7 billion |
| Growth Rate | CAGR of 18.7% |
| Forecast period | 2024 - 2034 |
| Report Pages | 339 |
| By Vertical |
|
| By Service |
|
| By End Use |
|
| By Region |
|
| Key Market Players | Ursa Space Systems Inc., Satellite Imaging Corporation, L3Harris Technologies, Inc., AIRBUS, Planet Labs Inc., Maxar Technologies, East View Geospatial, SpecTIR, ISI (ImageSat International), Trimble Inc. |
The global satellite data services market size was valued at USD $12.8 billion in 2024, and is projected to reach USD 69.7 billion by 2034
The global satellite data services market is projected to grow at a compound annual growth rate of 18.7% from 2025-2034 to reach USD 69.7 billion by 2034
Airbus S.A.S., East View Geospatial Inc., ImageSat International, L3Harris Technologies, Inc., Maxar Technologies, Planet Labs Inc., Satellite Imaging Corporation, SpecTIR LLC, Trimble Inc. and Ursa Space Systems Inc.
North America is the largest regional market for Satellite Data Services
Increase in Government Focus on Development of the Space Exploration Industry, Increase in Demand for Earth Observation Satellites, Rise in Use of Satellite Data in Disaster Response and Climate Monitoring, Integration of AI and Machine Learning in Satellite Data Analytics, Growing Demand for Satellite-based Connectivity in Remote Regions majorly contribute toward the growth of the market.
Loading Table Of Content...
Loading Research Methodology...

