0
2023
Sciatica Treatment Market

Sciatica Treatment Market

by Type (Acute sciatica, Chronic sciatica, Others), by Drug class (Non-steroidal anti-inflammatory drugs, Steroids, Antidepressants, Others), by Distribution channel (Hospital pharmacies, Retail and specialty pharmacies, Online providers): Global Opportunity Analysis and Industry Forecast, 2021-2031

Report Code: A13379
Jan 2023 | Pages: 241
Tables: 132
Charts: 70
  • Formats*:

  • pdf

    Single User License, Five User
    License & Enterprise User License

  • xls

    Data Pack Excel License

  • ppt

    It comes with the additional cost
    of $2500.00 contact sales.


Sciatica Treatment Market Research, 2031

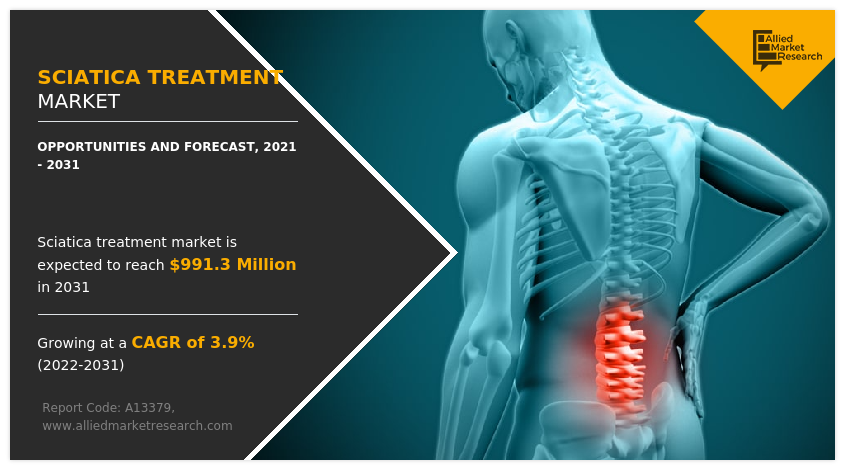
The global sciatica treatment market size was valued at $678 million in 2021, and is projected to reach $991.3 million by 2031, growing at a CAGR of 3.9% from 2022 to 2031. Sciatica is a condition characterized by pain that travels along the path of the sciatic nerve and leads to pain in the back, buttocks, and legs. The pain usually initiates in the lower spine, and travels through the hip and buttock and down the back of the leg to the foot. Symptoms of sciatica mainly includes the lower back pain, or tingling, numbness, or weakness in the leg. Although sciatica pain can be severe, most people find their symptoms improve with time. Sciatica can be caused due to age-related changes to the spine, obesity, occupations where one picks up heavy loads, prolonged sitting, and diabetes. Moreover, sciatica can also occur owing to the conditions such as osteoarthritis, spondylolisthesis, spinal stenosis and degenerative disk disease. It cannot be wholly treated, but the pain can be reduced using pain relieving medications such as NSAIDs, analgesics and others.

The sciatica treatment market was negatively impacted during the lockdown period owing to decrease in a patient visit to the hospitals and clinics for diagnosis and treatment of sciatica. Moreover, there was shift of focus in the healthcare sector towards COVID-19, which also negatively impacted the sciatica treatment market.

Sciatica Treatment Market

Market Dynamics

Factors that drive the growth of the sciatica treatment market include increase in incidence of chronic as well as acute sciatica, changes in human lifestyle, and increase in geriatric population. Moreover, increase in demand for over-the-counter analgesics for sciatica treatment, and increase in awareness among the population regarding treatment of sciatica are the factors that drive the growth of the acute sciatica segment. 

There is an increase in geriatric population around the globe which is one of the major driving factors for the growth of the sciatica treatment market. For instance, According to World Health Organization (WHO), between 2015 and 2050, the proportion of the world's population over 60 years will nearly double from 12% to 22%. As geriatric population is more prone to chronic backpain conditions including sciatica which usually occur due to aging, there is an increase in demand for sciatica treatment medications. Thus, propels the growth of the market.
Furthermore, increase in awareness among the population in developed as well as developing countries about the sciatica condition and its available treatment options is also boosting the market growth. Moreover, increase in demand for NSAIDs and others analgesic drugs as OTC treatment option for sciatica in countries such as such as China, Brazil, and India, fuel the growth of the market.  

Although various factors drive the growth of the sciatica treatment market, presence of alternate techniques for treatment of sciatica is causing hindrance to the growth of market. There are many non-surgical and surgical treatments for sciatica such as physical therapy for sciatica, chiropractic therapy and surgeries for treating sciatica such as spinal fusion surgery, foraminotomy, laminectomy and others. Thus, these factors act as a restrain to the sciatica treatment market. On the other hand, increase in investment by the key market players in developing regions and technological advances in manufacturing of pharmaceuticals is anticipated to boost the market during the forecast period.

The COVID-19 outbreak had a negative impact on growth of the global sciatica treatment market. COVID-19 pandemic was one of the biggest challenges for the healthcare system. Outbreak of the COVID-19 pandemic had led to partial or complete shutdown of production facilities, owing to prolonged lockdown in major countries such as the U.S., China, Japan, India, and Germany. This has further led to either closure or suspension of these production activities in most industrial units across the world. This also affected the manufacturing of sciatica medications to some extent. However, several developed and developing countries managed to counter the effects of the pandemic by implementing various strategies. This led to regularization of supply chain of medications and medical devices by key players after the pandemic, which will boost the market growth during the forecast period.

Segmental Overview

The sciatica treatment market is segmented by product type, treatment, distribution channel and region. By type, the market is categorized into acute sciatica, chronic sciatica and others (alternating sciatica, bilateral sciatica). On the basis of treatment, the market is segregated into non-steroidal anti-inflammatory drug (NSAIDs), steroids, antidepressants, anticonvulsants, analgesics and others (muscle relaxants, analgesics, opioids). On the basis of distribution channel, the market is categorized into hospital pharmacies, drug & retail store pharmacies and online providers. Region wise, the market is analyzed across North America (the U.S., Canada, and Mexico), Europe (Germany, France, the UK, Italy, Spain, and rest of Europe), Asia-Pacific (Japan, China, Australia, India, South Korea, and rest of Asia-Pacific), and LAMEA (Brazil, South Africa, Saudi Arabia, and rest of LAMEA).  

By Type

The chronic sciatica segment dominated the global sciatica treatment market size in 2021, and is anticipated to grow at the fastest rate during the forecast period, owing to increase in incidence of chronic sciatica, along with changes in human lifestyle and increase in cases of spine tumor and herniated disc.

Sciatica Treatment Market

By Drug Class

The non-steroidal anti-inflammatory drug (NSAIDs) segment dominated the sciatica treatment market share in 2021, and is anticipated to grow at the fastest rate during the forecast period, owing to the low cost and easy availability of NSAIDs as over the counter drug. It is also attributed to the frequent prescription of NSAIDs by the healthcare provider for people with acute and chronic sciatica.

Sciatica Treatment Market

By Distribution Channel

The drug & retail store pharmacies was the highest contributor to the sciatica treatment market size in terms of revenue, owing to its large chain of distribution networks, innovative marketing strategies, and provide better financial & debt management to the patients. On the other hand, online providers is expected to grow at the fastest rate during the forecast period, owing to time saving process and heavy discounts & offers provided by these online platforms.

Sciatica Treatment Market

By Region

The sciatica treatment market is analyzed across North America, Europe, Asia-Pacific, and LAMEA.  North America accounted for a major sciatica treatment market share in 2021, and is expected to maintain its dominance during the forecast period.

Presence of several major players, such as Amneal Pharmaceuticals LLC, Abbott and Johnson and Johnson and advancement in manufacturing technology of pharmaceutical formulations in the region drive the growth of the market. In addition, increase in incidences of sciatica, changes in human lifestyle and growth in geriatric population increase the demand for sciatica treatment medications in the region, which is anticipated to propel the growth of the market.

Sciatica Treatment Market

Furthermore, presence of well-established healthcare infrastructure, high purchasing power, and rise in adoption rate of sciatica relieving medications instead of surgeries, are expected to drive the sciatica treatment market growth. The presence of a large unmet healthcare needs and a favorable regulatory environment are some of the key factors that are expected to increase profitable growth of the market over the forecast period. The introduction of new products and the prevalence of beneficial government initiatives in healthcare system are some key factors contributing to its huge share.

Asia-Pacific expected to grow at the highest rate during the sciatica treatment market forecast period. The market growth in this region is attributable to presence of pharmaceutical companies in the region as well as growth in the purchasing power of populated countries, such as China and India. Moreover, rise in medicine expenditure and adoption of high-tech processing to improve the production of sciatica treatment medications, drive the growth of the market. Furthermore, the Asia-Pacific region exhibits the largest medicine supply and the largest pharmaceuticals industry with availability of raw material in abundance, which can be easily accessed by manufacturers of pharmaceutical products. This, in turn, drives the growth of the market. Asia-Pacific offers profitable sciatica treatment market opportunity for key players operating in the sciatica treatment market, thereby registering the fastest growth rate during the forecast period, owing to the growing infrastructure of industries, rising disposable incomes, as well as well-established presence of domestic companies in the region. In addition, rise in contract manufacturing organizations within the region provides great opportunity for new entrants in this region.  

Competition Analysis
Competitive analysis and profiles of the major players in the sciatica treatment market, such as are provided in this report. There are some important players in the market such as Abbott, Alkem Laboratories Limited, Amneal Pharmaceuticals LLC., Aurobindo Pharma, Johnson and Johnson, Sinfonia Biotherapeutics, Sorrento Therapeutics, Inc, Sun Pharmaceutical Industries Ltd., Teva Pharmaceutical Industries Limited and Zydus Group. SpineThera, Inc., Vita Lifesciences LLC and others are some of the major players in this market. Major players have adopted product launch, product development, clinical trials and branding as key developmental strategies to improve the product portfolio of the sciatica market.  

Some Examples Of Product Launches In The Market
In March 2021, Abbott announced the launch of its new Brufen Power spray, a unique double-strength formulation of proven pain-relieving active ingredient diclofenac, delivered with a unique one-shot spray. It is developed using one shot technology and a 2% double-strength diclofenac formula, ensures low wastage and powerful, targeted pain relief.

In October 2019, Sun Pharmaceutical Industries Ltd. announced the launch of Drizalma Sprinkle (duloxetine delayed-release capsules) in the U.S. for oral use. Drizalma Sprinkle is a serotonin and norepinephrine reuptake inhibitor (SNRI) designed for the treatment of various neuro-psychiatric and pain disorders. The U.S. Food and Drug Administration (FDA) approved Drizalma Sprinkle on July 19, 2019. 

In August 2021, Alkem Laboratories Ltd. announced the launch of Ibuprofen and Famotidine Tablets in the U.S., following an approval from the U.S. Food and Drug Administration (US FDA).

Clinical trials 
In May 2022, Sorrento Therapeutics announced the highly positive results of pivotal Phase 3 SEMDEXATM in sciatica patients following an epidural injection and presented the data at the American Society of Interventional Pain 2022 annual meeting. 

In December 2021, Sorrento Therapeutics announced highly significant positive results from its Phase 3 SP-102 (SEMDEXA) Pivotal Trial C.L.E.A.R Program for its injectable, dexamethasone sodium phosphate viscous gel product for the treatment of lumbosacral radicular pain.  

Geographical Expansion

In April 2022, Sorrento Therapeutics announced the expansion of its direct distribution network to national and regional wholesalers and pharmacies through Cardinal 3PL which will act as a third-party logistics function for Scilex.

Key Benefits For Stakeholders

  • This report provides a quantitative analysis of the market segments, current trends, estimations, and dynamics of the sciatica treatment market analysis from 2021 to 2031 to identify the prevailing sciatica treatment market opportunities.
  • The market research is offered along with information related to key drivers, restraints, and opportunities.
  • Porter's five forces analysis highlights the potency of buyers and suppliers to enable stakeholders make profit-oriented business decisions and strengthen their supplier-buyer network.
  • In-depth analysis of the sciatica treatment industry segmentation assists to determine the prevailing market opportunities.
  • Major countries in each region are mapped according to their revenue contribution to the global market.
  • Market player positioning facilitates benchmarking and provides a clear understanding of the present position of the market players.
  • The report includes the analysis of the regional as well as global sciatica treatment market trends, key players, market segments, application areas, and market growth strategies.

Sciatica Treatment Market Report Highlights

Aspects Details
Market Size By 2031 USD 991.3 million
Growth Rate CAGR of 3.9%
Forecast period 2021 - 2031
Report Pages 241
By Type
  • Acute sciatica
  • Chronic sciatica
  • Others
By Drug class
  • Non-steroidal anti-inflammatory drugs
  • Steroids
  • Antidepressants
  • Others
By Distribution channel
  • Hospital pharmacies
  • Retail and specialty pharmacies
  • Online providers
By Region
  • North America  (U.S., Canada, Mexico)
  • Europe  (Germany, France, UK, Italy, Spain, Rest of Europe)
  • Asia-Pacific  (Japan, China, India, Australia, South Korea, Rest of Asia-Pacific)
  • LAMEA  (Brazil, Saudi Arabia, South Africa, Rest of LAMEA)
Key Market Players Amneal Pharmaceuticals LLC, Johnson and Johnson, Abbott Laboratories, Sun Pharmaceutical Industries Ltd., Sorrento Therapeutics, Inc, Sinfonia Biotherapeutics, Alkem Laboratories Ltd, Aurobindo Pharma, Teva Pharmaceutical Industries Limited, Zydus Lifesciences Limited
 
  • CHAPTER 1: INTRODUCTION

    • 1.1. Report description

    • 1.2. Key market segments

    • 1.3. Key benefits to the stakeholders

    • 1.4. Research Methodology

      • 1.4.1. Primary research

      • 1.4.2. Secondary research

      • 1.4.3. Analyst tools and models

  • CHAPTER 2: EXECUTIVE SUMMARY

    • 2.1. CXO Perspective

  • CHAPTER 3: MARKET OVERVIEW

    • 3.1. Market definition and scope

    • 3.2. Key findings

      • 3.2.1. Top impacting factors

      • 3.2.2. Top investment pockets

    • 3.3. Porter’s five forces analysis

      • 3.3.1. High bargaining power of suppliers

      • 3.3.2. Moderate bargaining power of buyers

      • 3.3.3. Moderate threat of substitutes

      • 3.3.4. Moderate threat of new entrants

      • 3.3.5. Moderate intensity of rivalry

    • 3.4. Market dynamics

      • 3.4.1. Drivers

        • 3.4.1.1. Rise in incidence of sciatica
        • 3.4.1.2. Increase in geriatric population
        • 3.4.1.3. Increase in R&D activities

      • 3.4.2. Restraints

        • 3.4.2.1. Presence of alternate treatment

      • 3.4.3. Opportunities

        • 3.4.3.1. Growth opportunity in emerging markets

    • 3.5. COVID-19 Impact Analysis on the market

  • CHAPTER 4: SCIATICA TREATMENT MARKET, BY TYPE

    • 4.1. Overview

      • 4.1.1. Market size and forecast

    • 4.2. Acute sciatica

      • 4.2.1. Key market trends, growth factors and opportunities

      • 4.2.2. Market size and forecast, by region

      • 4.2.3. Market share analysis by country

    • 4.3. Chronic sciatica

      • 4.3.1. Key market trends, growth factors and opportunities

      • 4.3.2. Market size and forecast, by region

      • 4.3.3. Market share analysis by country

    • 4.4. Others

      • 4.4.1. Key market trends, growth factors and opportunities

      • 4.4.2. Market size and forecast, by region

      • 4.4.3. Market share analysis by country

  • CHAPTER 5: SCIATICA TREATMENT MARKET, BY DRUG CLASS

    • 5.1. Overview

      • 5.1.1. Market size and forecast

    • 5.2. Non-steroidal anti-inflammatory drugs

      • 5.2.1. Key market trends, growth factors and opportunities

      • 5.2.2. Market size and forecast, by region

      • 5.2.3. Market share analysis by country

    • 5.3. Steroids

      • 5.3.1. Key market trends, growth factors and opportunities

      • 5.3.2. Market size and forecast, by region

      • 5.3.3. Market share analysis by country

    • 5.4. Antidepressants

      • 5.4.1. Key market trends, growth factors and opportunities

      • 5.4.2. Market size and forecast, by region

      • 5.4.3. Market share analysis by country

    • 5.5. Others

      • 5.5.1. Key market trends, growth factors and opportunities

      • 5.5.2. Market size and forecast, by region

      • 5.5.3. Market share analysis by country

  • CHAPTER 6: SCIATICA TREATMENT MARKET, BY DISTRIBUTION CHANNEL

    • 6.1. Overview

      • 6.1.1. Market size and forecast

    • 6.2. Hospital pharmacies

      • 6.2.1. Key market trends, growth factors and opportunities

      • 6.2.2. Market size and forecast, by region

      • 6.2.3. Market share analysis by country

    • 6.3. Retail and specialty pharmacies

      • 6.3.1. Key market trends, growth factors and opportunities

      • 6.3.2. Market size and forecast, by region

      • 6.3.3. Market share analysis by country

    • 6.4. Online providers

      • 6.4.1. Key market trends, growth factors and opportunities

      • 6.4.2. Market size and forecast, by region

      • 6.4.3. Market share analysis by country

  • CHAPTER 7: SCIATICA TREATMENT MARKET, BY REGION

    • 7.1. Overview

      • 7.1.1. Market size and forecast By Region

    • 7.2. North America

      • 7.2.1. Key trends and opportunities

      • 7.2.2. Market size and forecast, by Type

      • 7.2.3. Market size and forecast, by Drug class

      • 7.2.4. Market size and forecast, by Distribution channel

      • 7.2.5. Market size and forecast, by country

        • 7.2.5.1. U.S.
          • 7.2.5.1.1. Key market trends, growth factors and opportunities
          • 7.2.5.1.2. Market size and forecast, by Type
          • 7.2.5.1.3. Market size and forecast, by Drug class
          • 7.2.5.1.4. Market size and forecast, by Distribution channel
        • 7.2.5.2. Canada
          • 7.2.5.2.1. Key market trends, growth factors and opportunities
          • 7.2.5.2.2. Market size and forecast, by Type
          • 7.2.5.2.3. Market size and forecast, by Drug class
          • 7.2.5.2.4. Market size and forecast, by Distribution channel
        • 7.2.5.3. Mexico
          • 7.2.5.3.1. Key market trends, growth factors and opportunities
          • 7.2.5.3.2. Market size and forecast, by Type
          • 7.2.5.3.3. Market size and forecast, by Drug class
          • 7.2.5.3.4. Market size and forecast, by Distribution channel
    • 7.3. Europe

      • 7.3.1. Key trends and opportunities

      • 7.3.2. Market size and forecast, by Type

      • 7.3.3. Market size and forecast, by Drug class

      • 7.3.4. Market size and forecast, by Distribution channel

      • 7.3.5. Market size and forecast, by country

        • 7.3.5.1. Germany
          • 7.3.5.1.1. Key market trends, growth factors and opportunities
          • 7.3.5.1.2. Market size and forecast, by Type
          • 7.3.5.1.3. Market size and forecast, by Drug class
          • 7.3.5.1.4. Market size and forecast, by Distribution channel
        • 7.3.5.2. France
          • 7.3.5.2.1. Key market trends, growth factors and opportunities
          • 7.3.5.2.2. Market size and forecast, by Type
          • 7.3.5.2.3. Market size and forecast, by Drug class
          • 7.3.5.2.4. Market size and forecast, by Distribution channel
        • 7.3.5.3. UK
          • 7.3.5.3.1. Key market trends, growth factors and opportunities
          • 7.3.5.3.2. Market size and forecast, by Type
          • 7.3.5.3.3. Market size and forecast, by Drug class
          • 7.3.5.3.4. Market size and forecast, by Distribution channel
        • 7.3.5.4. Italy
          • 7.3.5.4.1. Key market trends, growth factors and opportunities
          • 7.3.5.4.2. Market size and forecast, by Type
          • 7.3.5.4.3. Market size and forecast, by Drug class
          • 7.3.5.4.4. Market size and forecast, by Distribution channel
        • 7.3.5.5. Spain
          • 7.3.5.5.1. Key market trends, growth factors and opportunities
          • 7.3.5.5.2. Market size and forecast, by Type
          • 7.3.5.5.3. Market size and forecast, by Drug class
          • 7.3.5.5.4. Market size and forecast, by Distribution channel
        • 7.3.5.6. Rest of Europe
          • 7.3.5.6.1. Key market trends, growth factors and opportunities
          • 7.3.5.6.2. Market size and forecast, by Type
          • 7.3.5.6.3. Market size and forecast, by Drug class
          • 7.3.5.6.4. Market size and forecast, by Distribution channel
    • 7.4. Asia-Pacific

      • 7.4.1. Key trends and opportunities

      • 7.4.2. Market size and forecast, by Type

      • 7.4.3. Market size and forecast, by Drug class

      • 7.4.4. Market size and forecast, by Distribution channel

      • 7.4.5. Market size and forecast, by country

        • 7.4.5.1. Japan
          • 7.4.5.1.1. Key market trends, growth factors and opportunities
          • 7.4.5.1.2. Market size and forecast, by Type
          • 7.4.5.1.3. Market size and forecast, by Drug class
          • 7.4.5.1.4. Market size and forecast, by Distribution channel
        • 7.4.5.2. China
          • 7.4.5.2.1. Key market trends, growth factors and opportunities
          • 7.4.5.2.2. Market size and forecast, by Type
          • 7.4.5.2.3. Market size and forecast, by Drug class
          • 7.4.5.2.4. Market size and forecast, by Distribution channel
        • 7.4.5.3. India
          • 7.4.5.3.1. Key market trends, growth factors and opportunities
          • 7.4.5.3.2. Market size and forecast, by Type
          • 7.4.5.3.3. Market size and forecast, by Drug class
          • 7.4.5.3.4. Market size and forecast, by Distribution channel
        • 7.4.5.4. Australia
          • 7.4.5.4.1. Key market trends, growth factors and opportunities
          • 7.4.5.4.2. Market size and forecast, by Type
          • 7.4.5.4.3. Market size and forecast, by Drug class
          • 7.4.5.4.4. Market size and forecast, by Distribution channel
        • 7.4.5.5. South Korea
          • 7.4.5.5.1. Key market trends, growth factors and opportunities
          • 7.4.5.5.2. Market size and forecast, by Type
          • 7.4.5.5.3. Market size and forecast, by Drug class
          • 7.4.5.5.4. Market size and forecast, by Distribution channel
        • 7.4.5.6. Rest of Asia-Pacific
          • 7.4.5.6.1. Key market trends, growth factors and opportunities
          • 7.4.5.6.2. Market size and forecast, by Type
          • 7.4.5.6.3. Market size and forecast, by Drug class
          • 7.4.5.6.4. Market size and forecast, by Distribution channel
    • 7.5. LAMEA

      • 7.5.1. Key trends and opportunities

      • 7.5.2. Market size and forecast, by Type

      • 7.5.3. Market size and forecast, by Drug class

      • 7.5.4. Market size and forecast, by Distribution channel

      • 7.5.5. Market size and forecast, by country

        • 7.5.5.1. Brazil
          • 7.5.5.1.1. Key market trends, growth factors and opportunities
          • 7.5.5.1.2. Market size and forecast, by Type
          • 7.5.5.1.3. Market size and forecast, by Drug class
          • 7.5.5.1.4. Market size and forecast, by Distribution channel
        • 7.5.5.2. Saudi Arabia
          • 7.5.5.2.1. Key market trends, growth factors and opportunities
          • 7.5.5.2.2. Market size and forecast, by Type
          • 7.5.5.2.3. Market size and forecast, by Drug class
          • 7.5.5.2.4. Market size and forecast, by Distribution channel
        • 7.5.5.3. South Africa
          • 7.5.5.3.1. Key market trends, growth factors and opportunities
          • 7.5.5.3.2. Market size and forecast, by Type
          • 7.5.5.3.3. Market size and forecast, by Drug class
          • 7.5.5.3.4. Market size and forecast, by Distribution channel
        • 7.5.5.4. Rest of LAMEA
          • 7.5.5.4.1. Key market trends, growth factors and opportunities
          • 7.5.5.4.2. Market size and forecast, by Type
          • 7.5.5.4.3. Market size and forecast, by Drug class
          • 7.5.5.4.4. Market size and forecast, by Distribution channel
  • CHAPTER 8: COMPETITIVE LANDSCAPE

    • 8.1. Introduction

    • 8.2. Top winning strategies

    • 8.3. Product Mapping of Top 10 Player

    • 8.4. Competitive Dashboard

    • 8.5. Competitive Heatmap

    • 8.6. Top player positioning, 2021

  • CHAPTER 9: COMPANY PROFILES

    • 9.1. Abbott Laboratories

      • 9.1.1. Company overview

      • 9.1.2. Key Executives

      • 9.1.3. Company snapshot

      • 9.1.4. Operating business segments

      • 9.1.5. Product portfolio

      • 9.1.6. Business performance

      • 9.1.7. Key strategic moves and developments

    • 9.2. Alkem Laboratories Ltd

      • 9.2.1. Company overview

      • 9.2.2. Key Executives

      • 9.2.3. Company snapshot

      • 9.2.4. Operating business segments

      • 9.2.5. Product portfolio

      • 9.2.6. Business performance

      • 9.2.7. Key strategic moves and developments

    • 9.3. Amneal Pharmaceuticals LLC

      • 9.3.1. Company overview

      • 9.3.2. Key Executives

      • 9.3.3. Company snapshot

      • 9.3.4. Operating business segments

      • 9.3.5. Product portfolio

      • 9.3.6. Business performance

    • 9.4. Johnson and Johnson

      • 9.4.1. Company overview

      • 9.4.2. Key Executives

      • 9.4.3. Company snapshot

      • 9.4.4. Operating business segments

      • 9.4.5. Product portfolio

      • 9.4.6. Business performance

    • 9.5. Sinfonia Biotherapeutics

      • 9.5.1. Company overview

      • 9.5.2. Key Executives

      • 9.5.3. Company snapshot

      • 9.5.4. Operating business segments

      • 9.5.5. Product portfolio

      • 9.5.6. Key strategic moves and developments

    • 9.6. Sorrento Therapeutics, Inc

      • 9.6.1. Company overview

      • 9.6.2. Key Executives

      • 9.6.3. Company snapshot

      • 9.6.4. Operating business segments

      • 9.6.5. Product portfolio

      • 9.6.6. Business performance

      • 9.6.7. Key strategic moves and developments

    • 9.7. Sun Pharmaceutical Industries Ltd.

      • 9.7.1. Company overview

      • 9.7.2. Key Executives

      • 9.7.3. Company snapshot

      • 9.7.4. Operating business segments

      • 9.7.5. Product portfolio

      • 9.7.6. Business performance

      • 9.7.7. Key strategic moves and developments

    • 9.8. Zydus Lifesciences Limited

      • 9.8.1. Company overview

      • 9.8.2. Key Executives

      • 9.8.3. Company snapshot

      • 9.8.4. Operating business segments

      • 9.8.5. Product portfolio

      • 9.8.6. Business performance

    • 9.9. Teva Pharmaceutical Industries Limited

      • 9.9.1. Company overview

      • 9.9.2. Key Executives

      • 9.9.3. Company snapshot

      • 9.9.4. Operating business segments

      • 9.9.5. Product portfolio

      • 9.9.6. Business performance

    • 9.10. Aurobindo Pharma

      • 9.10.1. Company overview

      • 9.10.2. Key Executives

      • 9.10.3. Company snapshot

      • 9.10.4. Operating business segments

      • 9.10.5. Product portfolio

      • 9.10.6. Business performance

  • LIST OF TABLES

  • TABLE 01. GLOBAL SCIATICA TREATMENT MARKET, BY TYPE, 2021-2031 (REVENUE, $MILLION)
    TABLE 02. SCIATICA TREATMENT MARKET FOR ACUTE SCIATICA, BY REGION, 2021-2031 (REVENUE, $MILLION)
    TABLE 03. SCIATICA TREATMENT MARKET FOR CHRONIC SCIATICA, BY REGION, 2021-2031 (REVENUE, $MILLION)
    TABLE 04. SCIATICA TREATMENT MARKET FOR OTHERS, BY REGION, 2021-2031 (REVENUE, $MILLION)
    TABLE 05. GLOBAL SCIATICA TREATMENT MARKET, BY DRUG CLASS, 2021-2031 (REVENUE, $MILLION)
    TABLE 06. SCIATICA TREATMENT MARKET FOR NON-STEROIDAL ANTI-INFLAMMATORY DRUGS, BY REGION, 2021-2031 (REVENUE, $MILLION)
    TABLE 07. SCIATICA TREATMENT MARKET FOR STEROIDS, BY REGION, 2021-2031 (REVENUE, $MILLION)
    TABLE 08. SCIATICA TREATMENT MARKET FOR ANTIDEPRESSANTS, BY REGION, 2021-2031 (REVENUE, $MILLION)
    TABLE 09. SCIATICA TREATMENT MARKET FOR OTHERS, BY REGION, 2021-2031 (REVENUE, $MILLION)
    TABLE 10. GLOBAL SCIATICA TREATMENT MARKET, BY DISTRIBUTION CHANNEL, 2021-2031 (REVENUE, $MILLION)
    TABLE 11. SCIATICA TREATMENT MARKET FOR HOSPITAL PHARMACIES, BY REGION, 2021-2031 (REVENUE, $MILLION)
    TABLE 12. SCIATICA TREATMENT MARKET FOR RETAIL AND SPECIALTY PHARMACIES, BY REGION, 2021-2031 (REVENUE, $MILLION)
    TABLE 13. SCIATICA TREATMENT MARKET FOR ONLINE PROVIDERS, BY REGION, 2021-2031 (REVENUE, $MILLION)
    TABLE 14. SCIATICA TREATMENT MARKET, BY REGION, 2021-2031 (REVENUE, $MILLION)
    TABLE 15. NORTH AMERICA SCIATICA TREATMENT MARKET, BY TYPE, 2021-2031 (REVENUE, $MILLION)
    TABLE 16. NORTH AMERICA SCIATICA TREATMENT MARKET, BY DRUG CLASS, 2021-2031 (REVENUE, $MILLION)
    TABLE 17. NORTH AMERICA SCIATICA TREATMENT MARKET, BY DISTRIBUTION CHANNEL, 2021-2031 (REVENUE, $MILLION)
    TABLE 18. NORTH AMERICA SCIATICA TREATMENT MARKET, BY COUNTRY, 2021-2031 (REVENUE, $MILLION)
    TABLE 19. U.S. SCIATICA TREATMENT MARKET, BY TYPE, 2021-2031 (REVENUE, $MILLION)
    TABLE 20. U.S. SCIATICA TREATMENT MARKET, BY DRUG CLASS, 2021-2031 (REVENUE, $MILLION)
    TABLE 21. U.S. SCIATICA TREATMENT MARKET, BY DISTRIBUTION CHANNEL, 2021-2031 (REVENUE, $MILLION)
    TABLE 22. CANADA SCIATICA TREATMENT MARKET, BY TYPE, 2021-2031 (REVENUE, $MILLION)
    TABLE 23. CANADA SCIATICA TREATMENT MARKET, BY DRUG CLASS, 2021-2031 (REVENUE, $MILLION)
    TABLE 24. CANADA SCIATICA TREATMENT MARKET, BY DISTRIBUTION CHANNEL, 2021-2031 (REVENUE, $MILLION)
    TABLE 25. MEXICO SCIATICA TREATMENT MARKET, BY TYPE, 2021-2031 (REVENUE, $MILLION)
    TABLE 26. MEXICO SCIATICA TREATMENT MARKET, BY DRUG CLASS, 2021-2031 (REVENUE, $MILLION)
    TABLE 27. MEXICO SCIATICA TREATMENT MARKET, BY DISTRIBUTION CHANNEL, 2021-2031 (REVENUE, $MILLION)
    TABLE 28. EUROPE SCIATICA TREATMENT MARKET, BY TYPE, 2021-2031 (REVENUE, $MILLION)
    TABLE 29. EUROPE SCIATICA TREATMENT MARKET, BY DRUG CLASS, 2021-2031 (REVENUE, $MILLION)
    TABLE 30. EUROPE SCIATICA TREATMENT MARKET, BY DISTRIBUTION CHANNEL, 2021-2031 (REVENUE, $MILLION)
    TABLE 31. EUROPE SCIATICA TREATMENT MARKET, BY COUNTRY, 2021-2031 (REVENUE, $MILLION)
    TABLE 32. GERMANY SCIATICA TREATMENT MARKET, BY TYPE, 2021-2031 (REVENUE, $MILLION)
    TABLE 33. GERMANY SCIATICA TREATMENT MARKET, BY DRUG CLASS, 2021-2031 (REVENUE, $MILLION)
    TABLE 34. GERMANY SCIATICA TREATMENT MARKET, BY DISTRIBUTION CHANNEL, 2021-2031 (REVENUE, $MILLION)
    TABLE 35. FRANCE SCIATICA TREATMENT MARKET, BY TYPE, 2021-2031 (REVENUE, $MILLION)
    TABLE 36. FRANCE SCIATICA TREATMENT MARKET, BY DRUG CLASS, 2021-2031 (REVENUE, $MILLION)
    TABLE 37. FRANCE SCIATICA TREATMENT MARKET, BY DISTRIBUTION CHANNEL, 2021-2031 (REVENUE, $MILLION)
    TABLE 38. UK SCIATICA TREATMENT MARKET, BY TYPE, 2021-2031 (REVENUE, $MILLION)
    TABLE 39. UK SCIATICA TREATMENT MARKET, BY DRUG CLASS, 2021-2031 (REVENUE, $MILLION)
    TABLE 40. UK SCIATICA TREATMENT MARKET, BY DISTRIBUTION CHANNEL, 2021-2031 (REVENUE, $MILLION)
    TABLE 41. ITALY SCIATICA TREATMENT MARKET, BY TYPE, 2021-2031 (REVENUE, $MILLION)
    TABLE 42. ITALY SCIATICA TREATMENT MARKET, BY DRUG CLASS, 2021-2031 (REVENUE, $MILLION)
    TABLE 43. ITALY SCIATICA TREATMENT MARKET, BY DISTRIBUTION CHANNEL, 2021-2031 (REVENUE, $MILLION)
    TABLE 44. SPAIN SCIATICA TREATMENT MARKET, BY TYPE, 2021-2031 (REVENUE, $MILLION)
    TABLE 45. SPAIN SCIATICA TREATMENT MARKET, BY DRUG CLASS, 2021-2031 (REVENUE, $MILLION)
    TABLE 46. SPAIN SCIATICA TREATMENT MARKET, BY DISTRIBUTION CHANNEL, 2021-2031 (REVENUE, $MILLION)
    TABLE 47. REST OF EUROPE SCIATICA TREATMENT MARKET, BY TYPE, 2021-2031 (REVENUE, $MILLION)
    TABLE 48. REST OF EUROPE SCIATICA TREATMENT MARKET, BY DRUG CLASS, 2021-2031 (REVENUE, $MILLION)
    TABLE 49. REST OF EUROPE SCIATICA TREATMENT MARKET, BY DISTRIBUTION CHANNEL, 2021-2031 (REVENUE, $MILLION)
    TABLE 50. ASIA-PACIFIC SCIATICA TREATMENT MARKET, BY TYPE, 2021-2031 (REVENUE, $MILLION)
    TABLE 51. ASIA-PACIFIC SCIATICA TREATMENT MARKET, BY DRUG CLASS, 2021-2031 (REVENUE, $MILLION)
    TABLE 52. ASIA-PACIFIC SCIATICA TREATMENT MARKET, BY DISTRIBUTION CHANNEL, 2021-2031 (REVENUE, $MILLION)
    TABLE 53. ASIA-PACIFIC SCIATICA TREATMENT MARKET, BY COUNTRY, 2021-2031 (REVENUE, $MILLION)
    TABLE 54. JAPAN SCIATICA TREATMENT MARKET, BY TYPE, 2021-2031 (REVENUE, $MILLION)
    TABLE 55. JAPAN SCIATICA TREATMENT MARKET, BY DRUG CLASS, 2021-2031 (REVENUE, $MILLION)
    TABLE 56. JAPAN SCIATICA TREATMENT MARKET, BY DISTRIBUTION CHANNEL, 2021-2031 (REVENUE, $MILLION)
    TABLE 57. CHINA SCIATICA TREATMENT MARKET, BY TYPE, 2021-2031 (REVENUE, $MILLION)
    TABLE 58. CHINA SCIATICA TREATMENT MARKET, BY DRUG CLASS, 2021-2031 (REVENUE, $MILLION)
    TABLE 59. CHINA SCIATICA TREATMENT MARKET, BY DISTRIBUTION CHANNEL, 2021-2031 (REVENUE, $MILLION)
    TABLE 60. INDIA SCIATICA TREATMENT MARKET, BY TYPE, 2021-2031 (REVENUE, $MILLION)
    TABLE 61. INDIA SCIATICA TREATMENT MARKET, BY DRUG CLASS, 2021-2031 (REVENUE, $MILLION)
    TABLE 62. INDIA SCIATICA TREATMENT MARKET, BY DISTRIBUTION CHANNEL, 2021-2031 (REVENUE, $MILLION)
    TABLE 63. AUSTRALIA SCIATICA TREATMENT MARKET, BY TYPE, 2021-2031 (REVENUE, $MILLION)
    TABLE 64. AUSTRALIA SCIATICA TREATMENT MARKET, BY DRUG CLASS, 2021-2031 (REVENUE, $MILLION)
    TABLE 65. AUSTRALIA SCIATICA TREATMENT MARKET, BY DISTRIBUTION CHANNEL, 2021-2031 (REVENUE, $MILLION)
    TABLE 66. SOUTH KOREA SCIATICA TREATMENT MARKET, BY TYPE, 2021-2031 (REVENUE, $MILLION)
    TABLE 67. SOUTH KOREA SCIATICA TREATMENT MARKET, BY DRUG CLASS, 2021-2031 (REVENUE, $MILLION)
    TABLE 68. SOUTH KOREA SCIATICA TREATMENT MARKET, BY DISTRIBUTION CHANNEL, 2021-2031 (REVENUE, $MILLION)
    TABLE 69. REST OF ASIA-PACIFIC SCIATICA TREATMENT MARKET, BY TYPE, 2021-2031 (REVENUE, $MILLION)
    TABLE 70. REST OF ASIA-PACIFIC SCIATICA TREATMENT MARKET, BY DRUG CLASS, 2021-2031 (REVENUE, $MILLION)
    TABLE 71. REST OF ASIA-PACIFIC SCIATICA TREATMENT MARKET, BY DISTRIBUTION CHANNEL, 2021-2031 (REVENUE, $MILLION)
    TABLE 72. LAMEA SCIATICA TREATMENT MARKET, BY TYPE, 2021-2031 (REVENUE, $MILLION)
    TABLE 73. LAMEA SCIATICA TREATMENT MARKET, BY DRUG CLASS, 2021-2031 (REVENUE, $MILLION)
    TABLE 74. LAMEA SCIATICA TREATMENT MARKET, BY DISTRIBUTION CHANNEL, 2021-2031 (REVENUE, $MILLION)
    TABLE 75. LAMEA SCIATICA TREATMENT MARKET, BY COUNTRY, 2021-2031 (REVENUE, $MILLION)
    TABLE 76. BRAZIL SCIATICA TREATMENT MARKET, BY TYPE, 2021-2031 (REVENUE, $MILLION)
    TABLE 77. BRAZIL SCIATICA TREATMENT MARKET, BY DRUG CLASS, 2021-2031 (REVENUE, $MILLION)
    TABLE 78. BRAZIL SCIATICA TREATMENT MARKET, BY DISTRIBUTION CHANNEL, 2021-2031 (REVENUE, $MILLION)
    TABLE 79. SAUDI ARABIA SCIATICA TREATMENT MARKET, BY TYPE, 2021-2031 (REVENUE, $MILLION)
    TABLE 80. SAUDI ARABIA SCIATICA TREATMENT MARKET, BY DRUG CLASS, 2021-2031 (REVENUE, $MILLION)
    TABLE 81. SAUDI ARABIA SCIATICA TREATMENT MARKET, BY DISTRIBUTION CHANNEL, 2021-2031 (REVENUE, $MILLION)
    TABLE 82. SOUTH AFRICA SCIATICA TREATMENT MARKET, BY TYPE, 2021-2031 (REVENUE, $MILLION)
    TABLE 83. SOUTH AFRICA SCIATICA TREATMENT MARKET, BY DRUG CLASS, 2021-2031 (REVENUE, $MILLION)
    TABLE 84. SOUTH AFRICA SCIATICA TREATMENT MARKET, BY DISTRIBUTION CHANNEL, 2021-2031 (REVENUE, $MILLION)
    TABLE 85. REST OF LAMEA SCIATICA TREATMENT MARKET, BY TYPE, 2021-2031 (REVENUE, $MILLION)
    TABLE 86. REST OF LAMEA SCIATICA TREATMENT MARKET, BY DRUG CLASS, 2021-2031 (REVENUE, $MILLION)
    TABLE 87. REST OF LAMEA SCIATICA TREATMENT MARKET, BY DISTRIBUTION CHANNEL, 2021-2031 (REVENUE, $MILLION)
    TABLE 88. ABBOTT LABORATORIES: KEY EXECUTIVES
    TABLE 89. ABBOTT LABORATORIES: COMPANY SNAPSHOT
    TABLE 90. ABBOTT LABORATORIES: PRODUCT SEGMENTS
    TABLE 91. ABBOTT LABORATORIES: PRODUCT PORTFOLIO
    TABLE 92. ABBOTT LABORATORIES: KEY STRATERGIES
    TABLE 93. ALKEM LABORATORIES LTD: KEY EXECUTIVES
    TABLE 94. ALKEM LABORATORIES LTD: COMPANY SNAPSHOT
    TABLE 95. ALKEM LABORATORIES LTD: PRODUCT SEGMENTS
    TABLE 96. ALKEM LABORATORIES LTD: PRODUCT PORTFOLIO
    TABLE 97. ALKEM LABORATORIES LTD: KEY STRATERGIES
    TABLE 98. AMNEAL PHARMACEUTICALS LLC: KEY EXECUTIVES
    TABLE 99. AMNEAL PHARMACEUTICALS LLC: COMPANY SNAPSHOT
    TABLE 100. AMNEAL PHARMACEUTICALS LLC: PRODUCT SEGMENTS
    TABLE 101. AMNEAL PHARMACEUTICALS LLC: PRODUCT PORTFOLIO
    TABLE 102. JOHNSON AND JOHNSON: KEY EXECUTIVES
    TABLE 103. JOHNSON AND JOHNSON: COMPANY SNAPSHOT
    TABLE 104. JOHNSON AND JOHNSON: PRODUCT SEGMENTS
    TABLE 105. JOHNSON AND JOHNSON: PRODUCT PORTFOLIO
    TABLE 106. SINFONIA BIOTHERAPEUTICS: KEY EXECUTIVES
    TABLE 107. SINFONIA BIOTHERAPEUTICS: COMPANY SNAPSHOT
    TABLE 108. SINFONIA BIOTHERAPEUTICS: PRODUCT SEGMENTS
    TABLE 109. SINFONIA BIOTHERAPEUTICS: PRODUCT PORTFOLIO
    TABLE 110. SINFONIA BIOTHERAPEUTICS: KEY STRATERGIES
    TABLE 111. SORRENTO THERAPEUTICS, INC: KEY EXECUTIVES
    TABLE 112. SORRENTO THERAPEUTICS, INC: COMPANY SNAPSHOT
    TABLE 113. SORRENTO THERAPEUTICS, INC: PRODUCT SEGMENTS
    TABLE 114. SORRENTO THERAPEUTICS, INC: PRODUCT PORTFOLIO
    TABLE 115. SORRENTO THERAPEUTICS, INC: KEY STRATERGIES
    TABLE 116. SUN PHARMACEUTICAL INDUSTRIES LTD.: KEY EXECUTIVES
    TABLE 117. SUN PHARMACEUTICAL INDUSTRIES LTD.: COMPANY SNAPSHOT
    TABLE 118. SUN PHARMACEUTICAL INDUSTRIES LTD.: PRODUCT SEGMENTS
    TABLE 119. SUN PHARMACEUTICAL INDUSTRIES LTD.: PRODUCT PORTFOLIO
    TABLE 120. SUN PHARMACEUTICAL INDUSTRIES LTD.: KEY STRATERGIES
    TABLE 121. ZYDUS LIFESCIENCES LIMITED: KEY EXECUTIVES
    TABLE 122. ZYDUS LIFESCIENCES LIMITED: COMPANY SNAPSHOT
    TABLE 123. ZYDUS LIFESCIENCES LIMITED: PRODUCT SEGMENTS
    TABLE 124. ZYDUS LIFESCIENCES LIMITED: PRODUCT PORTFOLIO
    TABLE 125. TEVA PHARMACEUTICAL INDUSTRIES LIMITED: KEY EXECUTIVES
    TABLE 126. TEVA PHARMACEUTICAL INDUSTRIES LIMITED: COMPANY SNAPSHOT
    TABLE 127. TEVA PHARMACEUTICAL INDUSTRIES LIMITED: PRODUCT SEGMENTS
    TABLE 128. TEVA PHARMACEUTICAL INDUSTRIES LIMITED: PRODUCT PORTFOLIO
    TABLE 129. AUROBINDO PHARMA: KEY EXECUTIVES
    TABLE 130. AUROBINDO PHARMA: COMPANY SNAPSHOT
    TABLE 131. AUROBINDO PHARMA: PRODUCT SEGMENTS
    TABLE 132. AUROBINDO PHARMA: PRODUCT PORTFOLIO
  • LIST OF FIGURES

  • FIGURE 01. SCIATICA TREATMENT MARKET, 2021-2031
    FIGURE 02. SEGMENTATION OF SCIATICA TREATMENT MARKET, 2021-2031
    FIGURE 03. TOP INVESTMENT POCKETS IN SCIATICA TREATMENT MARKET (2022-2031)
    FIGURE 04. HIGH BARGAINING POWER OF SUPPLIERS
    FIGURE 05. MODERATE BARGAINING POWER OF BUYERS
    FIGURE 06. MODERATE THREAT OF SUBSTITUTES
    FIGURE 07. MODERATE THREAT OF NEW ENTRANTS
    FIGURE 08. MODERATE INTENSITY OF RIVALRY
    FIGURE 09. DRIVERS, RESTRAINTS AND OPPORTUNITIES: GLOBALSCIATICA TREATMENT MARKET
    FIGURE 10. SCIATICA TREATMENT MARKET, BY TYPE, 2021(%)
    FIGURE 11. COMPARATIVE SHARE ANALYSIS OF SCIATICA TREATMENT MARKET FOR ACUTE SCIATICA, BY COUNTRY 2021-2031(%)
    FIGURE 12. COMPARATIVE SHARE ANALYSIS OF SCIATICA TREATMENT MARKET FOR CHRONIC SCIATICA, BY COUNTRY 2021-2031(%)
    FIGURE 13. COMPARATIVE SHARE ANALYSIS OF SCIATICA TREATMENT MARKET FOR OTHERS, BY COUNTRY 2021-2031(%)
    FIGURE 14. SCIATICA TREATMENT MARKET, BY DRUG CLASS, 2021(%)
    FIGURE 15. COMPARATIVE SHARE ANALYSIS OF SCIATICA TREATMENT MARKET FOR NON-STEROIDAL ANTI-INFLAMMATORY DRUGS, BY COUNTRY 2021-2031(%)
    FIGURE 16. COMPARATIVE SHARE ANALYSIS OF SCIATICA TREATMENT MARKET FOR STEROIDS, BY COUNTRY 2021-2031(%)
    FIGURE 17. COMPARATIVE SHARE ANALYSIS OF SCIATICA TREATMENT MARKET FOR ANTIDEPRESSANTS, BY COUNTRY 2021-2031(%)
    FIGURE 18. COMPARATIVE SHARE ANALYSIS OF SCIATICA TREATMENT MARKET FOR OTHERS, BY COUNTRY 2021-2031(%)
    FIGURE 19. SCIATICA TREATMENT MARKET, BY DISTRIBUTION CHANNEL, 2021(%)
    FIGURE 20. COMPARATIVE SHARE ANALYSIS OF SCIATICA TREATMENT MARKET FOR HOSPITAL PHARMACIES, BY COUNTRY 2021-2031(%)
    FIGURE 21. COMPARATIVE SHARE ANALYSIS OF SCIATICA TREATMENT MARKET FOR RETAIL AND SPECIALTY PHARMACIES, BY COUNTRY 2021-2031(%)
    FIGURE 22. COMPARATIVE SHARE ANALYSIS OF SCIATICA TREATMENT MARKET FOR ONLINE PROVIDERS, BY COUNTRY 2021-2031(%)
    FIGURE 23. SCIATICA TREATMENT MARKET BY REGION, 2021
    FIGURE 24. U.S. SCIATICA TREATMENT MARKET, 2021-2031 ($MILLION)
    FIGURE 25. CANADA SCIATICA TREATMENT MARKET, 2021-2031 ($MILLION)
    FIGURE 26. MEXICO SCIATICA TREATMENT MARKET, 2021-2031 ($MILLION)
    FIGURE 27. GERMANY SCIATICA TREATMENT MARKET, 2021-2031 ($MILLION)
    FIGURE 28. FRANCE SCIATICA TREATMENT MARKET, 2021-2031 ($MILLION)
    FIGURE 29. UK SCIATICA TREATMENT MARKET, 2021-2031 ($MILLION)
    FIGURE 30. ITALY SCIATICA TREATMENT MARKET, 2021-2031 ($MILLION)
    FIGURE 31. SPAIN SCIATICA TREATMENT MARKET, 2021-2031 ($MILLION)
    FIGURE 32. REST OF EUROPE SCIATICA TREATMENT MARKET, 2021-2031 ($MILLION)
    FIGURE 33. JAPAN SCIATICA TREATMENT MARKET, 2021-2031 ($MILLION)
    FIGURE 34. CHINA SCIATICA TREATMENT MARKET, 2021-2031 ($MILLION)
    FIGURE 35. INDIA SCIATICA TREATMENT MARKET, 2021-2031 ($MILLION)
    FIGURE 36. AUSTRALIA SCIATICA TREATMENT MARKET, 2021-2031 ($MILLION)
    FIGURE 37. SOUTH KOREA SCIATICA TREATMENT MARKET, 2021-2031 ($MILLION)
    FIGURE 38. REST OF ASIA-PACIFIC SCIATICA TREATMENT MARKET, 2021-2031 ($MILLION)
    FIGURE 39. BRAZIL SCIATICA TREATMENT MARKET, 2021-2031 ($MILLION)
    FIGURE 40. SAUDI ARABIA SCIATICA TREATMENT MARKET, 2021-2031 ($MILLION)
    FIGURE 41. SOUTH AFRICA SCIATICA TREATMENT MARKET, 2021-2031 ($MILLION)
    FIGURE 42. REST OF LAMEA SCIATICA TREATMENT MARKET, 2021-2031 ($MILLION)
    FIGURE 43. TOP WINNING STRATEGIES, BY YEAR
    FIGURE 44. TOP WINNING STRATEGIES, BY DEVELOPMENT
    FIGURE 45. TOP WINNING STRATEGIES, BY COMPANY
    FIGURE 46. PRODUCT MAPPING OF TOP 10 PLAYERS
    FIGURE 47. COMPETITIVE DASHBOARD
    FIGURE 48. COMPETITIVE HEATMAP: SCIATICA TREATMENT MARKET
    FIGURE 49. TOP PLAYER POSITIONING, 2021
    FIGURE 50. ABBOTT LABORATORIES: NET SALES, 2019-2021 ($MILLION)
    FIGURE 51. ABBOTT LABORATORIES: REVENUE SHARE BY SEGMENT, 2021 (%)
    FIGURE 52. ABBOTT LABORATORIES: REVENUE SHARE BY REGION, 2021 (%)
    FIGURE 53. ALKEM LABORATORIES LTD: NET REVENUE, 2019-2021 ($MILLION)
    FIGURE 54. ALKEM LABORATORIES LTD: REVENUE SHARE BY REGION, 2021 (%)
    FIGURE 55. AMNEAL PHARMACEUTICALS LLC: NET REVENUE, 2019-2021 ($MILLION)
    FIGURE 56. AMNEAL PHARMACEUTICALS LLC: REVENUE SHARE BY SEGMENT, 2021 (%)
    FIGURE 57. JOHNSON AND JOHNSON: SALES REVENUE, 2019-2021 ($MILLION)
    FIGURE 58. JOHNSON AND JOHNSON: REVENUE SHARE BY SEGMENT, 2021 (%)
    FIGURE 59. JOHNSON AND JOHNSON: REVENUE SHARE BY REGION, 2021 (%)
    FIGURE 60. SORRENTO THERAPEUTICS, INC: NET REVENUE, 2019-2021 ($MILLION)
    FIGURE 61. SORRENTO THERAPEUTICS, INC: REVENUE SHARE BY SEGMENT, 2021 (%)
    FIGURE 62. SUN PHARMACEUTICAL INDUSTRIES LTD.: NET REVENUE, 2019-2021 ($MILLION)
    FIGURE 63. SUN PHARMACEUTICAL INDUSTRIES LTD.: REVENUE SHARE BY REGION, 2021 (%)
    FIGURE 64. ZYDUS LIFESCIENCES LIMITED: NET REVENUE, 2019-2021 ($MILLION)
    FIGURE 65. ZYDUS LIFESCIENCES LIMITED: REVENUE SHARE BY SEGMENT, 2021 (%)
    FIGURE 66. ZYDUS LIFESCIENCES LIMITED: REVENUE SHARE BY REGION, 2021 (%)
    FIGURE 67. TEVA PHARMACEUTICAL INDUSTRIES LIMITED: NET REVENUE, 2019-2021 ($MILLION)
    FIGURE 68. TEVA PHARMACEUTICAL INDUSTRIES LIMITED: REVENUE SHARE BY SEGMENT, 2021 (%)
    FIGURE 69. AUROBINDO PHARMA: NET REVENUE, 2019-2021 ($MILLION)
    FIGURE 70. AUROBINDO PHARMA: REVENUE SHARE BY REGION, 2021 (%)


This section provides various opinions of top-level CXOs in the global sciatica treatment market. According to the insights of CXOs, the increase in demand for efficient and high-quality medications for the treatment of sciatica is expected to offer profitable opportunities for the expansion of the sciatica treatment market. Also, increase in adoption of NSAIDs as medication for treatment of sciatica by healthcare providers is boosting the growth of the market. Moreover, technological advancements in manufacturing and development of formulations have increased the production capacity as well as the efficacy and quality of the medication, which is driving the growth of the market.  

CXOs further added that increase in incidence of sciatica in the population of developed as well as developing regions has largely contributed toward the market revenue in 2021, and is expected to maintain this trend throughout the forecast period. Also, increase in awareness around the globe regarding sciatica disease and its treatment options, significantly contributes towards the revenue generation. In addition, increase in prevalence of conditions such as herniated disc, bone spurs, or rarely the tumor increase the incidence of sciatica, which contributes to the growth of the sciatica treatment market.  

Furthermore, North America is expected to witness highest growth, in terms of revenue, owing to increase in awareness among the people regarding management of various disease conditions and rise in government initiatives for offering effective patient care, lead to the growth of the market. However, Asia-Pacific is anticipated to witness notable growth, owing to increase in investments for manufacturing of pharmaceutical products in the emerging economies such as India and China

PURCHASE OPTIONS

Call or Email us

U.S.-Canada Toll-free: +1-800-792-5285
Int'l : +1-503-894-6022
Europe : +44-845-528-1300
Email : help@alliedmarketresearch.com
 
FREQUENTLY ASKED QUESTIONS?

A. Major factors that drive the growth of the sciatica treatment market include increase in incidence of sciatica, surge in R&D activities for developing novel therapeutics for sciatica and rise in awareness among the people regarding sciatica and its treatments.

A. Chronic sciatica is the leading type in the sciatica treatment market.

A. North America is the largest regional market for sciatica treatment.

A. Abbott, Alkem Laboratories Limited, Amneal Pharmaceuticals LLC., Aurobindo Pharma, Johnson & Johnson, Sinfonia Biotherapeutics, Sorrento Therapeutics, Inc, Sun Pharmaceutical Industries Ltd., Teva Pharmaceutical Industries Limited and Zydus Group., are the top companies to hold the market share in sciatica treatment.

A. The sciatica treatment market valued for $678.02 million in 2021 and is estimated to reach $991.26 million by 2031, exhibiting a CAGR of 3.9% from 2022 to 2031.

A. 2021 is the base year of sciatica treatment market.

A. 2022-2031 is the forecast year of sciatica treatment market.

Looking for Customization?

 Customization Request

Have a Question?

 Speak with Analyst

Any Confusion?

 Inquire Before Buying

Have a glance of the Report

  Request Sample
RELATED TAGS

Purchase Full Report of
Sciatica Treatment Market

Start reading instantly.
This Report and over 66,905+ more Reports, Available with Avenue Library. T&C*.

  • Online Only
  • $3,570
  • Online cloud access only
  • Restricted print, copy, paste & download
  • Read only
  • Free industry update
    (Within 180 days)
  • Free report update in next update cycle
    (Jan 2024 - Jan 2025)
  • Data Pack
  • $3,840
  • Restricted to one authorized user
  • One print only
  • Available in
    Excel
  • Free industry update
    (Within 180 days)
  •   Free report update in next update cycle
    (Jan 2024 - Jan 2025)
  • Single User
  • $5,730
  • Restricted to one authorized user
  • One print only
  • Available in
    PDF
  • Free industry update
    (Within 180 days)
  •   Free report update in next update cycle
    (Jan 2024 - Jan 2025)
  • Five Users
  • $6,450
  • Limited to five authorized users
  • Print upto five copies
  • Available in
    PDF
  • Free industry update
    (Within 180 days)
  •   Free report update in next update cycle
    (Jan 2024 - Jan 2025)
  • Enterprise
    License/PDF

  • $9,600
  • Unlimited
    within
    company/enterprise
  • Available in Excel & PDF
  • Free industry update
    (Within 180 days)
  •   Free report update in next update cycle
    (Jan 2024 - Jan 2025)
  • Library
    Membership

  • $999 $ 1,175
    Per User/ Per month/ Billed annually
  • Published Content
    E-access
  • Company Profiles
    E-access
  • Newly Added Content Access
  • 10 PDF
    Downloads
  • 5 Excel Data
    Pack Downloads
  • 250 Company Profiles PDF Downloads
  • Buy Now

*Taxes/Fees, if applicable will be added during checkout. All prices in USD

RELATED REPORTS
 

Why Allied Market Research?


Infallible Methodology

To ensure high-level data integrity, accurate analysis, and impeccable forecasts

Analyst Support

For complete satisfaction

Customization

On-demand customization of scope of the report to exactly meet your needs

TARGETED MARKET VIEW

Targeted market view to provide pertinent information and save time of readers

Get fresh content delivered

Get insights on topics that are crucial for your business. Stay abreast of your interest areas.

Get Industry Data Alerts

Why Allied Market Research?

Infallible Methodology

To ensure high-level data integrity, accurate analysis, and impeccable forecasts

Analyst Support

For complete satisfaction

Customization

On-demand customization of scope of the report to exactly meet your needs

TARGETED MARKET VIEW

Targeted market view to provide pertinent information and save time of readers