0
2023
Secure Digital Card Market

Secure Digital Card Market

by Size (Micro SD Card, SD Card, Mini SD Card), by Application (Digital Cameras, Tablets, Mobile Phones, Others): Global Opportunity Analysis and Industry Forecast, 2022-2031

Report Code: A13183
Jan 2023 | Pages: 211
Tables: 101
Charts: 67
  • Formats*:

  • pdf

    Single User License, Five User
    License & Enterprise User License

  • xls

    Data Pack Excel License

  • ppt

    It comes with the additional cost
    of $2500.00 contact sales.


Secure Digital Card Market Research, 2031

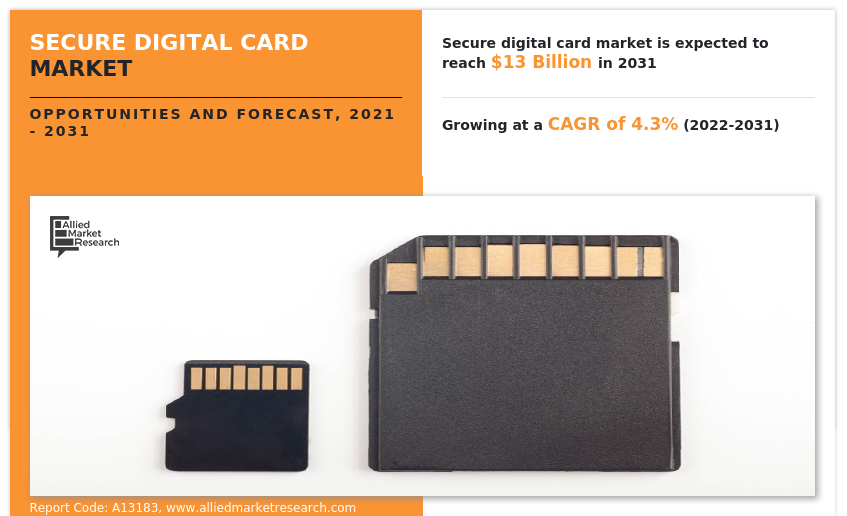
The global secure digital card market was valued at $8.8 billion in 2021, and is projected to reach $13 billion by 2031, growing at a CAGR of 4.3% from 2022 to 2031.

A Secure Digital (SD) card is a small flash memory card made for high-capacity storage and a variety of portable devices, including GPS navigation systems, cell phones, e-books, PDAs, smartphones, digital cameras, music players, digital video camcorders, personal computers. Secure Digital card is a proprietary non-volatile flash memory card format developed by the SD Association (SDA) for use in portal devices.  

A Secure Digital card is about the size of a postage stamp and weighs about two grams. It is similar in size to Multimedia Card (MMC) but smaller than older types of memory cards such as Smart Media or CompactFlash cards. An SD card has high transfer rates and low battery consumption, both of which are essential for mobile devices. An SD card uses flash memory to provide non-volatile memory, which means no power source is required to hold the stored data.  

SD cards also come in different sizes, such as micro SD card and mini SD card. SD cards are non-volatile memory cards whose size and performance make them a more popular choice than regular flash storage devices. Durability is another key strength that SD cards offer. SD cards are much more shock resistant than regular storage devices. This means that the SD card can be dropped from a height of 100 feet without any damage. This, along with the metal connectors used on SD cards, are less susceptible to damage.  
The outbreak of the COVID-19 pandemic has significantly affected the secure digital card market. As governments in several countries impose and extend lockdowns, production and manufacturing facilities around the world are shut down due to crisis and labor shortages. Considering the input of various industry experts at various stages of the value chain such as OEMs, suppliers, integrators, end users, and distributors, as well as the economic output of various companies in the secure digital card ecosystem, the market is estimated to have experienced a decline in 2019- 2020. In addition, the pandemic outbreak disrupted the global supply chain and thus created a significant gap in the supply chain. The financial impact of the pandemic was devastating. The major players in the secure digital card industry were temporarily in decline due to a lack of skilled specialists to develop secure digital card solutions, which led to a decrease in turnover in the 2020-2021 financial year. However, the market is expected to recover after 2021 and will remain in the growth phase during the forecast period.

Secure Digital Card Market

A major factor driving the growth of the secure digital card market is the need for increased storage capacity in digital cameras, cell phones, and other portable electronic devices. However, the increasing popularity of online streaming, rapid adoption of cloud technology, and increasing use of internal storage in smartphones are expected to hinder the growth of the secure digital card market.

he secure digital card market is segmented into Size and Application.
Secure Digital Card Market

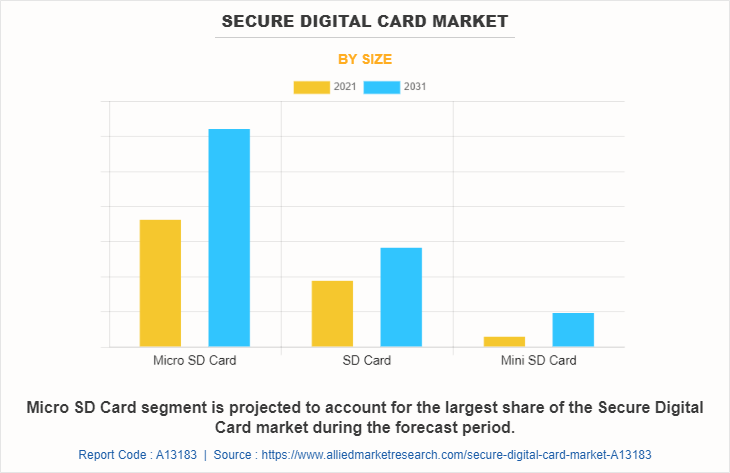
On the basis of size, the market is divided into mini SD card, micro SD card, and SD card. The micro SD card segment is the highest share contributor to the market.

Types of SD Cards -at first glance, an SD card is a small, flat, rectangular object with a notch along one edge and copper leads, called pins, embedded on one side along another edge. But there are a few different form factors. Here are the physical sizes for SD cards: 

  • 32 x 24 millimeters, 2.1 millimeters thick - This is the most common. This size has nine pins and features a write-protection switch on one side to toggle between read-only and read-write states. 

  • 20 x 21.5 millimeters, 1.4 millimeters thick - This is the "mini" version with 11 pins, and it's less common than the other two sizes. 

  • 15 x 11 millimeters, 1 millimeter thick - This is the "micro" version with eight pins. Because it's so small, this size has become popular in mobile devices like smartphones. 

It's not just the physical makeup of the card that's standardized. SD cards also come in different capacities. These are the capacity formats for SD cards listed in order from oldest to newest: 

  • SD - Standard format with up to 2 GB per card, available in all three sizes, under $10 

  • SDHC - High-capacity format with 4 to 32 GB per card, available in all three sizes, $10 to $100 

  • SDXC - eXtended capacity format with 32 GB to 2 TB per card, available in the larger and micro sizes only, starting around $80
Secure Digital Card Market

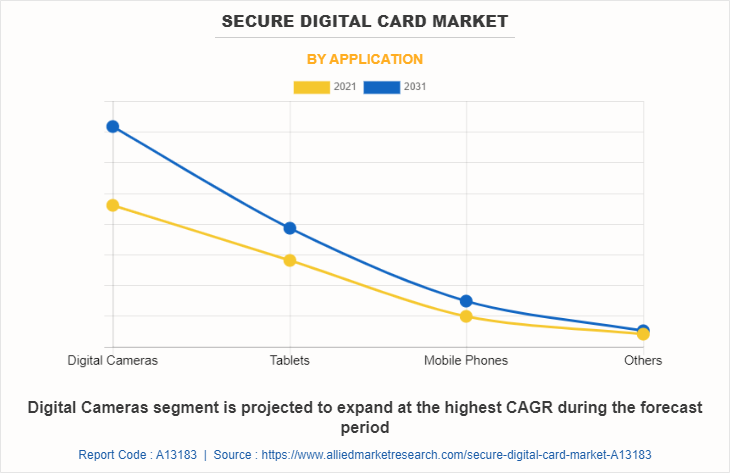
On the basis of application, it is divided into mobile phones, tablets, digital cameras, and others. The digital camera segment is projected as the most lucrative segment in the secure digital card outlook
Secure Digital Card Market

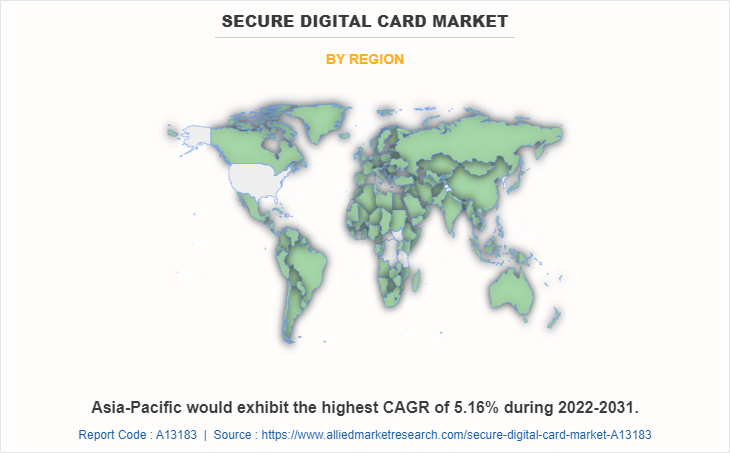
Region-wise, the secure digital card market trends are analyzed across North America (the U.S., Canada, and Mexico), Europe (UK, Germany, France, and the rest of Europe), Asia-Pacific China, Japan, India, South Korea, and the rest of Asia-Pacific), and LAMEA (Latin America, the Middle East, and Africa). Asia-Pacific, specifically the China region, remains a significant participant in the global secure digital card industry. Major organizations and government institutions in the country are intensely putting resources into this industry.  

Country-wise, the U.S. acquired a prime share in the secure digital card market share in the North American region and is expected to grow at a significant CAGR during the forecast period of 2019-2031. The U.S., holds a dominant position in the secure digital card market, owing to the rise in investment by prime vendors to boost the secure digital card for consumer electronics and IT & telecom applications. 

In Europe, the UK, dominated the secure digital card market, in terms of revenue, in 2021 and is expected to follow the same trend during the forecast period. However, Germany is expected to emerge as the fastest-growing country in Europe's secure digital card with a notable CAGR, due to advancement in the automotive industry which drives the usage of microelectronics in the country and thus creates lucrative growth opportunities for the secure digital SD card market in Germany.  

In Asia-Pacific, China is expected to emerge as a significant market for the secure digital card industry, owing to new product developments and a significant rise in investment by prime players and government institutions. The well-established electronics industry in the Asia-Pacific region and the adoption of innovative technologies have given organizations in the region a competitive secure digital card market opportunity.   

In the LAMEA region, the Middle East countries garner significant market share in 2021 due to the adoption of new technologies, digital transformation and connectivity are reshaping the future of the automotive and consumer electronics industry in the Middle East. Moreover, the Latin America region is expected to grow at a significant CAGR from 2022 to 2031, owing to shifts in artificial intelligence, industry 4.0, and smart technological changes in recent years, which is expected to reshape the growth of the secure digital card in the Latin America region. 

TOP IMPACTING FACTORS 

The major factors driving the secure digital card market growth are the increasing technological advancements; for instance, the new camera modules allow users to capture images or videos in high-resolution formats, which require large storage space. In addition, the increase in the need for surveillance video cameras, because in contrast to (CCTV) and security cameras, video surveillance cameras allow users to monitor the feed from any location, these are the factors propelling the SD card market growth. On the other hand, declining prices of NAND flash memory and expanding in-built memory space in smartphones, quick acceptance of cloud technology, and rising online streaming usage are all predicted to hinder the market growth. Furthermore, the rise of IoT is increasing the use of SD memory cards in various devices providing lucrative growth opportunities for the SD card market. 

COMPETITIVE ANALYSIS 

The global secure digital card market outlook is highly competitive, owing to the strong presence of existing vendors. Vendors of the secure digital card market with extensive technical and financial resources are expected to gain a competitive advantage over their competitors because they can cater to market demands. The competitive environment in this market is expected to increase as technological innovations, product extensions, and different strategies adopted by key vendors increase. Competitive analysis and profiles of the major global secure digital card market players that have been provided in the report include SanDisk Corporation, Transcend Information, ADATA Technology Co., Ltd., Toshiba Corporation, Samsung Electronics Co Ltd., Sony Corporation, Panasonic Corporation, Micron Technology Inc., Kingston Technology, and PNY Technologies Inc.

KEY DEVELOPMENTS/ STRATEGIES  

SanDisk Corporation, Micron Technology Inc., Samsung Electronics Co Ltd., Panasonic Corporation, and Transcend Information are the top 5 key players in the secure digital card market. Top market players have adopted various strategies, such as acquisition, agreement, business development, business expansion, collaboration, product launch, innovation, and product expansion to expand their foothold in the market and create secure digital card market opportunity.

  • In September 2021, Samsung launched the new EVO Plus and PRO Plus memory card families that are specially designed for professionals, videographers, and content creators.   

  • In April 2020, Kingston Digital Inc, launched KC2500 its next generation M.2 NVMe PCIe SSD. That are specially designed for desktops, workstations, and high-performance computing devices.  

  • In March 2020, Kingston Digital Inc, launched DC1000M, a new U.2 data center NVMe PCIe SSD. This card is designed to support a wide range of data intensive applications such as artificial intelligence, HPC, cloud computing. 

KEY BENEFITS FOR STAKEHOLDERS 

  • This study comprises analytical depiction of the secure digital card market size along with the current trends and future estimations to depict the imminent investment pockets. 

  • The overall secure digital card market analysis is determined to understand the profitable trends to gain a stronger foothold. 

  • The report presents information related to key drivers, restraints, and opportunities with a detailed impact analysis. 

  • The secure digital card market forecast is quantitatively analyzed from 2022 to 2031 to benchmark the financial competency. 

  • The Porter’s five forces analysis illustrates the potency of the buyers and suppliers in the secure digital multimedia card market. 

  • The report includes the share of key vendors and market trends. 

Secure Digital Card Market Report Highlights

Aspects Details
Market Size By 2031 USD 13 billion
Growth Rate CAGR of 4.3%
Forecast period 2021 - 2031
Report Pages 211
By Application
  • Digital Cameras
  • Tablets
  • Mobile Phones
  • Others
By Size
  • Micro SD Card
  • SD Card
  • Mini SD Card
By Region
  • North America  (U.S., Canada, Mexico)
  • Europe  (UK, Germany, France, Rest of Europe)
  • Asia-Pacific  (China, Japan, India, South Korea, Rest of Asia-Pacific)
  • LAMEA  (Latin America, Middle East, Africa)
Key Market Players Micron Technology Inc., Transcend Information, SanDisk Corporation, Panasonic Corporation, Samsung Electronics Co Ltd, Sony Corporation, Toshiba Corporation, PNY Technologies Inc., ADATA Technology Co., Ltd., Kingston Technology

Analyst Review

The secure digital Card market is expected to grow at a significant rate owing to the rise in consumer electronics demand and the demand for more storage space in mobile phones, digital cameras, and other portable electronic devices. Rising advancements in NAND technology have increased the adoption of SD memory cards. Many companies are incorporating novel features in the SD cards, in order to attract customers and increase sales. These companies are adding innovative features such as memory-expansion options, free software, and waterproof SD cards.   

In addition, the global market for secure digital (SD) memory cards is anticipated to expand at a faster rate in the near future, because to remain competitive in the global market, businesses are introducing SD memory cards with the fastest speeds and the largest capacities. In addition, in 2017 the SD Association introduced a UHS-III bus interface with a speed of 624 MB per second to meet the growing demand for Gigabyte wireless communication, 8K video, and 360-degree cameras. This opens the door to highly anticipated new video and imaging features. 

 
  • CHAPTER 1: INTRODUCTION

    • 1.1. Report description

    • 1.2. Key market segments

    • 1.3. Key benefits to the stakeholders

    • 1.4. Research Methodology

      • 1.4.1. Primary research

      • 1.4.2. Secondary research

      • 1.4.3. Analyst tools and models

  • CHAPTER 2: EXECUTIVE SUMMARY

    • 2.1. CXO Perspective

  • CHAPTER 3: MARKET OVERVIEW

    • 3.1. Market definition and scope

    • 3.2. Key findings

      • 3.2.1. Top impacting factors

      • 3.2.2. Top investment pockets

    • 3.3. Porter’s five forces analysis

      • 3.3.1. Moderate bargaining power of suppliers

      • 3.3.2. Moderate threat of new entrants

      • 3.3.3. Moderate threat of substitutes

      • 3.3.4. Moderate intensity of rivalry

      • 3.3.5. Moderate-to-high bargaining power of buyers

    • 3.4. Market dynamics

      • 3.4.1. Drivers

        • 3.4.1.1. Growing technological advancements
        • 3.4.1.2. Increase in the need for surveillance video cameras

      • 3.4.2. Restraints

        • 3.4.2.1. Decline in prices of NAND flash memory and expansion of in-built memory in smartphones

      • 3.4.3. Opportunities

        • 3.4.3.1. Developments in IoT increase the use of SD memory cards in various devices

    • 3.5. COVID-19 Impact Analysis on the market

  • CHAPTER 4: SECURE DIGITAL CARD MARKET, BY SIZE

    • 4.1. Overview

      • 4.1.1. Market size and forecast

    • 4.2. Micro SD Card

      • 4.2.1. Key market trends, growth factors and opportunities

      • 4.2.2. Market size and forecast, by region

      • 4.2.3. Market share analysis by country

    • 4.3. SD Card

      • 4.3.1. Key market trends, growth factors and opportunities

      • 4.3.2. Market size and forecast, by region

      • 4.3.3. Market share analysis by country

    • 4.4. Mini SD Card

      • 4.4.1. Key market trends, growth factors and opportunities

      • 4.4.2. Market size and forecast, by region

      • 4.4.3. Market share analysis by country

  • CHAPTER 5: SECURE DIGITAL CARD MARKET, BY APPLICATION

    • 5.1. Overview

      • 5.1.1. Market size and forecast

    • 5.2. Digital Cameras

      • 5.2.1. Key market trends, growth factors and opportunities

      • 5.2.2. Market size and forecast, by region

      • 5.2.3. Market share analysis by country

    • 5.3. Tablets

      • 5.3.1. Key market trends, growth factors and opportunities

      • 5.3.2. Market size and forecast, by region

      • 5.3.3. Market share analysis by country

    • 5.4. Mobile Phones

      • 5.4.1. Key market trends, growth factors and opportunities

      • 5.4.2. Market size and forecast, by region

      • 5.4.3. Market share analysis by country

    • 5.5. Others

      • 5.5.1. Key market trends, growth factors and opportunities

      • 5.5.2. Market size and forecast, by region

      • 5.5.3. Market share analysis by country

  • CHAPTER 6: SECURE DIGITAL CARD MARKET, BY REGION

    • 6.1. Overview

      • 6.1.1. Market size and forecast By Region

    • 6.2. North America

      • 6.2.1. Key trends and opportunities

      • 6.2.2. Market size and forecast, by Size

      • 6.2.3. Market size and forecast, by Application

      • 6.2.4. Market size and forecast, by country

        • 6.2.4.1. U.S.
          • 6.2.4.1.1. Key market trends, growth factors and opportunities
          • 6.2.4.1.2. Market size and forecast, by Size
          • 6.2.4.1.3. Market size and forecast, by Application
        • 6.2.4.2. Canada
          • 6.2.4.2.1. Key market trends, growth factors and opportunities
          • 6.2.4.2.2. Market size and forecast, by Size
          • 6.2.4.2.3. Market size and forecast, by Application
        • 6.2.4.3. Mexico
          • 6.2.4.3.1. Key market trends, growth factors and opportunities
          • 6.2.4.3.2. Market size and forecast, by Size
          • 6.2.4.3.3. Market size and forecast, by Application
    • 6.3. Europe

      • 6.3.1. Key trends and opportunities

      • 6.3.2. Market size and forecast, by Size

      • 6.3.3. Market size and forecast, by Application

      • 6.3.4. Market size and forecast, by country

        • 6.3.4.1. UK
          • 6.3.4.1.1. Key market trends, growth factors and opportunities
          • 6.3.4.1.2. Market size and forecast, by Size
          • 6.3.4.1.3. Market size and forecast, by Application
        • 6.3.4.2. Germany
          • 6.3.4.2.1. Key market trends, growth factors and opportunities
          • 6.3.4.2.2. Market size and forecast, by Size
          • 6.3.4.2.3. Market size and forecast, by Application
        • 6.3.4.3. France
          • 6.3.4.3.1. Key market trends, growth factors and opportunities
          • 6.3.4.3.2. Market size and forecast, by Size
          • 6.3.4.3.3. Market size and forecast, by Application
        • 6.3.4.4. Rest of Europe
          • 6.3.4.4.1. Key market trends, growth factors and opportunities
          • 6.3.4.4.2. Market size and forecast, by Size
          • 6.3.4.4.3. Market size and forecast, by Application
    • 6.4. Asia-Pacific

      • 6.4.1. Key trends and opportunities

      • 6.4.2. Market size and forecast, by Size

      • 6.4.3. Market size and forecast, by Application

      • 6.4.4. Market size and forecast, by country

        • 6.4.4.1. China
          • 6.4.4.1.1. Key market trends, growth factors and opportunities
          • 6.4.4.1.2. Market size and forecast, by Size
          • 6.4.4.1.3. Market size and forecast, by Application
        • 6.4.4.2. Japan
          • 6.4.4.2.1. Key market trends, growth factors and opportunities
          • 6.4.4.2.2. Market size and forecast, by Size
          • 6.4.4.2.3. Market size and forecast, by Application
        • 6.4.4.3. India
          • 6.4.4.3.1. Key market trends, growth factors and opportunities
          • 6.4.4.3.2. Market size and forecast, by Size
          • 6.4.4.3.3. Market size and forecast, by Application
        • 6.4.4.4. South Korea
          • 6.4.4.4.1. Key market trends, growth factors and opportunities
          • 6.4.4.4.2. Market size and forecast, by Size
          • 6.4.4.4.3. Market size and forecast, by Application
        • 6.4.4.5. Rest of Asia-Pacific
          • 6.4.4.5.1. Key market trends, growth factors and opportunities
          • 6.4.4.5.2. Market size and forecast, by Size
          • 6.4.4.5.3. Market size and forecast, by Application
    • 6.5. LAMEA

      • 6.5.1. Key trends and opportunities

      • 6.5.2. Market size and forecast, by Size

      • 6.5.3. Market size and forecast, by Application

      • 6.5.4. Market size and forecast, by country

        • 6.5.4.1. Latin America
          • 6.5.4.1.1. Key market trends, growth factors and opportunities
          • 6.5.4.1.2. Market size and forecast, by Size
          • 6.5.4.1.3. Market size and forecast, by Application
        • 6.5.4.2. Middle East
          • 6.5.4.2.1. Key market trends, growth factors and opportunities
          • 6.5.4.2.2. Market size and forecast, by Size
          • 6.5.4.2.3. Market size and forecast, by Application
        • 6.5.4.3. Africa
          • 6.5.4.3.1. Key market trends, growth factors and opportunities
          • 6.5.4.3.2. Market size and forecast, by Size
          • 6.5.4.3.3. Market size and forecast, by Application
  • CHAPTER 7: COMPETITIVE LANDSCAPE

    • 7.1. Introduction

    • 7.2. Top winning strategies

    • 7.3. Product Mapping of Top 10 Player

    • 7.4. Competitive Dashboard

    • 7.5. Competitive Heatmap

    • 7.6. Top player positioning, 2021

  • CHAPTER 8: COMPANY PROFILES

    • 8.1. SanDisk Corporation

      • 8.1.1. Company overview

      • 8.1.2. Key Executives

      • 8.1.3. Company snapshot

      • 8.1.4. Operating business segments

      • 8.1.5. Product portfolio

      • 8.1.6. Business performance

      • 8.1.7. Key strategic moves and developments

    • 8.2. Transcend Information

      • 8.2.1. Company overview

      • 8.2.2. Key Executives

      • 8.2.3. Company snapshot

      • 8.2.4. Operating business segments

      • 8.2.5. Product portfolio

      • 8.2.6. Business performance

      • 8.2.7. Key strategic moves and developments

    • 8.3. ADATA Technology Co., Ltd.

      • 8.3.1. Company overview

      • 8.3.2. Key Executives

      • 8.3.3. Company snapshot

      • 8.3.4. Operating business segments

      • 8.3.5. Product portfolio

      • 8.3.6. Key strategic moves and developments

    • 8.4. Toshiba Corporation

      • 8.4.1. Company overview

      • 8.4.2. Key Executives

      • 8.4.3. Company snapshot

      • 8.4.4. Operating business segments

      • 8.4.5. Product portfolio

      • 8.4.6. Business performance

      • 8.4.7. Key strategic moves and developments

    • 8.5. Samsung Electronics Co Ltd

      • 8.5.1. Company overview

      • 8.5.2. Key Executives

      • 8.5.3. Company snapshot

      • 8.5.4. Operating business segments

      • 8.5.5. Product portfolio

      • 8.5.6. Business performance

      • 8.5.7. Key strategic moves and developments

    • 8.6. Sony Corporation

      • 8.6.1. Company overview

      • 8.6.2. Key Executives

      • 8.6.3. Company snapshot

      • 8.6.4. Operating business segments

      • 8.6.5. Product portfolio

      • 8.6.6. Business performance

    • 8.7. Panasonic Corporation

      • 8.7.1. Company overview

      • 8.7.2. Key Executives

      • 8.7.3. Company snapshot

      • 8.7.4. Operating business segments

      • 8.7.5. Product portfolio

      • 8.7.6. Business performance

      • 8.7.7. Key strategic moves and developments

    • 8.8. Micron Technology Inc.

      • 8.8.1. Company overview

      • 8.8.2. Key Executives

      • 8.8.3. Company snapshot

      • 8.8.4. Operating business segments

      • 8.8.5. Product portfolio

      • 8.8.6. Business performance

      • 8.8.7. Key strategic moves and developments

    • 8.9. Kingston Technology

      • 8.9.1. Company overview

      • 8.9.2. Key Executives

      • 8.9.3. Company snapshot

      • 8.9.4. Operating business segments

      • 8.9.5. Product portfolio

      • 8.9.6. Business performance

      • 8.9.7. Key strategic moves and developments

    • 8.10. PNY Technologies Inc.

      • 8.10.1. Company overview

      • 8.10.2. Key Executives

      • 8.10.3. Company snapshot

      • 8.10.4. Operating business segments

      • 8.10.5. Product portfolio

      • 8.10.6. Key strategic moves and developments

  • LIST OF TABLES

  • TABLE 01. GLOBAL SECURE DIGITAL CARD MARKET, BY SIZE, 2021-2031 ($MILLION)
    TABLE 02. SECURE DIGITAL CARD MARKET FOR MICRO SD CARD, BY REGION, 2021-2031 ($MILLION)
    TABLE 03. SECURE DIGITAL CARD MARKET FOR SD CARD, BY REGION, 2021-2031 ($MILLION)
    TABLE 04. SECURE DIGITAL CARD MARKET FOR MINI SD CARD, BY REGION, 2021-2031 ($MILLION)
    TABLE 05. GLOBAL SECURE DIGITAL CARD MARKET, BY APPLICATION, 2021-2031 ($MILLION)
    TABLE 06. SECURE DIGITAL CARD MARKET FOR DIGITAL CAMERAS, BY REGION, 2021-2031 ($MILLION)
    TABLE 07. SECURE DIGITAL CARD MARKET FOR TABLETS, BY REGION, 2021-2031 ($MILLION)
    TABLE 08. SECURE DIGITAL CARD MARKET FOR MOBILE PHONES, BY REGION, 2021-2031 ($MILLION)
    TABLE 09. SECURE DIGITAL CARD MARKET FOR OTHERS, BY REGION, 2021-2031 ($MILLION)
    TABLE 10. SECURE DIGITAL CARD MARKET, BY REGION, 2021-2031 ($MILLION)
    TABLE 11. NORTH AMERICA SECURE DIGITAL CARD MARKET, BY SIZE, 2021-2031 ($MILLION)
    TABLE 12. NORTH AMERICA SECURE DIGITAL CARD MARKET, BY APPLICATION, 2021-2031 ($MILLION)
    TABLE 13. NORTH AMERICA SECURE DIGITAL CARD MARKET, BY COUNTRY, 2021-2031 ($MILLION)
    TABLE 14. U.S. SECURE DIGITAL CARD MARKET, BY SIZE, 2021-2031 ($MILLION)
    TABLE 15. U.S. SECURE DIGITAL CARD MARKET, BY APPLICATION, 2021-2031 ($MILLION)
    TABLE 16. CANADA SECURE DIGITAL CARD MARKET, BY SIZE, 2021-2031 ($MILLION)
    TABLE 17. CANADA SECURE DIGITAL CARD MARKET, BY APPLICATION, 2021-2031 ($MILLION)
    TABLE 18. MEXICO SECURE DIGITAL CARD MARKET, BY SIZE, 2021-2031 ($MILLION)
    TABLE 19. MEXICO SECURE DIGITAL CARD MARKET, BY APPLICATION, 2021-2031 ($MILLION)
    TABLE 20. EUROPE SECURE DIGITAL CARD MARKET, BY SIZE, 2021-2031 ($MILLION)
    TABLE 21. EUROPE SECURE DIGITAL CARD MARKET, BY APPLICATION, 2021-2031 ($MILLION)
    TABLE 22. EUROPE SECURE DIGITAL CARD MARKET, BY COUNTRY, 2021-2031 ($MILLION)
    TABLE 23. UK SECURE DIGITAL CARD MARKET, BY SIZE, 2021-2031 ($MILLION)
    TABLE 24. UK SECURE DIGITAL CARD MARKET, BY APPLICATION, 2021-2031 ($MILLION)
    TABLE 25. GERMANY SECURE DIGITAL CARD MARKET, BY SIZE, 2021-2031 ($MILLION)
    TABLE 26. GERMANY SECURE DIGITAL CARD MARKET, BY APPLICATION, 2021-2031 ($MILLION)
    TABLE 27. FRANCE SECURE DIGITAL CARD MARKET, BY SIZE, 2021-2031 ($MILLION)
    TABLE 28. FRANCE SECURE DIGITAL CARD MARKET, BY APPLICATION, 2021-2031 ($MILLION)
    TABLE 29. REST OF EUROPE SECURE DIGITAL CARD MARKET, BY SIZE, 2021-2031 ($MILLION)
    TABLE 30. REST OF EUROPE SECURE DIGITAL CARD MARKET, BY APPLICATION, 2021-2031 ($MILLION)
    TABLE 31. ASIA-PACIFIC SECURE DIGITAL CARD MARKET, BY SIZE, 2021-2031 ($MILLION)
    TABLE 32. ASIA-PACIFIC SECURE DIGITAL CARD MARKET, BY APPLICATION, 2021-2031 ($MILLION)
    TABLE 33. ASIA-PACIFIC SECURE DIGITAL CARD MARKET, BY COUNTRY, 2021-2031 ($MILLION)
    TABLE 34. CHINA SECURE DIGITAL CARD MARKET, BY SIZE, 2021-2031 ($MILLION)
    TABLE 35. CHINA SECURE DIGITAL CARD MARKET, BY APPLICATION, 2021-2031 ($MILLION)
    TABLE 36. JAPAN SECURE DIGITAL CARD MARKET, BY SIZE, 2021-2031 ($MILLION)
    TABLE 37. JAPAN SECURE DIGITAL CARD MARKET, BY APPLICATION, 2021-2031 ($MILLION)
    TABLE 38. INDIA SECURE DIGITAL CARD MARKET, BY SIZE, 2021-2031 ($MILLION)
    TABLE 39. INDIA SECURE DIGITAL CARD MARKET, BY APPLICATION, 2021-2031 ($MILLION)
    TABLE 40. SOUTH KOREA SECURE DIGITAL CARD MARKET, BY SIZE, 2021-2031 ($MILLION)
    TABLE 41. SOUTH KOREA SECURE DIGITAL CARD MARKET, BY APPLICATION, 2021-2031 ($MILLION)
    TABLE 42. REST OF ASIA-PACIFIC SECURE DIGITAL CARD MARKET, BY SIZE, 2021-2031 ($MILLION)
    TABLE 43. REST OF ASIA-PACIFIC SECURE DIGITAL CARD MARKET, BY APPLICATION, 2021-2031 ($MILLION)
    TABLE 44. LAMEA SECURE DIGITAL CARD MARKET, BY SIZE, 2021-2031 ($MILLION)
    TABLE 45. LAMEA SECURE DIGITAL CARD MARKET, BY APPLICATION, 2021-2031 ($MILLION)
    TABLE 46. LAMEA SECURE DIGITAL CARD MARKET, BY COUNTRY, 2021-2031 ($MILLION)
    TABLE 47. LATIN AMERICA SECURE DIGITAL CARD MARKET, BY SIZE, 2021-2031 ($MILLION)
    TABLE 48. LATIN AMERICA SECURE DIGITAL CARD MARKET, BY APPLICATION, 2021-2031 ($MILLION)
    TABLE 49. MIDDLE EAST SECURE DIGITAL CARD MARKET, BY SIZE, 2021-2031 ($MILLION)
    TABLE 50. MIDDLE EAST SECURE DIGITAL CARD MARKET, BY APPLICATION, 2021-2031 ($MILLION)
    TABLE 51. AFRICA SECURE DIGITAL CARD MARKET, BY SIZE, 2021-2031 ($MILLION)
    TABLE 52. AFRICA SECURE DIGITAL CARD MARKET, BY APPLICATION, 2021-2031 ($MILLION)
    TABLE 53. SANDISK CORPORATION: KEY EXECUTIVES
    TABLE 54. SANDISK CORPORATION: COMPANY SNAPSHOT
    TABLE 55. SANDISK CORPORATION: SERVICE SEGMENTS
    TABLE 56. SANDISK CORPORATION: PRODUCT PORTFOLIO
    TABLE 57. SANDISK CORPORATION: KEY STRATERGIES
    TABLE 58. TRANSCEND INFORMATION: KEY EXECUTIVES
    TABLE 59. TRANSCEND INFORMATION: COMPANY SNAPSHOT
    TABLE 60. TRANSCEND INFORMATION: PRODUCT SEGMENTS
    TABLE 61. TRANSCEND INFORMATION: PRODUCT PORTFOLIO
    TABLE 62. TRANSCEND INFORMATION: KEY STRATERGIES
    TABLE 63. ADATA TECHNOLOGY CO., LTD.: KEY EXECUTIVES
    TABLE 64. ADATA TECHNOLOGY CO., LTD.: COMPANY SNAPSHOT
    TABLE 65. ADATA TECHNOLOGY CO., LTD.: PRODUCT SEGMENTS
    TABLE 66. ADATA TECHNOLOGY CO., LTD.: PRODUCT PORTFOLIO
    TABLE 67. ADATA TECHNOLOGY CO., LTD.: KEY STRATERGIES
    TABLE 68. TOSHIBA CORPORATION: KEY EXECUTIVES
    TABLE 69. TOSHIBA CORPORATION: COMPANY SNAPSHOT
    TABLE 70. TOSHIBA CORPORATION: SERVICE SEGMENTS
    TABLE 71. TOSHIBA CORPORATION: PRODUCT PORTFOLIO
    TABLE 72. TOSHIBA CORPORATION: KEY STRATERGIES
    TABLE 73. SAMSUNG ELECTRONICS CO LTD: KEY EXECUTIVES
    TABLE 74. SAMSUNG ELECTRONICS CO LTD: COMPANY SNAPSHOT
    TABLE 75. SAMSUNG ELECTRONICS CO LTD: SERVICE SEGMENTS
    TABLE 76. SAMSUNG ELECTRONICS CO LTD: PRODUCT PORTFOLIO
    TABLE 77. SAMSUNG ELECTRONICS CO LTD: KEY STRATERGIES
    TABLE 78. SONY CORPORATION: KEY EXECUTIVES
    TABLE 79. SONY CORPORATION: COMPANY SNAPSHOT
    TABLE 80. SONY CORPORATION: SERVICE SEGMENTS
    TABLE 81. SONY CORPORATION: PRODUCT PORTFOLIO
    TABLE 82. PANASONIC CORPORATION: KEY EXECUTIVES
    TABLE 83. PANASONIC CORPORATION: COMPANY SNAPSHOT
    TABLE 84. PANASONIC CORPORATION: SERVICE SEGMENTS
    TABLE 85. PANASONIC CORPORATION: PRODUCT PORTFOLIO
    TABLE 86. PANASONIC CORPORATION: KEY STRATERGIES
    TABLE 87. MICRON TECHNOLOGY INC.: KEY EXECUTIVES
    TABLE 88. MICRON TECHNOLOGY INC.: COMPANY SNAPSHOT
    TABLE 89. MICRON TECHNOLOGY INC.: SERVICE SEGMENTS
    TABLE 90. MICRON TECHNOLOGY INC.: PRODUCT PORTFOLIO
    TABLE 91. MICRON TECHNOLOGY INC.: KEY STRATERGIES
    TABLE 92. KINGSTON TECHNOLOGY: KEY EXECUTIVES
    TABLE 93. KINGSTON TECHNOLOGY: COMPANY SNAPSHOT
    TABLE 94. KINGSTON TECHNOLOGY: PRODUCT SEGMENTS
    TABLE 95. KINGSTON TECHNOLOGY: PRODUCT PORTFOLIO
    TABLE 96. KINGSTON TECHNOLOGY: KEY STRATERGIES
    TABLE 97. PNY TECHNOLOGIES INC.: KEY EXECUTIVES
    TABLE 98. PNY TECHNOLOGIES INC.: COMPANY SNAPSHOT
    TABLE 99. PNY TECHNOLOGIES INC.: SERVICE SEGMENTS
    TABLE 100. PNY TECHNOLOGIES INC.: PRODUCT PORTFOLIO
    TABLE 101. PNY TECHNOLOGIES INC.: KEY STRATERGIES
  • LIST OF FIGURES

  • FIGURE 01. SECURE DIGITAL CARD MARKET, 2021-2031
    FIGURE 02. SEGMENTATION OF SECURE DIGITAL CARD MARKET, 2021-2031
    FIGURE 03. TOP INVESTMENT POCKETS IN SECURE DIGITAL CARD MARKET (2022-2031)
    FIGURE 04. MODERATE BARGAINING POWER OF SUPPLIERS
    FIGURE 05. MODERATE-TO-HIGH BARGAINING POWER OF BUYERS
    FIGURE 06. MODERATE THREAT OF SUBSTITUTES
    FIGURE 07. MODERATE THREAT OF NEW ENTRANTS
    FIGURE 08. MODERATE INTENSITY OF RIVALRY
    FIGURE 09. DRIVERS, RESTRAINTS AND OPPORTUNITIES: GLOBALSECURE DIGITAL CARD MARKET
    FIGURE 10. SECURE DIGITAL CARD MARKET, BY SIZE, 2021(%)
    FIGURE 11. COMPARATIVE SHARE ANALYSIS OF SECURE DIGITAL CARD MARKET FOR MICRO SD CARD, BY COUNTRY 2021-2031(%)
    FIGURE 12. COMPARATIVE SHARE ANALYSIS OF SECURE DIGITAL CARD MARKET FOR SD CARD, BY COUNTRY 2021-2031(%)
    FIGURE 13. COMPARATIVE SHARE ANALYSIS OF SECURE DIGITAL CARD MARKET FOR MINI SD CARD, BY COUNTRY 2021-2031(%)
    FIGURE 14. SECURE DIGITAL CARD MARKET, BY APPLICATION, 2021(%)
    FIGURE 15. COMPARATIVE SHARE ANALYSIS OF SECURE DIGITAL CARD MARKET FOR DIGITAL CAMERAS, BY COUNTRY 2021-2031(%)
    FIGURE 16. COMPARATIVE SHARE ANALYSIS OF SECURE DIGITAL CARD MARKET FOR TABLETS, BY COUNTRY 2021-2031(%)
    FIGURE 17. COMPARATIVE SHARE ANALYSIS OF SECURE DIGITAL CARD MARKET FOR MOBILE PHONES, BY COUNTRY 2021-2031(%)
    FIGURE 18. COMPARATIVE SHARE ANALYSIS OF SECURE DIGITAL CARD MARKET FOR OTHERS, BY COUNTRY 2021-2031(%)
    FIGURE 19. SECURE DIGITAL CARD MARKET BY REGION, 2021
    FIGURE 20. U.S. SECURE DIGITAL CARD MARKET, 2021-2031 ($MILLION)
    FIGURE 21. CANADA SECURE DIGITAL CARD MARKET, 2021-2031 ($MILLION)
    FIGURE 22. MEXICO SECURE DIGITAL CARD MARKET, 2021-2031 ($MILLION)
    FIGURE 23. UK SECURE DIGITAL CARD MARKET, 2021-2031 ($MILLION)
    FIGURE 24. GERMANY SECURE DIGITAL CARD MARKET, 2021-2031 ($MILLION)
    FIGURE 25. FRANCE SECURE DIGITAL CARD MARKET, 2021-2031 ($MILLION)
    FIGURE 26. REST OF EUROPE SECURE DIGITAL CARD MARKET, 2021-2031 ($MILLION)
    FIGURE 27. CHINA SECURE DIGITAL CARD MARKET, 2021-2031 ($MILLION)
    FIGURE 28. JAPAN SECURE DIGITAL CARD MARKET, 2021-2031 ($MILLION)
    FIGURE 29. INDIA SECURE DIGITAL CARD MARKET, 2021-2031 ($MILLION)
    FIGURE 30. SOUTH KOREA SECURE DIGITAL CARD MARKET, 2021-2031 ($MILLION)
    FIGURE 31. REST OF ASIA-PACIFIC SECURE DIGITAL CARD MARKET, 2021-2031 ($MILLION)
    FIGURE 32. LATIN AMERICA SECURE DIGITAL CARD MARKET, 2021-2031 ($MILLION)
    FIGURE 33. MIDDLE EAST SECURE DIGITAL CARD MARKET, 2021-2031 ($MILLION)
    FIGURE 34. AFRICA SECURE DIGITAL CARD MARKET, 2021-2031 ($MILLION)
    FIGURE 35. TOP WINNING STRATEGIES, BY YEAR
    FIGURE 36. TOP WINNING STRATEGIES, BY DEVELOPMENT
    FIGURE 37. TOP WINNING STRATEGIES, BY COMPANY
    FIGURE 38. PRODUCT MAPPING OF TOP 10 PLAYERS
    FIGURE 39. COMPETITIVE DASHBOARD
    FIGURE 40. COMPETITIVE HEATMAP: SECURE DIGITAL CARD MARKET
    FIGURE 41. TOP PLAYER POSITIONING, 2021
    FIGURE 42. SANDISK CORPORATION: RESEARCH & DEVELOPMENT EXPENDITURE, 2019-2021
    FIGURE 43. SANDISK CORPORATION: NET REVENUE, 2019-2021 ($MILLION)
    FIGURE 44. SANDISK CORPORATION: REVENUE SHARE BY REGION, 2021 (%)
    FIGURE 45. SANDISK CORPORATION: REVENUE SHARE BY REGION, 2021 (%)
    FIGURE 46. TRANSCEND INFORMATION: NET REVENUE, 2019-2021 ($MILLION)
    FIGURE 47. TRANSCEND INFORMATION: RESEARCH & DEVELOPMENT EXPENDITURE, 2019-2021
    FIGURE 48. TRANSCEND INFORMATION: REVENUE SHARE BY REGION, 2021 (%)
    FIGURE 49. TOSHIBA CORPORATION: NET REVENUE, 2020-2022 ($MILLION)
    FIGURE 50. TOSHIBA CORPORATION: REVENUE SHARE BY SEGMENT, 2022 (%)
    FIGURE 51. TOSHIBA CORPORATION: REVENUE SHARE BY REGION, 2022 (%)
    FIGURE 52. SAMSUNG ELECTRONICS CO LTD: RESEARCH & DEVELOPMENT EXPENDITURE, 2019-2021
    FIGURE 53. SAMSUNG ELECTRONICS CO LTD: NET REVENUE, 2019-2021 ($MILLION)
    FIGURE 54. SAMSUNG ELECTRONICS CO LTD: REVENUE SHARE BY REGION, 2021 (%)
    FIGURE 55. SAMSUNG ELECTRONICS CO LTD: REVENUE SHARE BY SEGMENT, 2021 (%)
    FIGURE 56. SONY CORPORATION: NET REVENUE, 2019-2021 ($MILLION)
    FIGURE 57. SONY CORPORATION: RESEARCH & DEVELOPMENT EXPENDITURE, 2019-2021
    FIGURE 58. SONY CORPORATION: REVENUE SHARE BY SEGMENT, 2021 (%)
    FIGURE 59. PANASONIC CORPORATION: NET REVENUE, 2019-2021 ($MILLION)
    FIGURE 60. PANASONIC CORPORATION: RESEARCH & DEVELOPMENT EXPENDITURE, 2019-2021
    FIGURE 61. PANASONIC CORPORATION: REVENUE SHARE BY REGION, 2021 (%)
    FIGURE 62. PANASONIC CORPORATION: REVENUE SHARE BY REGION, 2021 (%)
    FIGURE 63. MICRON TECHNOLOGY INC.: RESEARCH & DEVELOPMENT EXPENDITURE, 2019-2021
    FIGURE 64. MICRON TECHNOLOGY INC.: NET REVENUE, 2019-2021 ($MILLION)
    FIGURE 65. MICRON TECHNOLOGY INC.: REVENUE SHARE BY SEGMENT, 2021 (%)
    FIGURE 66. MICRON TECHNOLOGY INC.: REVENUE SHARE BY REGION, 2021 (%)
    FIGURE 67. KINGSTON TECHNOLOGY: NET REVENUE, 2019-2021 ($MILLION)


PURCHASE OPTIONS

Call or Email us

U.S.-Canada Toll-free: +1-800-792-5285
Int'l : +1-503-894-6022
Europe : +44-845-528-1300
Email : help@alliedmarketresearch.com
 
FREQUENTLY ASKED QUESTIONS?

A. The Secure Digital Card Market is expected to grow at a CAGR of 4.29% from 2022-2031.

A. Digital Camera is the leading application of the Secure Digital Card Market.

A. Asia-Pacific is the largest regional market for Secure Digital Card.

A. The industry size of the Secure Digital Card market is estimated to be $8,766.0 million in 2021.

A. The top companies to hold the market share in the Secure Digital Card market are SanDisk Corporation, Transcend Information, ADATA Technology Co., Ltd., Toshiba Corporation, Samsung Electronics Co Ltd., Sony Corporation, Panasonic Corporation, Micron Technology Inc., Kingston Technology, and PNY Technologies Inc.

Looking for Customization?

 Customization Request

Have a Question?

 Speak with Analyst

Any Confusion?

 Inquire Before Buying

Have a glance of the Report

  Request Sample
RELATED TAGS

Purchase Full Report of
Secure Digital Card Market

Start reading instantly.
This Report and over 67,132+ more Reports, Available with Avenue Library. T&C*.

  • Online Only
  • $3,570
  • Online cloud access only
  • Restricted print, copy, paste & download
  • Read only
  • Free industry update
    (Within 180 days)
  • Free report update in next update cycle
    (Jan 2024 - Jan 2025)
  • Data Pack
  • $3,840
  • Restricted to one authorized user
  • One print only
  • Available in
    Excel
  • Free industry update
    (Within 180 days)
  •   Free report update in next update cycle
    (Jan 2024 - Jan 2025)
  • Single User
  • $5,730
  • Restricted to one authorized user
  • One print only
  • Available in
    PDF
  • Free industry update
    (Within 180 days)
  •   Free report update in next update cycle
    (Jan 2024 - Jan 2025)
  • Five Users
  • $6,450
  • Limited to five authorized users
  • Print upto five copies
  • Available in
    PDF
  • Free industry update
    (Within 180 days)
  •   Free report update in next update cycle
    (Jan 2024 - Jan 2025)
  • Enterprise
    License/PDF

  • $9,600
  • Unlimited
    within
    company/enterprise
  • Available in Excel & PDF
  • Free industry update
    (Within 180 days)
  •   Free report update in next update cycle
    (Jan 2024 - Jan 2025)
  • Library
    Membership

  • $999 $ 1,175
    Per User/ Per month/ Billed annually
  • Published Content
    E-access
  • Company Profiles
    E-access
  • Newly Added Content Access
  • 10 PDF
    Downloads
  • 5 Excel Data
    Pack Downloads
  • 250 Company Profiles PDF Downloads
  • Buy Now

*Taxes/Fees, if applicable will be added during checkout. All prices in USD

RELATED REPORTS
 

Why Allied Market Research?


Infallible Methodology

To ensure high-level data integrity, accurate analysis, and impeccable forecasts

Analyst Support

For complete satisfaction

Customization

On-demand customization of scope of the report to exactly meet your needs

TARGETED MARKET VIEW

Targeted market view to provide pertinent information and save time of readers

Get fresh content delivered

Get insights on topics that are crucial for your business. Stay abreast of your interest areas.

Get Industry Data Alerts

Why Allied Market Research?

Infallible Methodology

To ensure high-level data integrity, accurate analysis, and impeccable forecasts

Analyst Support

For complete satisfaction

Customization

On-demand customization of scope of the report to exactly meet your needs

TARGETED MARKET VIEW

Targeted market view to provide pertinent information and save time of readers