0
2022
Self-balancing Mobility Market

Self-Balancing Mobility Market

by Product Type (Single Wheeled and Double Wheeled), Level of Automation (Semi-Autonomous and Fully Autonomous), End Use (Personal Use and Commercial Use) and Vehicle Type (Unicycle, Segway, Hoverboard and Scooter & Bikes): Global Opportunity Analysis and Industry Forecast, 2021-2030

Report Code: A15613
Jan 2022 | Pages: 224
Tables: 131
Charts: 44
  • Formats*:

  • pdf

    Single User License, Five User
    License & Enterprise User License

  • xls

    Data Pack Excel License

  • ppt

    It comes with the additional cost
    of $2500.00 contact sales.


COVID-19

Pandemic disrupted the entire world and affected many industries.

Get detailed COVID-19 impact analysis on the Self-balancing Mobility Market

Request Now !

Self-Balancing Mobility Market Statistics 2030 -

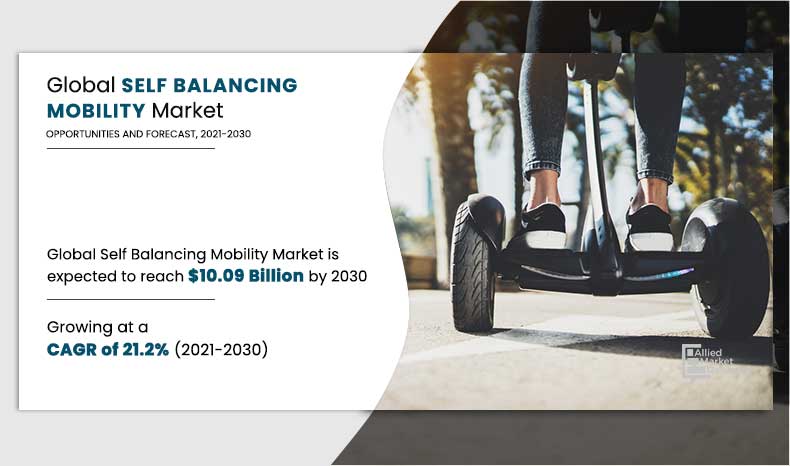
The global self-balancing mobility market was valued at $1.53 billion in 2020, and is projected to reach $10.09 billion by 2030, registering a CAGR of 21.2% from 2021 to 2030.  

The COVID-19 crisis is creating uncertainty in the market by slowing down the supply chains, hampering business growth, and increasing panic among the customer segments. Governments across different regions announced total lockdown and temporary shutdown of industries, which adversely affected the overall production and sales. The global business outlook has changed dramatically post COVID-19 health crisis. Moreover, the overall production activities of market players have declined, owing to operations with limited workforce capacity and inadequate health safety measures along with current demand dynamics of the mobility scooters. As per current scenario, the world is getting back on track slowly with the new restriction and policies to support the economic activities across all industries.The growing inclination toward electric mobility and portability of the self-balancing vehicles, the end users are creating demand for self-balancing mobility in the upcoming days.

Self-balancing mobility includes vehicles that have capability to self-balance during propulsion as well as when the vehicle is in rest position, making it easy for the user to drive the vehicle even for someone who does not know how to ride a vehicle. It uses a self-balancing gyroscopic system for balancing, changing directions depending on the way the rider leans as well as control the vehicle. The increased demand for micromobility along with the need for green mobility vehicles to be present across the globe creates ample opportunities for the growth of the market across the globe. The main components of Self-balancing mobility include gyroscope (to determine the balance), motors (to maintain balance and move the vehicle forwards and backwards), microprocessors and batteries. The self-balancing mobility solutions are eco-friendly, flexible and versatile mode of transport. It helps to reduce traffic congestion due to its compact size.

Self-Balancing-Mobility-Market,-2021-2030

Factors such as rapid urbanization & local commute requirements, inclination toward the use of electric mobility as an eco-friendly & efficient solution and high portability as compared to other personal electric vehicles, supplement the growth of the market across the globe. However, factors such as rise in bike vandalism & theft and inaccuracy & calibration issues in autonomous vehicles, hamper the growth of the market across the globe. Moreover, factors such as continuous product development gains competitive advantage and growing R&D investments for enhanced battery technologies, create ample opportunities for the growth of the market during the forecast period.

Self-Balancing Mobility Market
By Product Type

Your browser does not support the canvas element.

Single Wheeled is projected as the most lucrative segments

Get more information on this report : Request Sample Pages

The self-balancing mobility market report is segmented on the basis of product type, level of automation, end use, vehicle type and region. Depending on product type, the global market has been segmented into single wheeled and double wheeled. By level of automation, the global market has been segmented into semi-autonomous and fully autonomous. By end use, the market has been segmented into personal use and commercial use. By vehicle type, the market has been segmented into unicycle, segway, hoverboard and scooter & bikes. Region wise, the market is analyzed across North America, Europe, Asia-Pacific, and LAMEA. 

The key players operating in the global self-balancing mobility market are Airwheel Holding Limited, Eswingsports, Fosjoas, Freego High-Tech Corporation Ltd., Halo Board, Hangzhou Chic Intelligent Technology Co., Ltd., HoverRobotix, Inmotion Technologies Co., Ltd., Inventist, Inc., IO Hawk Invest, Oxboard B.V., Razor USA LLC, Segway Inc., UBoard and Zhejiang Aerlang Technology Co., Ltd. 

Self-Balancing Mobility Market
By Level Of Automation

Your browser does not support the canvas element.

Fully Autonomous is projected as the most lucrative segments

Get more information on this report : Request Sample Pages

Rapid urbanization and local commute requirements

In the recent years, urbanization has been attaining peak year on year, as majority of the population is shifting to urban areas owing to increase in work opportunities and rapid industrialization. In this era of urbanization, daily commute between the workplace and residence is the need for every individual passenger, which is associated with travel time. Moreover, urban passengers are more inclined toward technologically advanced commute solutions along with its time-effective commute option to avoid unnecessary long traffic congestion along with green mobility. Thus, urban passengers are more dependent on technologically advanced solutions for daily commute, which significantly boosts the demand for self-balancing mobility services across the globe.

Inclination toward the use of electric mobility as an eco-friendly & efficient solution

Continuously growing global fuel emission has been one of the foremost concerns for governments and environmentalists from the past few years. This bolsters the demand for electric mobility vehicles across the globe, thereby supplementing the growth of the market. Furthermore, technological advancements toward offering smart mobility have created numerous opportunities for the growth of global self-balancing mobility market across the globe. In addition, companies operating across the mobility industry have developed and introduced numerous mobility scooters to be used in different industries, thereby supplementing the growth of the market. 

Self-Balancing Mobility Market
By End Use

Your browser does not support the canvas element.

Commercial Use is projected as the most lucrative segments

Get more information on this report : Request Sample Pages

Inaccuracy and calibration issues in autonomous vehicles

Sensors are crucial components of the current fleet of automobiles. They are critically important to enable a whole lot of things in a vehicle; for instance, from existing advanced driver-assistance systems (ADAS) features and automated braking & lane keeping. For highly automated vehicles, the accuracy of sensors becomes more critical. Satisfactorily safe and high accuracy is of utmost importance, and calibration ensures that the vehicle’s sensors are operating at the highest reliability.

Sensors can often get out of calibration due to their daily usage, standard vibrations, vehicle part replacements, or variations in environmental conditions such as temperature. While vehicles getting out of calibration is quite an issue, no common metrics exist as of today that can measure the miscalibration and there are no specific standards that firms can follow. All manufacturers have their own exclusive sensor suites and a complementary set of unique calibration procedures, which further complicates the issues. In addition, a typical ADAS calibration procedure can last anywhere between 15 minutes to 2 hours and necessitates costly equipment. Furthermore, the automobile itself needs to be prepared for thorough testing and recalibration. For instance, tires must be appropriately inflated, the fuel tank has to be full, and vehicle must stand totally flat on a balanced surface. Most garages and technicians are under-prepared and unsatisfactorily skilled to perform a tedious and intricate method. This eventually leads to unsuitable calibration that risks the life of the vehicle’s passengers. Hence, inaccuracy and calibration issues in self-driving vehicles are expected to hinder the growth of the global self-balancing mobility market during the forecast period.

Self-Balancing Mobility Market
By Vehicle Type

Your browser does not support the canvas element.

Scooter & Bikes is projected as the most lucrative segments

Get more information on this report : Request Sample Pages

Continuous product development gains competitive advantage

Small mobility vehicle are new generation personal commute solution and gains momentum in the various nations across the globe. The increasing penetration of the electric mobility and increasing demand for personal commute solution is expected to gain traction in the upcoming decade. Unicycles, segways and hoverboards have been gaining popularity from the last decade and continue in the present era of green mobility.

Moreover, self-balancing scooters & bikes are still undergoing continuous R&D activities to cater to the changing requirements of the end products. The manufacturers need to invest more in R&D activities to develop fully integrated and high-end technologically supported devices. The continuous product development and catering to the changing requirement of the end users are creating competitive advantage. 

Self-Balancing Mobility Market
By Region

2030
Asia-pacific 
North America
Europe
LAMEA

LAMEA would exhibit the highest CAGR of 23.0% during 2021-2030.

Get more information on this report : Request Sample Pages

Covid-19 Impact Analysis

  • The COVID-19 crisis is creating uncertainty in the market by slowing down the supply chains, hampering business growth, and increasing panic among the customer segments.
  • Governments across different regions announced total lockdown and temporary shutdown of industries, which adversely affected the overall production and sales.
  • The global business outlook has changed dramatically post COVID-19 health crisis.
  • Moreover, the overall production activities of market players have declined, owing to operations with limited workforce capacity and inadequate health safety measures along with current demand dynamics of the mobility scooters.
  • As per current scenario, the world is getting back on track slowly with the new restriction and policies to support the economic activities across all industries.
  • The growing inclination toward electric mobility and portability of the self-balancing vehicles, the end users are creating demand for self-balancing mobility in the upcoming days.

Key Benefits For Stakeholders

  • This study presents the analytical depiction of the global self-balancing mobility market analysis along with the current trends and future estimations to depict imminent investment pockets.
  • The overall market opportunity is determined by understanding profitable trends to gain a stronger foothold.
  • The report presents information related to the key drivers, restraints, and opportunities of the market with a detailed impact analysis.
  • The current market is quantitatively analyzed from 2020 to 2030 to benchmark the financial competency.
  • Porter’s five forces analysis illustrates the potency of the buyers and suppliers in the industry.

Self-Balancing Mobility Market Report Highlights

Aspects Details
By Product Type
  • Single wheeled
  • Double wheeled
By LEVEL OF AUTOMATION
  • Semi-autonomous
  • Fully autonomous
By END USE
  • Personal use
  • Commercial use
By VEHICLE TYPE
  • Unicycle
  • Segway
  • Hoverboard
  • Scooter & bikes
By Region
  • North America  (U.S., Canada, Mexico)
  • Europe  (Germany, France, UK, Italy, Rest of Europe)
  • Asia-Pacific  (China, Japan, India, South Korea, Rest of Asia-Pacific)
  • LAMEA  (Latin America, Middle East, Africa)
Key Market Players HoverRobotix, Inventist, Inc, SEGWAY INC., Eswingsports, IO Hawk Invest, Halo Board, Zhejiang Aerlang Technology Co., Ltd, UBoard, Oxboard B.V., INMOTION TECHNOLOGIES CO., LTD, Freego High-Tech Corporation Ltd, Fosjoas, Hangzhou Chic Intelligent Technology Co., Ltd., Airwheel Holding Limited, Razor USA LLC
 

CHAPTER 1:INTRODUCTION

1.1.Report description 
1.2.Key benefits for stakeholders
1.3.Key market segments
1.4.Research methodology

1.4.1.Primary research
1.4.2.Secondary research
1.4.3.Analyst tools and models

CHAPTER 2:EXECUTIVE SUMMARY

2.1.CXO perspective

CHAPTER 3:MARKET OVERVIEW

3.1.Market definition and scope
3.2.Key findings

3.2.1.Top impacting factors
3.2.2.Top investment pockets
3.2.3.Top winning strategies

3.3.Porter’s five forces analysis

3.3.1.Low-to-high bargaining power of suppliers
3.3.2.Low-to-high threat of new entrants
3.3.3.Low-to-high threat of substitutes
3.3.4.Moderate-to-high intensity of rivalry
3.3.5.Moderate-to-high bargaining power of buyers

3.4.Key player positioning, 2020
3.5.Market dynamics

3.5.1.Drivers

3.5.1.1.Rapid urbanization and local commute requirements
3.5.1.2.Inclination toward the use of electric mobility as an eco-friendly & efficient solution
3.5.1.3.High portability as compare to other personal electric vehicles

3.5.2.Restraints

3.5.2.1.Rise in bike vandalism & theft
3.5.2.2.Inaccuracy and calibration issues in autonomous vehicles

3.5.3.Opportunities

3.5.3.1.Continuous product development gains competitive advantage
3.5.3.2.Growing R&D investments for enhanced battery technologies

3.6.COVID-19 impact analysis

3.6.1.Evolution of outbreaks
3.6.2.Macro-economic impact analysis
3.6.3.Micro-economic impact analysis
3.6.4.Impact on industry analysis and future footprints

CHAPTER 4:SELF-BALANCING MOBILITY MARKET, BY PRODUCT TYPE

4.1.Overview
4.2.Single wheeled

4.2.1.Key market trends, growth factors, and opportunities
4.2.2.Market size and forecast, by region
4.2.3.Market analysis by country

4.3.Double wheeled

4.3.1.Key market trends, growth factors, and opportunities
4.3.2.Market size and forecast, by region
4.3.3.Market analysis by country

CHAPTER 5:SELF-BALANCING MOBILITY MARKET, BY LEVEL OF AUTOMATION

5.1.Overview
5.2.Semi-autonomous

5.2.1.Key market trends, growth factors, and opportunities
5.2.2.Market size and forecast, by region
5.2.3.Market analysis by country

5.3.Fully autonomous

5.3.1.Key market trends, growth factors, and opportunities
5.3.2.Market size and forecast, by region
5.3.3.Market analysis by country

CHAPTER 6:SELF-BALANCING MOBILITY MARKET, BY END USE

6.1.Overview
6.2.Personal use

6.2.1.Key market trends, growth factors, and opportunities
6.2.2.Market size and forecast, by region
6.2.3.Market analysis by country

6.3.Commercial use

6.3.1.Key market trends, growth factors, and opportunities
6.3.2.Market size and forecast, by region
6.3.3.Market analysis by country

CHAPTER 7:SELF-BALANCING MOBILITY MARKET, BY VEHICLE TYPE

7.1.Overview
7.2.Unicycle

7.2.1.Key market trends, growth factors, and opportunities
7.2.2.Market size and forecast, by region
7.2.3.Market analysis by country

7.3.Segway

7.3.1.Key market trends, growth factors, and opportunities
7.3.2.Market size and forecast, by region
7.3.3.Market analysis by country

7.4.Hoverboard

7.4.1.Key market trends, growth factors, and opportunities
7.4.2.Market size and forecast, by region
7.4.3.Market analysis by country

7.5.Scooter & bikes

7.5.1.Key market trends, growth factors, and opportunities
7.5.2.Market size and forecast, by region
7.5.3.Market analysis by country

CHAPTER 8:SELF-BALANCING MOBILITY MARKET, BY REGION

8.1.Overview
8.2.North America

8.2.1.Key market trends, growth factors, and opportunities
8.2.2.Market size and forecast, by product type
8.2.3.Market size and forecast, by level of automation
8.2.4.Market size and forecast, by end use
8.2.5.Market size and forecast, by vehicle type
8.2.6.Market analysis by country

8.2.6.1.U.S.

8.2.6.1.1.Market size and forecast, by product type
8.2.6.1.2.Market size and forecast, by level of automation
8.2.6.1.3.Market size and forecast, by end use
8.2.6.1.4.Market size and forecast, by vehicle type

8.2.6.2.Canada

8.2.6.2.1.Market size and forecast, by product type
8.2.6.2.2.Market size and forecast, by level of automation
8.2.6.2.3.Market size and forecast, by end use
8.2.6.2.4.Market size and forecast, by vehicle type

8.2.6.3.Mexico

8.2.6.3.1.Market size and forecast, by product type
8.2.6.3.2.Market size and forecast, by level of automation
8.2.6.3.3.Market size and forecast, by end use
8.2.6.3.4.Market size and forecast, by vehicle type

8.3.Europe

8.3.1.Key market trends, growth factors, and opportunities
8.3.2.Market size and forecast, by product type
8.3.3.Market size and forecast, by level of automation
8.3.4.Market size and forecast, by end use
8.3.5.Market size and forecast, by vehicle type
8.3.6.Market analysis by country

8.3.6.1.Germany

8.3.6.1.1.Market size and forecast, by product type
8.3.6.1.2.Market size and forecast, by level of automation
8.3.6.1.3.Market size and forecast, by end use
8.3.6.1.4.Market size and forecast, by vehicle type

8.3.6.2.France

8.3.6.2.1.Market size and forecast, by product type
8.3.6.2.2.Market size and forecast, by level of automation
8.3.6.2.3.Market size and forecast, by end use
8.3.6.2.4.Market size and forecast, by vehicle type

8.3.6.3.UK

8.3.6.3.1.Market size and forecast, by product type
8.3.6.3.2.Market size and forecast, by level of automation
8.3.6.3.3.Market size and forecast, by end use
8.3.6.3.4.Market size and forecast, by vehicle type

8.3.6.4.Italy

8.3.6.4.1.Market size and forecast, by product type
8.3.6.4.2.Market size and forecast, by level of automation
8.3.6.4.3.Market size and forecast, by end use
8.3.6.4.4.Market size and forecast, by vehicle type

8.3.6.5.Rest of Europe

8.3.6.5.1.Market size and forecast, by product type
8.3.6.5.2.Market size and forecast, by level of automation
8.3.6.5.3.Market size and forecast, by end use
8.3.6.5.4.Market size and forecast, by vehicle type

8.4.Asia-Pacific

8.4.1.Key market trends, growth factors, and opportunities
8.4.2.Market size and forecast, by product type
8.4.3.Market size and forecast, by level of automation
8.4.4.Market size and forecast, by end use
8.4.5.Market size and forecast, by vehicle type
8.4.6.Market analysis by country

8.4.6.1.China

8.4.6.1.1.Market size and forecast, by product type
8.4.6.1.2.Market size and forecast, by level of automation
8.4.6.1.3.Market size and forecast, by end use
8.4.6.1.4.Market size and forecast, by vehicle type

8.4.6.2.Japan

8.4.6.2.1.Market size and forecast, by product type
8.4.6.2.2.Market size and forecast, by level of automation
8.4.6.2.3.Market size and forecast, by end use
8.4.6.2.4.Market size and forecast, by vehicle type

8.4.6.3.India

8.4.6.3.1.Market size and forecast, by product type
8.4.6.3.2.Market size and forecast, by level of automation
8.4.6.3.3.Market size and forecast, by end use
8.4.6.3.4.Market size and forecast, by vehicle type

8.4.6.4.South Korea

8.4.6.4.1.Market size and forecast, by product type
8.4.6.4.2.Market size and forecast, by level of automation
8.4.6.4.3.Market size and forecast, by end use
8.4.6.4.4.Market size and forecast, by vehicle type

8.4.6.5.Rest of Asia-Pacific

8.4.6.5.1.Market size and forecast, by product type
8.4.6.5.2.Market size and forecast, by level of automation
8.4.6.5.3.Market size and forecast, by end use
8.4.6.5.4.Market size and forecast, by vehicle type

8.5.LAMEA

8.5.1.Key market trends, growth factors, and opportunities
8.5.2.Market size and forecast, by product type
8.5.3.Market size and forecast, by level of automation
8.5.4.Market size and forecast, by end use
8.5.5.Market size and forecast, by vehicle type
8.5.6.Market analysis by country

8.5.6.1.Latin America

8.5.6.1.1.Market size and forecast, by product type
8.5.6.1.2.Market size and forecast, by level of automation
8.5.6.1.3.Market size and forecast, by end use
8.5.6.1.4.Market size and forecast, by vehicle type

8.5.6.2.Middle East

8.5.6.2.1.Market size and forecast, by product type
8.5.6.2.2.Market size and forecast, by level of automation
8.5.6.2.3.Market size and forecast, by end use
8.5.6.2.4.Market size and forecast, by vehicle type

8.5.6.3.Africa

8.5.6.3.1.Market size and forecast, by product type
8.5.6.3.2.Market size and forecast, by level of automation
8.5.6.3.3.Market size and forecast, by end use
8.5.6.3.4.Market size and forecast, by vehicle type

CHAPTER 9:COMPANY PROFILES

9.1.Airwheel Holding Limited

9.1.1.Company overview
9.1.2.Company snapshot
9.1.3.Product portfolio

9.2.Eswingsports

9.2.1.Company overview
9.2.2.Company snapshot
9.2.3.Product portfolio

9.3.Fosjoas

9.3.1.Company overview
9.3.2.Company snapshot
9.3.3.Product portfolio
9.3.4.Key strategic moves and developments

9.4.Freego High-Tech Corporation Ltd.

9.4.1.Company overview
9.4.2.Company snapshot
9.4.3.Product portfolio

9.5.Halo Board

9.5.1.Company overview
9.5.2.Company snapshot
9.5.3.Product portfolio

9.6.Hangzhou Chic Intelligent Technology Co., Ltd.

9.6.1.Company overview
9.6.2.Company snapshot
9.6.3.Product portfolio

9.7.HoverRobotix

9.7.1.Company overview
9.7.2.Key executives
9.7.3.Company snapshot
9.7.4.Product portfolio

9.8.INMOTION TECHNOLOGIES CO., LTD.

9.8.1.Company overview
9.8.2.Company snapshot
9.8.3.Product portfolio
9.8.4.Key strategic moves and developments

9.9.Inventist, Inc.

9.9.1.Company overview
9.9.2.Company snapshot
9.9.3.Product portfolio

9.10.IO Hawk Invest

9.10.1.Company overview
9.10.2.Company snapshot
9.10.3.Product portfolio
9.10.4.Key strategic moves and developments

9.11.Oxboard B.V.

9.11.1.Company overview
9.11.2.Company snapshot
9.11.3.Product portfolio

9.12.Razor USA LLC

9.12.1.Company overview
9.12.2.Key executives
9.12.3.Company snapshot
9.12.4.Product portfolio

9.13.SEGWAY INC.

9.13.1.Company overview
9.13.2.Key executives
9.13.3.Company snapshot
9.13.4.Product portfolio
9.13.5.Key strategic moves and developments

9.14.UBoard

9.14.1.Company overview
9.14.2.Company snapshot
9.14.3.Product portfolio

9.15.Zhejiang Aerlang Technology Co., Ltd.

9.15.1.Company overview
9.15.2.Company snapshot
9.15.3.Product portfolio

LIST OF TABLES

TABLE 01.SELF-BALANCING MOBILITY MARKET, BY PRODUCT TYPE, 2020-2030 ($MILLION)
TABLE 02.SELF-BALANCING MOBILITY MARKET REVENUE FOR SINGLE WHEELED, BY REGION, 2020–2030 ($MILLION)
TABLE 03.SELF-BALANCING MOBILITY MARKET REVENUE FOR DOUBLE WHEELED, BY REGION, 2020–2030 ($MILLION)
TABLE 04.GLOBAL SELF-BALANCING MOBILITY MARKET, BY LEVEL OF AUTOMATION, 2020-2030 ($MILLION)
TABLE 05.SEMI-AUTONOMOUS SELF-BALANCING MOBILITY MARKET REVENUE, BY REGION, 2020–2030 ($MILLION)
TABLE 06.FULLY AUTONOMOUS SELF-BALANCING MOBILITY MARKET REVENUE, BY REGION, 2020–2030 ($MILLION)
TABLE 07.SELF-BALANCING MOBILITY MARKET, BY END USE, 2020-2030 ($MILLION)
TABLE 08.SELF-BALANCING MOBILITY MARKET REVENUE FOR PERSONAL USE, BY REGION, 2020–2030 ($MILLION)
TABLE 09.SELF-BALANCING MOBILITY MARKET REVENUE FOR COMMERCIAL USE, BY REGION, 2020–2030 ($MILLION)
TABLE 10.SELF-BALANCING MOBILITY MARKET, BY VEHICLE TYPE, 2020-2030 ($MILLION)
TABLE 11.SELF-BALANCING MOBILITY MARKET REVENUE FOR UNICYCLE, BY REGION, 2020–2030 ($MILLION)
TABLE 12.SELF-BALANCING MOBILITY MARKET REVENUE FOR SEGWAY, BY REGION, 2020–2030 ($MILLION)
TABLE 13.SELF-BALANCING MOBILITY MARKET REVENUE FOR HOVERBOARD, BY REGION, 2020–2030 ($MILLION)
TABLE 14.SELF-BALANCING MOBILITY MARKET REVENUE FOR SCOOTER & BIKES, BY REGION, 2020–2030 ($MILLION)
TABLE 15.NORTH AMERICA SELF-BALANCING MOBILITY MARKET, BY PRODUCT TYPE, 2020–2030 ($MILLION)
TABLE 16.NORTH AMERICA SELF-BALANCING MOBILITY MARKET, BY LEVEL OF AUTOMATION, 2020–2030 ($MILLION)
TABLE 17.NORTH AMERICA SELF-BALANCING MOBILITY MARKET, BY END USE, 2020–2030 ($MILLION)
TABLE 18.NORTH AMERICA SELF-BALANCING MOBILITY MARKET, BY VEHICLE TYPE, 2020–2030 ($MILLION)
TABLE 19.U.S. SELF-BALANCING MOBILITY MARKET, BY PRODUCT TYPE, 2020–2030 ($MILLION)
TABLE 20.U.S. SELF-BALANCING MOBILITY MARKET, BY LEVEL OF AUTOMATION, 2020–2030 ($MILLION)
TABLE 21.U.S. SELF-BALANCING MOBILITY MARKET, BY END USE, 2020–2030 ($MILLION)
TABLE 22.U.S. SELF-BALANCING MOBILITY MARKET, BY VEHICLE TYPE, 2020–2030 ($MILLION)
TABLE 23.CANADA SELF-BALANCING MOBILITY MARKET, BY PRODUCT TYPE, 2020–2030 ($MILLION)
TABLE 24.CANADA SELF-BALANCING MOBILITY MARKET, BY LEVEL OF AUTOMATION, 2020–2030 ($MILLION)
TABLE 25.CANADA SELF-BALANCING MOBILITY MARKET, BY END USE, 2020–2030 ($MILLION)
TABLE 26.CANADA SELF-BALANCING MOBILITY MARKET, BY VEHICLE TYPE, 2020–2030 ($MILLION)
TABLE 27.MEXICO SELF-BALANCING MOBILITY MARKET, BY PRODUCT TYPE, 2020–2030 ($MILLION)
TABLE 28.MEXICO SELF-BALANCING MOBILITY MARKET, BY LEVEL OF AUTOMATION, 2020–2030 ($MILLION)
TABLE 29.MEXICO SELF-BALANCING MOBILITY MARKET, BY END USE, 2020–2030 ($MILLION)
TABLE 30.MEXICO SELF-BALANCING MOBILITY MARKET, BY VEHICLE TYPE, 2020–2030 ($MILLION)
TABLE 31.EUROPE SELF-BALANCING MOBILITY MARKET, BY PRODUCT TYPE, 2020–2030 ($MILLION)
TABLE 32.EUROPE SELF-BALANCING MOBILITY MARKET, BY LEVEL OF AUTOMATION, 2020–2030 ($MILLION)
TABLE 33.EUROPE SELF-BALANCING MOBILITY MARKET, BY END USE, 2020–2030 ($MILLION)
TABLE 34.EUROPE SELF-BALANCING MOBILITY MARKET, BY VEHICLE TYPE, 2020–2030 ($MILLION)
TABLE 35.GERMANY SELF-BALANCING MOBILITY MARKET, BY PRODUCT TYPE, 2020–2030 ($MILLION)
TABLE 36.GERMANY SELF-BALANCING MOBILITY MARKET, BY LEVEL OF AUTOMATION, 2020–2030 ($MILLION)
TABLE 37.GERMANY SELF-BALANCING MOBILITY MARKET, BY END USE, 2020–2030 ($MILLION)
TABLE 38.GERMANY SELF-BALANCING MOBILITY MARKET, BY VEHICLE TYPE, 2020–2030 ($MILLION)
TABLE 39.FRANCE SELF-BALANCING MOBILITY MARKET, BY PRODUCT TYPE, 2020–2030 ($MILLION)
TABLE 40.FRANCE SELF-BALANCING MOBILITY MARKET, BY LEVEL OF AUTOMATION, 2020–2030 ($MILLION)
TABLE 41.FRANCE SELF-BALANCING MOBILITY MARKET, BY END USE, 2020–2030 ($MILLION)
TABLE 42.FRANCE SELF-BALANCING MOBILITY MARKET, BY VEHICLE TYPE, 2020–2030 ($MILLION)
TABLE 43.UK SELF-BALANCING MOBILITY MARKET, BY PRODUCT TYPE, 2020–2030 ($MILLION)
TABLE 44.UK SELF-BALANCING MOBILITY MARKET, BY LEVEL OF AUTOMATION, 2020–2030 ($MILLION)
TABLE 45.UK SELF-BALANCING MOBILITY MARKET, BY END USE, 2020–2030 ($MILLION)
TABLE 46.UK SELF-BALANCING MOBILITY MARKET, BY VEHICLE TYPE, 2020–2030 ($MILLION)
TABLE 47.ITALY SELF-BALANCING MOBILITY MARKET, BY PRODUCT TYPE, 2020–2030 ($MILLION)
TABLE 48.ITALY SELF-BALANCING MOBILITY MARKET, BY LEVEL OF AUTOMATION, 2020–2030 ($MILLION)
TABLE 49.ITALY SELF-BALANCING MOBILITY MARKET, BY END USE, 2020–2030 ($MILLION)
TABLE 50.ITALY SELF-BALANCING MOBILITY MARKET, BY VEHICLE TYPE, 2020–2030 ($MILLION)
TABLE 51.REST OF EUROPE SELF-BALANCING MOBILITY MARKET, BY PRODUCT TYPE, 2020–2030 ($MILLION)
TABLE 52.REST OF EUROPE SELF-BALANCING MOBILITY MARKET, BY LEVEL OF AUTOMATION, 2020–2030 ($MILLION)
TABLE 53.REST OF EUROPE SELF-BALANCING MOBILITY MARKET, BY END USE, 2020–2030 ($MILLION)
TABLE 54.REST OF EUROPE SELF-BALANCING MOBILITY MARKET, BY VEHICLE TYPE, 2020–2030 ($MILLION)
TABLE 55.ASIA-PACIFIC SELF-BALANCING MOBILITY MARKET, BY PRODUCT TYPE, 2020–2030 ($MILLION)
TABLE 56.ASIA-PACIFIC SELF-BALANCING MOBILITY MARKET, BY LEVEL OF AUTOMATION, 2020–2030 ($MILLION)
TABLE 57.ASIA-PACIFIC SELF-BALANCING MOBILITY MARKET, BY END USE, 2020–2030 ($MILLION)
TABLE 58.ASIA-PACIFIC SELF-BALANCING MOBILITY MARKET, BY VEHICLE TYPE, 2020–2030 ($MILLION)
TABLE 59.CHINA SELF-BALANCING MOBILITY MARKET, BY PRODUCT TYPE, 2020–2030 ($MILLION)
TABLE 60.CHINA SELF-BALANCING MOBILITY MARKET, BY LEVEL OF AUTOMATION, 2020–2030 ($MILLION)
TABLE 61.CHINA SELF-BALANCING MOBILITY MARKET, BY END USE, 2020–2030 ($MILLION)
TABLE 62.CHINA SELF-BALANCING MOBILITY MARKET, BY VEHICLE TYPE, 2020–2030 ($MILLION)
TABLE 63.JAPAN SELF-BALANCING MOBILITY MARKET, BY PRODUCT TYPE, 2020–2030 ($MILLION)
TABLE 64.JAPAN SELF-BALANCING MOBILITY MARKET, BY LEVEL OF AUTOMATION, 2020–2030 ($MILLION)
TABLE 65.JAPAN SELF-BALANCING MOBILITY MARKET, BY END USE, 2020–2030 ($MILLION)
TABLE 66.JAPAN SELF-BALANCING MOBILITY MARKET, BY VEHICLE TYPE, 2020–2030 ($MILLION)
TABLE 67.INDIA SELF-BALANCING MOBILITY MARKET, BY PRODUCT TYPE, 2020–2030 ($MILLION)
TABLE 68.INDIA SELF-BALANCING MOBILITY MARKET, BY LEVEL OF AUTOMATION, 2020–2030 ($MILLION)
TABLE 69.INDIA SELF-BALANCING MOBILITY MARKET, BY END USE, 2020–2030 ($MILLION)
TABLE 70.INDIA SELF-BALANCING MOBILITY MARKET, BY VEHICLE TYPE, 2020–2030 ($MILLION)
TABLE 71.SOUTH KOREA SELF-BALANCING MOBILITY MARKET, BY PRODUCT TYPE, 2020–2030 ($MILLION)
TABLE 72.SOUTH KOREA SELF-BALANCING MOBILITY MARKET, BY LEVEL OF AUTOMATION, 2020–2030 ($MILLION)
TABLE 73.SOUTH KOREA SELF-BALANCING MOBILITY MARKET, BY END USE, 2020–2030 ($MILLION)
TABLE 74.SOUTH KOREA SELF-BALANCING MOBILITY MARKET, BY VEHICLE TYPE, 2020–2030 ($MILLION)
TABLE 75.REST OF ASIA-PACIFIC SELF-BALANCING MOBILITY MARKET, BY PRODUCT TYPE, 2020–2030 ($MILLION)
TABLE 76.REST OF ASIA-PACIFIC SELF-BALANCING MOBILITY MARKET, BY LEVEL OF AUTOMATION, 2020–2030 ($MILLION)
TABLE 77.REST OF ASIA-PACIFIC SELF-BALANCING MOBILITY MARKET, BY END USE, 2020–2030 ($MILLION)
TABLE 78.REST OF ASIA-PACIFIC SELF-BALANCING MOBILITY MARKET, BY VEHICLE TYPE, 2020–2030 ($MILLION)
TABLE 79.LAMEA SELF-BALANCING MOBILITY MARKET, BY PRODUCT TYPE, 2020–2030 ($MILLION)
TABLE 80.LAMEA SELF-BALANCING MOBILITY MARKET, BY LEVEL OF AUTOMATION, 2020–2030 ($MILLION)
TABLE 81.LAMEA SELF-BALANCING MOBILITY MARKET, BY END USE, 2020–2030 ($MILLION)
TABLE 82.LAMEA SELF-BALANCING MOBILITY MARKET, BY VEHICLE TYPE, 2020–2030 ($MILLION)
TABLE 83.LATIN AMERICA SELF-BALANCING MOBILITY MARKET, BY PRODUCT TYPE, 2020–2030 ($MILLION)
TABLE 84.LATIN AMERICA SELF-BALANCING MOBILITY MARKET, BY LEVEL OF AUTOMATION, 2020–2030 ($MILLION)
TABLE 85.LATIN AMERICA SELF-BALANCING MOBILITY MARKET, BY END USE, 2020–2030 ($MILLION)
TABLE 86.LATIN AMERICA SELF-BALANCING MOBILITY MARKET, BY VEHICLE TYPE, 2020–2030 ($MILLION)
TABLE 87.MIDDLE EAST SELF-BALANCING MOBILITY MARKET, BY PRODUCT TYPE, 2020–2030 ($MILLION)
TABLE 88.MIDDLE EAST SELF-BALANCING MOBILITY MARKET, BY LEVEL OF AUTOMATION, 2020–2030 ($MILLION)
TABLE 89.MIDDLE EAST SELF-BALANCING MOBILITY MARKET, BY END USE, 2020–2030 ($MILLION)
TABLE 90.MIDDLE EAST SELF-BALANCING MOBILITY MARKET, BY VEHICLE TYPE, 2020–2030 ($MILLION)
TABLE 91.AFRICA SELF-BALANCING MOBILITY MARKET, BY PRODUCT TYPE, 2020–2030 ($MILLION)
TABLE 92.AFRICA SELF-BALANCING MOBILITY MARKET, BY LEVEL OF AUTOMATION, 2020–2030 ($MILLION)
TABLE 93.AFRICA SELF-BALANCING MOBILITY MARKET, BY END USE, 2020–2030 ($MILLION)
TABLE 94.AFRICA SELF-BALANCING MOBILITY MARKET, BY VEHICLE TYPE, 2020–2030 ($MILLION)
TABLE 95.AIRWHEEL HOLDING LIMITED: COMPANY SNAPSHOT
TABLE 96.AIRWHEEL HOLDING LIMITED: PRODUCT PORTFOLIO
TABLE 97.ESWINGSPORTS: COMPANY SNAPSHOT
TABLE 98.ESWINGSPORTS: PRODUCT PORTFOLIO
TABLE 99.FOSJOAS: COMPANY SNAPSHOT
TABLE 100.FOSJOAS: PRODUCT PORTFOLIO
TABLE 101.FOSJOAS: KEY STRATEGIC MOVES AND DEVELOPMENTS
TABLE 102.FREEGO HIGH-TECH CORPORATION LTD.: COMPANY SNAPSHOT
TABLE 103.FREEGO HIGH-TECH CORPORATION LTD.: PRODUCT PORTFOLIO
TABLE 104.HALO BOARD: COMPANY SNAPSHOT
TABLE 105.HALO BOARD: PRODUCT PORTFOLIO
TABLE 106.HANGZHOU CHIC INTELLIGENT TECHNOLOGY CO., LTD.: COMPANY SNAPSHOT
TABLE 107.HANGZHOU CHIC INTELLIGENT TECHNOLOGY CO., LTD.: PRODUCT PORTFOLIO
TABLE 108.HOVERROBOTIX: KEY EXECUTIVES
TABLE 109.HOVERROBOTIX: COMPANY SNAPSHOT
TABLE 110.HOVERROBOTIX: PRODUCT PORTFOLIO
TABLE 111.INMOTION TECHNOLOGIES CO., LTD.: COMPANY SNAPSHOT
TABLE 112.INMOTION TECHNOLOGIES CO., LTD.: PRODUCT PORTFOLIO
TABLE 113.INMOTION TECHNOLOGIES CO., LTD.: KEY STRATEGIC MOVES AND DEVELOPMENTS
TABLE 114.INVENTIST, INC.: COMPANY SNAPSHOT
TABLE 115.INVENTIST, INC.: PRODUCT PORTFOLIO
TABLE 116.IO HAWK INVEST: COMPANY SNAPSHOT
TABLE 117.IO HAWK INVEST.: PRODUCT PORTFOLIO
TABLE 118.IO HAWK INVEST.: KEY STRATEGIC MOVES AND DEVELOPMENTS
TABLE 119.OXBOARD B.V.: COMPANY SNAPSHOT
TABLE 120.OXBOARD B.V.: PRODUCT PORTFOLIO
TABLE 121.RAZOR USA LLC: KEY EXECUTIVES
TABLE 122.RAZOR USA LLC: COMPANY SNAPSHOT
TABLE 123.RAZOR USA LLC: PRODUCT PORTFOLIO
TABLE 124.SEGWAY INC.: KEY EXECUTIVES
TABLE 125.SEGWAY INC.: COMPANY SNAPSHOT
TABLE 126.SEGWAY INC.: PRODUCT PORTFOLIO
TABLE 127.SEGWAY INC.: KEY STRATEGIC MOVES AND DEVELOPMENTS
TABLE 128.UBOARD: COMPANY SNAPSHOT
TABLE 129.UBOARD: PRODUCT PORTFOLIO
TABLE 130.ZHEJIANG AERLANG TECHNOLOGY CO., LTD.: COMPANY SNAPSHOT
TABLE 131.ZHEJIANG AERLANG TECHNOLOGY CO., LTD.: PRODUCT PORTFOLIO

LIST OF FIGURES

FIGURE 01.KEY MARKET SEGMENTS
FIGURE 02.GLOBAL SELF BALANCING MOBILITY MARKET SNAPSHOT, BY SEGMENTATION, 2021–2030
FIGURE 03.SELF BALANCING MOBILITY MARKET SNAPSHOT, BY REGION, 2021–2030
FIGURE 04.TOP IMPACTING FACTORS
FIGURE 05.TOP INVESTMENT POCKETS
FIGURE 06.TOP WINNING STRATEGIES, BY YEAR, 2018-2021*
FIGURE 07.TOP WINNING STRATEGIES, BY DEVELOPMENT, 2018-2021*
FIGURE 08.TOP WINNING STRATEGIES, BY COMPANY, 2018-2021*
FIGURE 09.KEY PLAYER POSITIONING, 2020
FIGURE 10.SELF-BALANCING MOBILITY MARKET, BY PRODUCT TYPE, 2020-2030
FIGURE 11.COMPARATIVE SHARE ANALYSIS OF SELF-BALANCING MOBILITY MARKET FOR SINGLE WHEELED, BY COUNTRY, 2020 & 2030 ($MILLION)
FIGURE 12.COMPARATIVE SHARE ANALYSIS OF SELF-BALANCING MOBILITY MARKET FOR DOUBLE WHEELED,  BY COUNTRY, 2020 & 2030 ($MILLION)
FIGURE 13.SELF-BALANCING MOBILITY MARKET, BY LEVEL OF AUTOMATION, 2020-2030
FIGURE 14.COMPARATIVE SHARE ANALYSIS OF SEMI-AUTONOMOUS SELF-BALANCING MOBILITY MARKET, BY COUNTRY, 2020 & 2030 ($MILLION)
FIGURE 15.COMPARATIVE SHARE ANALYSIS OF FULLY AUTONOMOUS SELF-BALANCING MOBILITY MARKET, BY COUNTRY, 2020 & 2030 ($MILLION)
FIGURE 16.SELF-BALANCING MOBILITY MARKET, BY END USE, 2020-2030
FIGURE 17.COMPARATIVE SHARE ANALYSIS OF SELF-BALANCING MOBILITY MARKET FOR PERSONAL USE, BY COUNTRY, 2020 & 2030 ($MILLION)
FIGURE 18.COMPARATIVE SHARE ANALYSIS OF SELF-BALANCING MOBILITY MARKET FOR COMMERCIAL USE, BY COUNTRY, 2020 & 2030 ($MILLION)
FIGURE 19.SELF-BALANCING MOBILITY MARKET, BY VEHICLE TYPE, 2020-2030
FIGURE 20.COMPARATIVE SHARE ANALYSIS OF SELF-BALANCING MOBILITY MARKET FOR UNICYCLE, BY COUNTRY, 2020 & 2030 ($MILLION)
FIGURE 21.COMPARATIVE SHARE ANALYSIS OF SELF-BALANCING MOBILITY MARKET FOR SEGWAY, BY COUNTRY, 2020 & 2030 ($MILLION)
FIGURE 22.COMPARATIVE SHARE ANALYSIS OF SELF-BALANCING MOBILITY MARKET FOR HOVERBOARD, BY COUNTRY, 2020 & 2030 ($MILLION)
FIGURE 23.COMPARATIVE SHARE ANALYSIS OF SELF-BALANCING MOBILITY MARKET FOR SCOOTER & BIKES, BY COUNTRY, 2020 & 2030 ($MILLION)
FIGURE 24.SELF-BALANCING MOBILITY MARKET, BY REGION, 2020-2030 (%)
FIGURE 25.COMPARATIVE SHARE ANALYSIS OF SELF-BALANCING MOBILITY MARKET, BY COUNTRY, 2020–2030 (%)
FIGURE 26.U.S. SELF-BALANCING MOBILITY MARKET, 2020–2030 ($MILLION)
FIGURE 27.CANADA SELF-BALANCING MOBILITY MARKET, 2020–2030 ($MILLION)
FIGURE 28.MEXICO SELF-BALANCING MOBILITY MARKET, 2020–2030 ($MILLION)
FIGURE 29.COMPARATIVE SHARE ANALYSIS OF SELF-BALANCING MOBILITY MARKET, BY COUNTRY, 2020–2030 (%)
FIGURE 30.GERMANY SELF-BALANCING MOBILITY MARKET, 2020–2030 ($MILLION)
FIGURE 31.FRANCE SELF-BALANCING MOBILITY MARKET, 2020–2030 ($MILLION)
FIGURE 32.UK SELF-BALANCING MOBILITY MARKET, 2020–2030 ($MILLION)
FIGURE 33.ITALY SELF-BALANCING MOBILITY MARKET, 2020–2030 ($MILLION)
FIGURE 34.REST OF EUROPE SELF-BALANCING MOBILITY MARKET, 2020–2030 ($MILLION)
FIGURE 35.COMPARATIVE SHARE ANALYSIS OF SELF-BALANCING MOBILITY MARKET, BY COUNTRY, 2020–2030 (%)
FIGURE 36.CHINA SELF-BALANCING MOBILITY MARKET, 2020–2030 ($MILLION)
FIGURE 37.JAPAN SELF-BALANCING MOBILITY MARKET, 2020–2030 ($MILLION)
FIGURE 38.INDIA SELF-BALANCING MOBILITY MARKET, 2020–2030 ($MILLION)
FIGURE 39.SOUTH KOREA SELF-BALANCING MOBILITY MARKET, 2020–2030 ($MILLION)
FIGURE 40.REST OF ASIA-PACIFIC SELF-BALANCING MOBILITY MARKET, 2020–2030 ($MILLION)
FIGURE 41.COMPARATIVE SHARE ANALYSIS OF SELF-BALANCING MOBILITY MARKET, BY COUNTRY, 2020–2030 (%)
FIGURE 42.LATIN AMERICA SELF-BALANCING MOBILITY MARKET, 2020–2030 ($MILLION)
FIGURE 43.MIDDLE EAST SELF-BALANCING MOBILITY MARKET, 2020–2030 ($MILLION)
FIGURE 44.AFRICA SELF-BALANCING MOBILITY MARKET, 2020–2030 ($MILLION)


Self-balancing mobility includes vehicles with a capability to self-balance during propulsion as well as when in rest position, making it easy for the user to drive the vehicle even for someone who does not know how to ride a vehicle. The market is supplemented by numerous developments carried out by the top self-balancing mobility manufacturers. Moreover, technological advancements in automotive industry has created a positive impact on the growth of the global self-balancing mobility market.

In addition, the increased inclination toward the need for green mobility and micromobility has created numerous opportunities for the growth of the market across the globe. Moreover, government initiatives toward reducing carbon footprint has also created ample opportunities for the growth of the market across the globe along with key manufacturers to develop scooter & bike models that offer numerous features such as self-balancing & self-propelling. Moreover, the developments carried out by the key companies towards the introduction of advanced micromobility vehicles also creates a wider scope for the growth of the market across the globe.

Factors such as rapid urbanization & local commute requirements, inclination toward the use of electric mobility as an eco-friendly & efficient solution and high portability as compared to other personal electric vehicles supplements the growth of the market across the globe. However, factors such as rise in bike vandalism & theft and inaccuracy & calibration issues in autonomous vehicles hampers the growth of the market across the globe. Moreover, factors such as continuous product development, gain competitive advantage and growing R&D investments for enhanced battery technologies create ample opportunities for the growth of the market during the forecast period.

Among the analyzed regions, Asia-Pacific is the highest revenue contributor, followed by Europe, North America and LAMEA. On the basis of forecast analysis, LAMEA is expected to maintain its lead during the forecast period, owing to increased inclination for self-balancing mobility across LAMEA.

PURCHASE OPTIONS

Call or Email us

U.S.-Canada Toll-free: +1-800-792-5285
Int'l : +1-503-894-6022
Europe : +44-845-528-1300
Email : help@alliedmarketresearch.com
 
FREQUENTLY ASKED QUESTIONS?

A. The global self balancing mobility market was valued at $1.53 billion in 2020, and is projected to reach $10.09 billion by 2030, registering a CAGR of 21.2% from 2021 to 2030.

A. The increased demand for micromobility along with the need for green mobility vehicles to be present across the globe creates ample opportunities for the growth of the market

A. The report sample for global self-balancing mobility market report can be obtained on demand from the website

A. Factors such as rapid urbanization & local commute requirements, inclination toward the use of electric mobility as an eco-friendly & efficient solution and high portability as compared to other personal electric vehicles supplements the growth of the market across the globe

A. Continuous product development gains competitive advantage and growing R&D investments for enhanced battery technologies creates ample opportunities for the growth of the market

A. The company profiles of the top players of the market can be obtained from the company profile section mentioned in the report. This section includes analysis of top player’s operating in the industry along with their last three-year revenue, segmental revenue, product offerings, key strategies adopted, and geographical revenue generated

A. The increased inclination toward the need for green mobility and micromobility has created numerous opportunities for the growth of the market across the globe

A. By product type, the doubled weeled segment held the largest share in self-balancing mobility market

A. Asia Pacific is the most lucritive segment in self-balancing mobility market

A. The key players operating in the global Self-Balancing mobility market are Airwheel Holding Limited, Eswingsports, Fosjoas, Freego High-Tech Corporation Ltd., Halo Board, Hangzhou Chic Intelligent Technology Co., Ltd., HoverRobotix, Inmotion Technologies Co., Ltd., Inventist, Inc., IO Hawk Invest, Oxboard B.V., Razor USA LLC, Segway Inc., UBoard and Zhejiang Aerlang Technology Co., Ltd

Looking for Customization?

 Customization Request

Have a Question?

 Speak with Analyst

Any Confusion?

 Inquire Before Buying

Have a glance of the Report

  Request Sample
RELATED TAGS

Purchase Full Report of
Self-balancing Mobility Market

Start reading instantly.
This Report and over 66,804+ more Reports, Available with Avenue Library. T&C*.

  • Online Only
  • $3,456
  • Online cloud access only
  • Restricted print, copy, paste & download
  • Read only
  • Free industry update
    (Within 180 days)
  • Free report update in next update cycle
    (Jan 2023 - Jan 2024)
  • Data Pack
  • $3,840
  • Restricted to one authorized user
  • One print only
  • Available in
    Excel
  • Free industry update
    (Within 180 days)
  •   Free report update in next update cycle
    (Jan 2023 - Jan 2024)
  • Single User
  • $5,769
  • Restricted to one authorized user
  • One print only
  • Available in
    PDF
  • Free industry update
    (Within 180 days)
  •   Free report update in next update cycle
    (Jan 2023 - Jan 2024)
  • Five Users
  • $6,450
  • Limited to five authorized users
  • Print upto five copies
  • Available in
    PDF
  • Free industry update
    (Within 180 days)
  •   Free report update in next update cycle
    (Jan 2023 - Jan 2024)
  • Enterprise
    License/PDF

  • $10,995
  • Unlimited
    within
    company/enterprise
  • Available in Excel & PDF
  • Free industry update
    (Within 180 days)
  •   Free report update in next update cycle
    (Jan 2023 - Jan 2024)
  • Library
    Membership

  • $999 $ 1,175
    Per User/ Per month/ Billed annually
  • Published Content
    E-access
  • Company Profiles
    E-access
  • Newly Added Content Access
  • 10 PDF
    Downloads
  • 5 Excel Data
    Pack Downloads
  • 250 Company Profiles PDF Downloads
  • Buy Now

*Taxes/Fees, if applicable will be added during checkout. All prices in USD

RELATED REPORTS
 

Why Allied Market Research?


Infallible Methodology

To ensure high-level data integrity, accurate analysis, and impeccable forecasts

Analyst Support

For complete satisfaction

Customization

On-demand customization of scope of the report to exactly meet your needs

TARGETED MARKET VIEW

Targeted market view to provide pertinent information and save time of readers

Get fresh content delivered

Get insights on topics that are crucial for your business. Stay abreast of your interest areas.

Get Industry Data Alerts

Why Allied Market Research?

Infallible Methodology

To ensure high-level data integrity, accurate analysis, and impeccable forecasts

Analyst Support

For complete satisfaction

Customization

On-demand customization of scope of the report to exactly meet your needs

TARGETED MARKET VIEW

Targeted market view to provide pertinent information and save time of readers