Report Code: A15442 | Jul 2022 | Pages: 261 | ||
Tables: 209 | Charts: 45 |
|
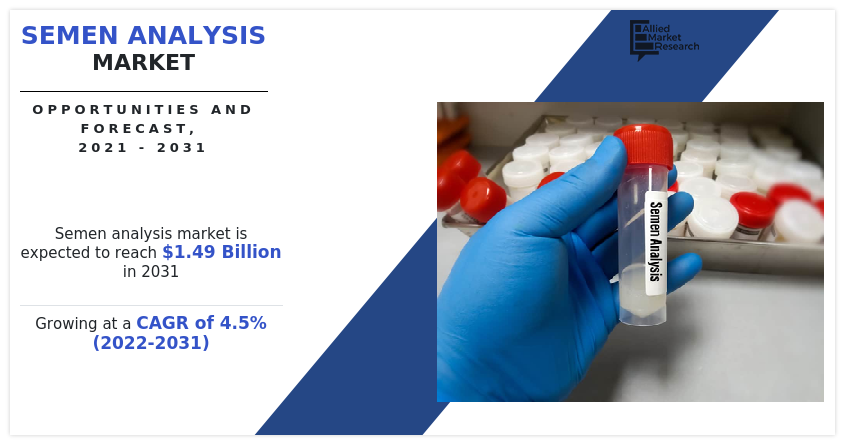
The global semen analysis market was valued at $955.47 million in 2021, and is projected to reach $1.49 billion by 2031, growing at a CAGR of 4.5% from 2022 to 2031. Semen analysis is the term used for the laboratory techniques and procedures that are performed to measure sperm parameters, including number, motility, morphology and viability. Semen analysis is commonly performed to assess male factor infertility. A routine semen analysis should include: physical characteristics of semen (color, odor, pH, viscosity and liquefaction), volume, concentration, morphology and sperm motility and progression. To provide a correct result it is necessary to perform at least two, preferably three, separate seminal analyses with an interval between them of seven days to three months.
The COVID-19 pandemic negatively impacted the global semen analysis market initially in 2020 due to global economic recession led by COVID-19. However, the market is anticipated to witness recovery in 2021, and witness stable growth for semen analysis in the coming future.
Growth in incidences of male infertility, and increase in awareness regarding fertility testing in both developed and developing countries are some factors that boost the growth of the semen analysis market size. In addition, innovation and advancement in male fertility testing such as automation in sperm analysis further boost the growth of the semen analysis market size. However, lack of awareness in economically poor countries about semen analysis is a restraining factor that may hamper the semen analysis market growth. On the contrary, sales of male fertility testing kits on online platform and growth potential of emerging economies create an semen analysis market opportunity for the manufacturers to tap and capitalize on the market.
Coronavirus severe acute respiration syndrome (SARS-CoV-2) is an infectious disease caused by the novel coronavirus (COVID-19), which originated in the Wuhan district in China in the late 2019, and since has spread to 212 countries. The virus was initially referred to as “novel coronavirus 2019” (2019-nCoV) by the WHO, However, on February 11, 2020, it was given the official name of SARS-CoV-2 by the International Committee on Taxonomy of Viruses. WHO declared COVID-19 as pandemic on March 11, 2020, and by September 1, 2020, over 28.1 million people have been infected globally with over 909,000 death. COVID-19 symptoms include fever, cough, and shortness of breath.
The COVID-19 pandemic in 2020 led to slow down in availability of the products for home care settings and shut down of fertility clinics to avail fertility services such as semen analysis which affect the semen analysis Industry. The COVID-19 pandemic has affected fertility clinics, owing to shutdowns in various COVID-19 affected countries and rise in number of healthcare workers falling ill in the pandemic, which is why people were unable to come to fertility clinic and diagnostic laboratories for semen analysis and treatment. However, in 2021, authorities are granting permission to slowly starting the fertility services in various regions of the world ensuring the implication of provided guidelines. For instance, the permission to open the fertility clinics were given by Human Fertilization and Embryology Authority (HFEA) in the UK on January 5, 2021.
The Human Reproduction Societies (HRS) have issued guidelines for practice during COVID-19 pandemic that include implementation of mitigation practices and infection control protocols in fertility care units. Moreover, the country like Canada have dedicated funds to support COVID-19 research.
SEMEN ANALYSIS MARKET SEGMENTATION
The semen analysis market are segmented into product, age group, end user and region. According to product, the market is categorized into semen analyzers, centrifuges for sample preparation, semen test kits, disposables & consumables, and software. Semen analyzer segment further sub-segmented into manual semen analyzer, and automated semen analyzer. By age group, it is segregated into 34 and below 34 years, 35-40 years, and 41 and greater than 41 years. On the basis of end user, it is segmented into fertility centers, hospitals, diagnostic laboratories, and others. Region wise, it is analyzed across North America, Europe, Asia-Pacific, and LAMEA.
Segment Review
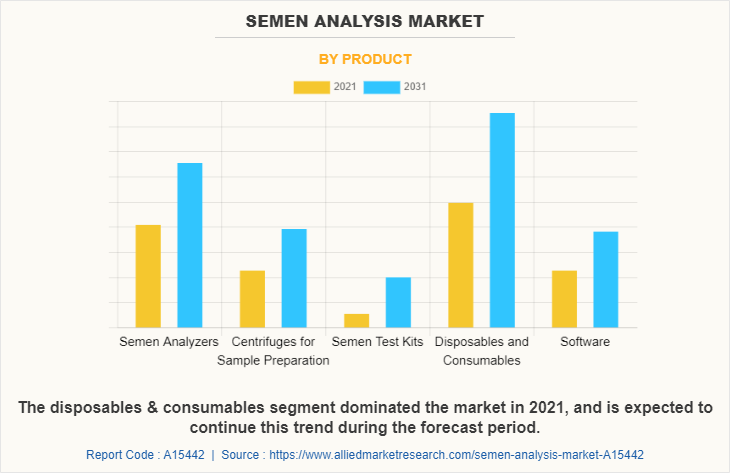
On the basis of product, it is segmented into semen analyzers, centrifuges for sample preparation, semen test kits, disposables & consumables, and software. The consumable & disposable segment dominated the global semen analysis market share in 2021 and is anticipated to continue this trend during the forecast period. This is attributed to their limited durability as well as growth in adoption of consumables & disposable during semen analysis testing. However, semen test kits segment registered highest CAGR during forecast period, owing to increase in adoption of semen test kits for home-use due to its reliable quality and easily interpretable results.
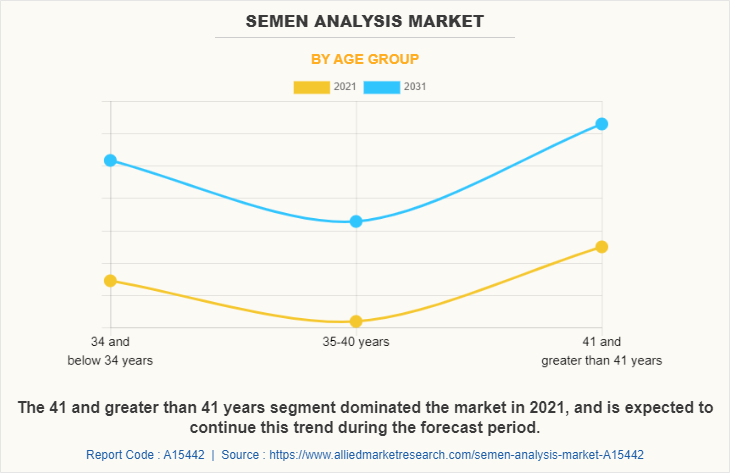
On the basis of age group, it is divided into 34 and below 34 years, 35-40 years, and 41 and greater than 41 years. The 41 and greater than 41 years segment dominated the global market in 2021 and is anticipated to continue this trend during the forecast period. This is attributed to increase in prevalence of infertility in age between 41 and greater than 41 years. However, 35-40years segment registered highest growth registering CAGR of 4.8% during semen analysis market forecast owing to increase in the use of semen analysis tests by men between the ages of 35 and 40 to monitor sperm count and male fertility.
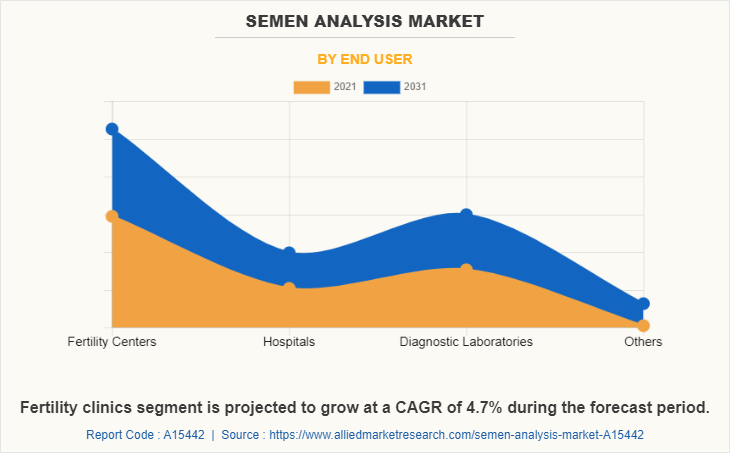
On the basis of end user, it is classified into fertility centers, hospitals, diagnostic laboratories, and others that include research institutes and home care setting. The fertility centers held the largest market share in 2021 and is expected to remain dominant throughout the forecast period owing to increase in the number of the infertility rates of the population as well as increase in IVF procedure and vasectomy performed in fertility centers.
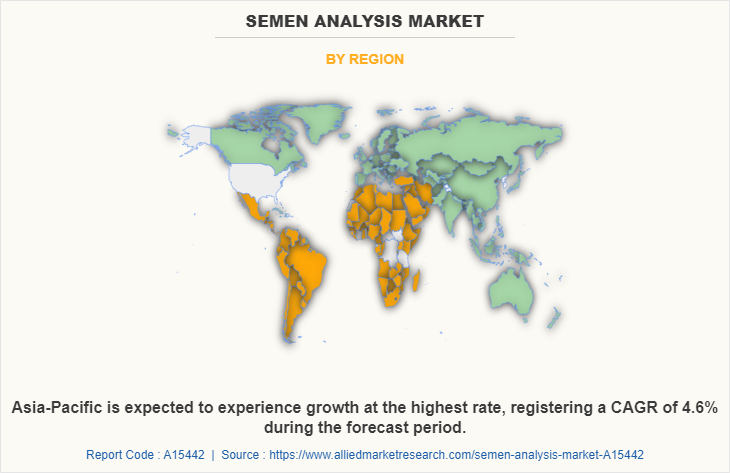
On the basis of region, the market is analyzed across North America, Europe, Asia-Pacific, and LAMEA. Asia-Pacific is predicted to dominate the growth of the semen analysis market due to surge in infertility cases and rise in awareness regarding semen analysis testing among the population. On the other hand, Europe is anticipated to be the second largest market during the analysis period owing to presence of higher number of infertility centers, rise in investment in healthcare, and increase in awareness about the healthcare technologies among Europeans.
The key market players profiled in the report include Androfert, Arquimea (Arquimea Agrotech), Bioline Technologies, Cooper Companies Inc (Cooper Surgical), DNA Diagnostics Center, Inc., FlowLabs, Hamilton Thorne Inc., Lab IVF, Leja Products B.V, Medical Electronics Systems, Michigan center for fertility & women's health, Microptic SL, Midland Fertility, MotilityCount ApS, NW Cryobank, Sperm processor, and Synergy medical systems.
Key Benefits For Stakeholders
Semen Analysis Market Report Highlights
Aspects | Details |
---|---|
By Product |
|
By Age Group |
|
By End User |
|
By Region |
|
Key Market Players | Leja Products B.V, Androfert, Michigan center for fertility & women's health, Bioline Technologies, Midland Fertility, FlowLabs, DNA Diagnostics Center, Inc., Cooper Companies Inc (Cooper Surgical), Hamilton Thorne Inc., MotilityCount ApS, Medical electronics systems, Microptic SL, Sperm processor, Lab IVF, NW Cryobank, Synergy medical systems, Arquimea (Arquimea Agrotech) |
CHAPTER 1:INTRODUCTION
1.1.Report description
1.2.Key benefits for stakeholders
1.3.Key market segments
1.3.1.List of key players profiled in the report
1.4.Research methodology
1.4.1.Secondary research
1.4.2.Primary research
1.4.3.Analyst tools and models
CHAPTER 2:EXECUTIVE SUMMARY
2.1.Key findings of the study
2.2.CXO perspective
CHAPTER 3:MARKET OVERVIEW
3.1.Market definition and scope
3.2.Key findings
3.2.1.Top investment pockets
3.3.Porters five forces analysis
3.4.Patent analysis (2020-2022)
3.4.1.Patent analysis, by year
3.5.Market dynamics
3.5.1.Drivers
3.5.1.1.Increase in incidences of male infertility
3.5.1.2.Innovation and advancement in male fertility testing
3.5.1.3.Increase in awareness regarding male fertility testing
3.5.2.Restraint
3.5.2.1.Lack of awareness in economically poor countries
3.5.3.Opportunities
3.5.3.1.Sales of male fertility testing kits on online platform
3.5.3.2.Growth opportunities in emerging countries
3.5.4.Impact analysis
3.6.COVID-19 impact analysis for Semen analysis market
CHAPTER 4:SEMEN ANALYSIS MARKET, BY PRODUCT
4.1.Overview
4.1.1.Market size and forecast
4.2.Semen Analyzers
4.2.1.Key market trends, growth factors, and opportunities
4.2.2.Market size and forecast, by region
4.2.3.Market analysis, by country
4.2.4.Market size and forecast, by type
4.2.5.Manual Semen Analyzer
4.2.5.1.Market size and forecast
4.2.6.Automated Semen Analyzer
4.2.6.1.Market size and forecast
4.3.Centrifuges for Sample Preparation
4.3.1.Key market trends, growth factors, and opportunities
4.3.2.Market size and forecast, by region
4.3.3.Market share analysis, by country
4.4.Semen Test Kits
4.4.1.Key market trends, growth factors, and opportunities
4.4.2.Market size and forecast, by region
4.4.3.Market share analysis, by country
4.5.Disposables & Consumables
4.5.1.Key market trends, growth factors, and opportunities
4.5.2.Market size and forecast, by region
4.5.3.Market share analysis, by country
4.6.Software
4.6.1.Key market trends, growth factors, and opportunities
4.6.2.Market size and forecast, by region
4.6.3.Market share analysis, by country
CHAPTER 5:SEMEN ANALYSIS MARKET, BY AGE GROUP
5.1.Overview
5.1.1.Market size and forecast
5.2.34 and below 34 years
5.2.1.Market size and forecast, by region
5.2.2.Market analysis, by country
5.3.35-40 years
5.3.1.Market size and forecast, by region
5.3.2.Market analysis, by country
5.4.41 and greater than 41 years
5.4.1.Market size and forecast, by region
5.4.2.Market analysis, by country
CHAPTER 6:SEMEN ANALYSIS MARKET, BY END USER
6.1.Overview
6.1.1.Market size and forecast
6.2.Fertility Centers
6.2.1.Market size and forecast, by region
6.2.2.Market analysis, by country
6.3.Hospitals
6.3.1.Market size and forecast, by region
6.3.2.Market analysis, by country
6.4.Diagnostic Laboratories
6.4.1.Market size and forecast, by region
6.4.2.Market analysis, by country
6.5.Others
6.5.1.Market size and forecast, by region
6.5.2.Market analysis, by country
CHAPTER 7:SEMEN ANALYSIS MARKET, BY REGION
7.1.Overview
7.1.1.Market size and forecast
7.2.North America
7.2.1.Key market trends, growth factors, and opportunities
7.2.2.North America semen analysis market, by product
7.2.3.North America semen analysis market, by age group
7.2.4.North America semen analysis market, by end user
7.2.5.Market size and forecast, by country
7.2.5.1.U.S.
7.2.5.1.1.U.S. semen analysis market, by product
7.2.5.1.2.U.S. semen analysis market, by age group
7.2.5.1.3.U.S. semen analysis market, by end user
7.2.5.2.Canada
7.2.5.2.1.Canada semen analysis market, by product
7.2.5.2.2.Canada semen analysis market, by age group
7.2.5.2.3.Canada semen analysis market, by end user
7.2.5.3.Mexico
7.2.5.3.1.Mexico semen analysis market, by product
7.2.5.3.2.Mexico semen analysis market, by age group
7.2.5.3.3.Mexico semen analysis market, by end user
7.3.Europe
7.3.1.Key market trends, growth factors, and opportunities
7.3.2.Europe semen analysis market, by product
7.3.3.Europe semen analysis market, by age group
7.3.4.Europe semen analysis market, by end user
7.3.5.Market size and forecast, by country
7.3.5.1.Germany
7.3.5.1.1.Germany semen analysis market, by product
7.3.5.1.2.Germany semen analysis market, by age group
7.3.5.1.3.Germany semen analysis market, by end user
7.3.5.2.France
7.3.5.2.1.France semen analysis market, by product
7.3.5.2.2.France semen analysis market, by age group
7.3.5.2.3.France semen analysis market, by end user
7.3.5.3.UK
7.3.5.3.1.UK semen analysis market, by product
7.3.5.3.2.UK semen analysis market, by age group
7.3.5.3.3.UK semen analysis market, by end user
7.3.5.4.Italy
7.3.5.4.1.Italy semen analysis market, by product
7.3.5.4.2.Italy semen analysis market, by age group
7.3.5.4.3.Italy semen analysis market, by end user
7.3.5.5.Spain
7.3.5.5.1.Spain semen analysis market, by product
7.3.5.5.2.Spain semen analysis market, by age group
7.3.5.5.3.Spain semen analysis market, by end user
7.3.5.6.Rest of Europe
7.3.5.6.1.Rest of Europe semen analysis market, by product
7.3.5.6.2.Rest of Europe semen analysis market, by age group
7.3.5.6.3.Rest of Europe semen analysis market, by end user
7.4.Asia-Pacific
7.4.1.Key market trends, growth factors, and opportunities
7.4.2.Asia-Pacific semen analysis market, by product
7.4.3.Asia-Pacific semen analysis market, by age group
7.4.4.Asia-Pacific semen analysis market, by end user
7.4.5.Market size and forecast, by country
7.4.5.1.Japan
7.4.5.1.1.Japan semen analysis market, by product
7.4.5.1.2.Japan semen analysis market, by age group
7.4.5.1.3.Japan semen analysis market, by end user
7.4.5.2.China
7.4.5.2.1.China semen analysis market, by product
7.4.5.2.2.China semen analysis market, by age group
7.4.5.2.3.China semen analysis market, by end user
7.4.5.3.Australia
7.4.5.3.1.Australia semen analysis market, by product
7.4.5.3.2.Australia semen analysis market, by age group
7.4.5.3.3.Australia semen analysis market, by end user
7.4.5.4.India
7.4.5.4.1.India semen analysis market, by product
7.4.5.4.2.India semen analysis market, by age group
7.4.5.4.3.India semen analysis market, by end user
7.4.5.5.South Korea
7.4.5.5.1.South Korea semen analysis market, by product
7.4.5.5.2.South Korea semen analysis market, by age group
7.4.5.5.3.South Korea semen analysis market, by end user
7.4.5.6.Rest of Asia-Pacific
7.4.5.6.1.Rest of Asia-Pacific semen analysis market, by product
7.4.5.6.2.Rest of Asia-Pacific semen analysis market, by age group
7.4.5.6.3.Rest of Asia-Pacific semen analysis market, by end user
7.5.LAMEA
7.5.1.Key market trends, growth factors, and opportunities
7.5.2.LAMEA semen analysis market, by product
7.5.3.LAMEA semen analysis market, by age group
7.5.4.LAMEA semen analysis market, by end user
7.5.5.LAMEA semen analysis market, by country
7.5.5.1.Brazil
7.5.5.1.1.Brazil semen analysis market, by product
7.5.5.1.2.Brazil semen analysis market, by age group
7.5.5.1.3.Brazil semen analysis market, by end user
7.5.5.2.Saudi Arabia
7.5.5.2.1.Saudi Arabia semen analysis market, by product
7.5.5.2.2.Saudi Arabia semen analysis market, by age group
7.5.5.2.3.Saudi Arabia semen analysis market, by end user
7.5.5.3.South Africa
7.5.5.3.1.South Africa semen analysis market, by product
7.5.5.3.2.South Africa semen analysis market, by age group
7.5.5.3.3.South Africa semen analysis market, by end user
7.5.5.4.Rest of LAMEA
7.5.5.4.1.Rest of LAMEA semen analysis market, by product
7.5.5.4.2.Rest of LAMEA semen analysis market, by age group
7.5.5.4.3.Rest of LAMEA semen analysis market, by end user
CHAPTER 8:COMPETITION LANDSCAPE
8.1.Top winning strategies
8.2.Product mapping
8.3.Competitive dashboard
8.4.Competitive heat map
8.5.Key developments
8.5.1.Partnership
8.5.2.Product launch
8.5.3.Acquisition
8.5.4.Product Enhancement
8.6.Top Player Positioning 2021
CHAPTER 9:COMPANY PROFILES
9.1.ANDROFERT
9.1.1.Company overview
9.1.2.Company snapshot
9.1.3.Operating business segments
9.1.4.Service portfolio
9.2.ARQUIMEA (ARQUIMEA AGROTECH)
9.2.1.Company overview
9.2.2.Key executives
9.2.3.Company snapshot
9.2.4.Operating business segments
9.2.5.Product portfolio
9.3.BIOLINE TECHNOLOGIES
9.3.1.Company overview
9.3.2.Key executives
9.3.3.Company snapshot
9.3.4.Operating business segments
9.3.5.Product portfolio
9.4.COOPER COMPANIES INC (COOPER SURGICAL )
9.4.1.Company overview
9.4.2.Key executives
9.4.3.Company snapshot
9.4.4.Operating business segments
9.4.5.Product portfolio
9.4.6.R&D expenditure
9.4.7.Business performance
9.4.8.Key strategic moves and developments
9.5.DNA DIAGNOSTIC CENTER
9.5.1.Company overview
9.5.2.Key executives
9.5.3.Company snapshot
9.5.4.Operating business segments
9.5.5.Product portfolio
9.5.6.Key strategic moves and developments
9.6.FLOWLABS
9.6.1.Company overview
9.6.2.Key executives
9.6.3.Company snapshot
9.6.4.Operating business segments
9.6.5.Service portfolio
9.7.HAMILTON THORNE INC
9.7.1.Company overview
9.7.2.Key executives
9.7.3.Company snapshot
9.7.4.Operating business segments
9.7.5.Product portfolio
9.7.6.R&D expenditure
9.7.7.Business performance
9.8.LAB IVF
9.8.1.Company overview
9.8.2.Company snapshot
9.8.3.Operating business segments
9.8.4.Product portfolio
9.9.LEJA PRODUCTS B.V
9.9.1.Company overview
9.9.2.Key executives
9.9.3.Company snapshot
9.9.4.Operating business segments
9.9.5.Product portfolio
9.10.MICHIGAN CENTER FOR FERTILITY & WOMEN’S HEALTH
9.10.1.Company overview
9.10.2.Company snapshot
9.10.3.Operating business segments
9.10.4.Service portfolio
9.11.MIDLAND FERTILITY
9.11.1.Company overview
9.11.2.Company snapshot
9.11.3.Operating business segments
9.11.4.Service portfolio
9.12.MOTILITY COUNT APS (SWIMCOUNT)
9.12.1.Company overview
9.12.2.Key executives
9.12.3.Company snapshot
9.12.4.Operating business segments
9.12.5.Product portfolio
9.13.NW CRYOBANK
9.13.1.Company overview
9.13.2.Company snapshot
9.13.3.Operating business segments
9.13.4.Product portfolio
9.14.SPERM PROCESSOR
9.14.1.Company overview
9.14.2.Key executives
9.14.3.Company snapshot
9.14.4.Operating business segments
9.14.5.Product portfolio
9.15.SYNERGY MEDICAL SYSTEM
9.15.1.Company overview
9.15.2.Key executives
9.15.3.Company snapshot
9.15.4.Operating business segments
9.15.5.Product portfolio
CHAPTER 10:INNOVATOR COMPANIES
10.1.MICROPTIC SL
10.1.1.Company overview
10.1.2.Key executives
10.1.3.Company snapshot
10.1.4.Operating business segments
10.1.5.Product portfolio
10.1.6.Key strategic moves and developments
10.1.7.AMR Perspective: Microptic Innovations and its Impact on the Market
10.2.MEDICAL ELECTRONICS SYSTEMS
10.2.1.Company overview
10.2.2.Key executives
10.2.3.Company snapshot
10.2.4.Operating business segments
10.2.5.Product portfolio
10.2.6.Key strategic moves and developments
10.2.7.AMR Perspective: Medical Electronic System Innovations and its Impact on the Market
LIST OF TABLES
TABLE 01.SEMEN ANALYSIS MARKET, BY PRODUCT, 2021-2031 ($MILLION)
TABLE 02.SEMEN ANALYSIS MARKET FOR SEMEN ANALYZERS, BY REGION, 2021-2031 ($MILLION)
TABLE 03.SEMEN ANALYSIS MARKET FOR SEMEN ANALYZER, BY NORTH AMERICA, 2021-2031 ($MILLION)
TABLE 04.SEMEN ANALYSIS MARKET FOR SEMEN ANALYZER, BY EUROPE, 2021-2031 ($MILLION)
TABLE 05.SEMEN ANALYSIS MARKET FOR SEMEN ANALYZER, BY ASIA-PACIFIC, 2021-2031 ($MILLION)
TABLE 06.SEMEN ANALYSIS MARKET FOR SEMEN ANALYZER, BY LAMEA, 2021-2031 ($MILLION)
TABLE 07.SEMEN ANALYSIS MARKET, FOR SEMEN ANALYZER, BY TYPE, 2021–2031, ($MILLION)
TABLE 08.SEMEN ANALYSIS MARKET FOR CENTRIFUGES FOR SAMPLE PREPARATION, BY REGION, 2021-2031 ($MILLION)
TABLE 09.SEMEN ANALYSIS MARKET FOR CENTRIFUGES FOR SAMPLE PREPARATION, BY NORTH AMERICA, 2021-2031 ($MILLION)
TABLE 10.SEMEN ANALYSIS MARKET FOR CENTRIFUGES FOR SAMPLE PREPARATION, BY EUROPE, 2021-2031 ($MILLION)
TABLE 11.SEMEN ANALYSIS MARKET FOR CENTRIFUGES FOR SAMPLE PREPARATION, BY ASIA-PACIFIC, 2021-2031 ($MILLION)
TABLE 12.SEMEN ANALYSIS MARKET FOR CENTRIFUGES FOR SAMPLE PREPARATION, BY LAMEA, 2021-2031 ($MILLION)
TABLE 13.SEMEN ANALYSIS MARKET FOR SEMEN TEST KITS, BY REGION, 2021-2031 ($MILLION)
TABLE 14.SEMEN ANALYSIS MARKET FOR SEMEN TEST KITS, BY NORTH AMERICA, 2021-2031 ($MILLION)
TABLE 15.SEMEN ANALYSIS MARKET FOR SEMEN TEST KITS, BY EUROPE, 2021-2031 ($MILLION)
TABLE 16.SEMEN ANALYSIS MARKET FOR SEMEN TEST KITS, BY ASIA-PACIFIC, 2021-2031 ($MILLION)
TABLE 17.SEMEN ANALYSIS MARKET FOR SEMEN TEST KITS, BY LAMEA, 2021-2031 ($MILLION)
TABLE 18.SEMEN ANALYSIS MARKET FOR DISPOSABLES & CONSUMABLES, BY REGION, 2021-2031 ($MILLION)
TABLE 19.SEMEN ANALYSIS MARKET FOR DISPOSABLES & CONSUMABLES, BY NORTH AMERICA, 2021-2031 ($MILLION)
TABLE 20.SEMEN ANALYSIS MARKET FOR DISPOSABLES & CONSUMABLES, BY EUROPE, 2021-2031 ($MILLION)
TABLE 21.SEMEN ANALYSIS MARKET FOR DISPOSABLES & CONSUMABLES, BY ASIA-PACIFIC, 2021-2031 ($MILLION)
TABLE 22.SEMEN ANALYSIS MARKET FOR DISPOSABLES & CONSUMABLES, BY LAMEA, 2021-2031 ($MILLION)
TABLE 23.SEMEN ANALYSIS MARKET FOR SOFTWARE, BY REGION, 2021-2031 ($MILLION)
TABLE 24.SEMEN ANALYSIS MARKET FOR SOFTWARE, BY NORTH AMERICA, 2021-2031 ($MILLION)
TABLE 25.SEMEN ANALYSIS MARKET FOR SOFTWARE, BY EUROPE, 2021-2031 ($MILLION)
TABLE 26.SEMEN ANALYSIS MARKET FOR SOFTWARE, BY ASIA-PACIFIC, 2021-2031 ($MILLION)
TABLE 27.SEMEN ANALYSIS MARKET FOR SOFTWARE, BY LAMEA, 2021-2031 ($MILLION)
TABLE 28.SEMEN ANALYSIS MARKET, BY AGE GROUP, 2021-2031 ($MILLION)
TABLE 29.SEMEN ANALYSIS MARKET FOR 34 AND BELOW 34 YEARS, BY REGION, 2021-2031 ($MILLION)
TABLE 30.SEMEN ANALYSIS MARKET FOR 34 AND BELOW 34 YEARS, BY NORTH AMERICA, 2021-2031 ($MILLION)
TABLE 31.SEMEN ANALYSIS MARKET FOR 34 AND BELOW 34 YEARS, BY EUROPE, 2021-2031 ($MILLION)
TABLE 32.SEMEN ANALYSIS MARKET FOR 34 AND BELOW 34 YEARS, BY ASIA-PACIFIC, 2021-2031 ($MILLION)
TABLE 33.SEMEN ANALYSIS MARKET FOR 34 AND BELOW 34 YEARS, BY LAMEA, 2021-2031 ($MILLION)
TABLE 34.SEMEN ANALYSIS MARKET FOR 35-40 YEARS, BY REGION, 2021-2031 ($MILLION)
TABLE 35.SEMEN ANALYSIS MARKET FOR 35-40 YEARS, BY NORTH AMERICA, 2021-2031 ($MILLION)
TABLE 36.SEMEN ANALYSIS MARKET FOR 35-40 YEARS, BY EUROPE, 2021-2031 ($MILLION)
TABLE 37.SEMEN ANALYSIS MARKET FOR 35-40 YEARS, BY ASIA-PACIFIC, 2021-2031 ($MILLION)
TABLE 38.SEMEN ANALYSIS MARKET FOR 35-40 YEARS, BY LAMEA, 2021-2031 ($MILLION)
TABLE 39.SEMEN ANALYSIS MARKET FOR 41 AND GREATER THAN 41 YEARS, BY REGION, 2021-2031 ($MILLION)
TABLE 40.SEMEN ANALYSIS MARKET FOR 41 AND GREATER THAN 41 YEARS, BY NORTH AMERICA, 2021-2031 ($MILLION)
TABLE 41.SEMEN ANALYSIS MARKET FOR 41 AND GREATER THAN 41 YEARS, BY EUROPE, 2021-2031 ($MILLION)
TABLE 42.SEMEN ANALYSIS MARKET FOR 41 AND GREATER THAN 41 YEARS, BY ASIA-PACIFIC, 2021-2031 ($MILLION)
TABLE 43.SEMEN ANALYSIS MARKET FOR 41 AND GREATER THAN 41 YEARS, BY LAMEA, 2021-2031 ($MILLION)
TABLE 44.SEMEN ANALYSIS MARKET, BY END USER, 2021-2031 ($MILLION)
TABLE 45.SEMEN ANALYSIS MARKET FOR FERTILITY CENTERS, BY REGION, 2021-2031 ($MILLION)
TABLE 46.SEMEN ANALYSIS MARKET FOR FERTILITY CENTERS, BY NORTH AMERICA, 2021-2031 ($MILLION)
TABLE 47.SEMEN ANALYSIS MARKET FOR FERTILITY CENTERS, BY EUROPE, 2021-2031 ($MILLION)
TABLE 48.SEMEN ANALYSIS MARKET FOR FERTILITY CENTERS, BY ASIA-PACIFIC, 2021-2031 ($MILLION)
TABLE 49.SEMEN ANALYSIS MARKET FOR FERTILITY CENTERS, BY LAMEA, 2021-2031 ($MILLION)
TABLE 50.SEMEN ANALYSIS MARKET FOR HOSPITALS, BY REGION, 2021-2031 ($MILLION)
TABLE 51.SEMEN ANALYSIS MARKET FOR HOSPITALS, BY NORTH AMERICA, 2021-2031 ($MILLION)
TABLE 52.SEMEN ANALYSIS MARKET FOR HOSPITALS, BY EUROPE, 2021-2031 ($MILLION)
TABLE 53.SEMEN ANALYSIS MARKET FOR HOSPITALS, BY ASIA-PACIFIC, 2021-2031 ($MILLION)
TABLE 54.SEMEN ANALYSIS MARKET FOR HOSPITALS, BY LAMEA, 2021-2031 ($MILLION)
TABLE 55.SEMEN ANALYSIS MARKET FOR DIAGNOSTIC LABORATORIES, BY REGION, 2021-2031 ($MILLION)
TABLE 56.SEMEN ANALYSIS MARKET FOR DIAGNOSTIC LABORATORIES, BY NORTH AMERICA, 2021-2031 ($MILLION)
TABLE 57.SEMEN ANALYSIS MARKET FOR DIAGNOSTIC LABORATORIES, BY EUROPE, 2021-2031 ($MILLION)
TABLE 58.SEMEN ANALYSIS MARKET FOR DIAGNOSTIC LABORATORIES, BY ASIA-PACIFIC, 2021-2031 ($MILLION)
TABLE 59.SEMEN ANALYSIS MARKET FOR DIAGNOSTIC LABORATORIES, BY LAMEA, 2021-2031 ($MILLION)
TABLE 60.SEMEN ANALYSIS MARKET FOR OTHERS, BY REGION, 2021-2031 ($MILLION)
TABLE 61.SEMEN ANALYSIS MARKET FOR OTHERS, BY NORTH AMERICA, 2021-2031 ($MILLION)
TABLE 62.SEMEN ANALYSIS MARKET FOR OTHERS, BY EUROPE, 2021-2031 ($MILLION)
TABLE 63.SEMEN ANALYSIS MARKET FOR OTHERS, BY ASIA-PACIFIC, 2021-2031 ($MILLION)
TABLE 64.SEMEN ANALYSIS MARKET FOR OTHERS, BY LAMEA, 2021-2031 ($MILLION)
TABLE 65.SEMEN ANALYSIS MARKET REVENUE, BY REGION, 2021-2031 ($MILLION)
TABLE 66.NORTH AMERICA SEMEN ANALYSIS MARKET, BY PRODUCT, 2021-2031 ($MILLION)
TABLE 67.NORTH AMERICA SEMEN ANALYSIS MARKET, BY AGE GROUP, 2021-2031 ($MILLION)
TABLE 68.NORTH AMERICA SEMEN ANALYSIS MARKET, BY END USER, 2021-2031 ($MILLION)
TABLE 69.NORTH AMERICA SEMEN ANALYSIS MARKET, BY COUNTRY, 2021-2031 ($MILLION)
TABLE 70.U.S. SEMEN ANALYSIS MARKET, BY PRODUCT, 2021-2031 ($MILLION)
TABLE 71.U.S. SEMEN ANALYSIS MARKET, BY AGE GROUP, 2021-2031 ($MILLION)
TABLE 72.U.S. SEMEN ANALYSIS MARKET, BY END USER, 2021-2031 ($MILLION)
TABLE 73.CANADA SEMEN ANALYSIS MARKET, BY PRODUCT, 2021-2031 ($MILLION)
TABLE 74.CANADA SEMEN ANALYSIS MARKET, BY AGE GROUP, 2021-2031 ($MILLION)
TABLE 75.CANADA SEMEN ANALYSIS MARKET, BY END USER, 2021-2031 ($MILLION)
TABLE 76.MEXICO SEMEN ANALYSIS MARKET, BY PRODUCT, 2021-2031 ($MILLION)
TABLE 77.MEXICO SEMEN ANALYSIS MARKET, BY AGE GROUP, 2021-2031 ($MILLION)
TABLE 78.MEXICO SEMEN ANALYSIS MARKET, BY END USER, 2021-2031 ($MILLION)
TABLE 79.EUROPE SEMEN ANALYSIS MARKET, BY PRODUCT, 2021-2031 ($MILLION)
TABLE 80.EUROPE SEMEN ANALYSIS MARKET, BY AGE GROUP, 2021-2031 ($MILLION)
TABLE 81.EUROPE SEMEN ANALYSIS MARKET, BY END USER, 2021-2031 ($MILLION)
TABLE 82.EUROPE SEMEN ANALYSIS MARKET, BY COUNTRY, 2021-2031 ($MILLION)
TABLE 83.GERMANY SEMEN ANALYSIS MARKET, BY PRODUCT, 2021-2031 ($MILLION)
TABLE 84.GERMANY SEMEN ANALYSIS MARKET, BY AGE GROUP, 2021-2031 ($MILLION)
TABLE 85.GERMANY SEMEN ANALYSIS MARKET, BY END USER, 2021-2031 ($MILLION)
TABLE 86.FRANCE SEMEN ANALYSIS MARKET, BY PRODUCT, 2021-2031 ($MILLION)
TABLE 87.FRANCE SEMEN ANALYSIS MARKET, BY AGE GROUP, 2021-2031 ($MILLION)
TABLE 88.FRANCE SEMEN ANALYSIS MARKET, BY END USER, 2021-2031 ($MILLION)
TABLE 89.UK SEMEN ANALYSIS MARKET, BY PRODUCT, 2021-2031 ($MILLION)
TABLE 90.UK SEMEN ANALYSIS MARKET, BY AGE GROUP, 2021-2031 ($MILLION)
TABLE 91.UK SEMEN ANALYSIS MARKET, BY END USER, 2021-2031 ($MILLION)
TABLE 92.ITALY SEMEN ANALYSIS MARKET, BY PRODUCT, 2021-2031 ($MILLION)
TABLE 93.ITALY SEMEN ANALYSIS MARKET, BY AGE GROUP, 2021-2031 ($MILLION)
TABLE 94.ITALY SEMEN ANALYSIS MARKET, BY END USER, 2021-2031 ($MILLION)
TABLE 95.SPAIN SEMEN ANALYSIS MARKET, BY PRODUCT, 2021-2031 ($MILLION)
TABLE 96.SPAIN SEMEN ANALYSIS MARKET, BY AGE GROUP, 2021-2031 ($MILLION)
TABLE 97.SPAIN SEMEN ANALYSIS MARKET, BY END USER, 2021-2031 ($MILLION)
TABLE 98.REST OF EUROPE SEMEN ANALYSIS MARKET, BY PRODUCT, 2021-2031 ($MILLION)
TABLE 99.REST OF EUROPE SEMEN ANALYSIS MARKET, BY AGE GROUP, 2021-2031 ($MILLION)
TABLE 100.REST OF EUROPE SEMEN ANALYSIS MARKET, BY END USER, 2021-2031 ($MILLION)
TABLE 101.ASIA-PACIFIC SEMEN ANALYSIS MARKET, BY PRODUCT, 2021-2031 ($MILLION)
TABLE 102.ASIA-PACIFIC SEMEN ANALYSIS MARKET, BY AGE GROUP, 2021-2031 ($MILLION)
TABLE 103.ASIA-PACIFIC SEMEN ANALYSIS MARKET, BY END USER, 2021-2031 ($MILLION)
TABLE 104.ASIA-PACIFIC SEMEN ANALYSIS MARKET, BY COUNTRY, 2021-2031 ($MILLION)
TABLE 105.JAPAN SEMEN ANALYSIS MARKET, BY PRODUCT, 2021-2031 ($MILLION)
TABLE 106.JAPAN SEMEN ANALYSIS MARKET, BY AGE GROUP, 2021-2031 ($MILLION)
TABLE 107.JAPAN SEMEN ANALYSIS MARKET, BY END USER, 2021-2031 ($MILLION)
TABLE 108.CHINA SEMEN ANALYSIS MARKET, BY PRODUCT, 2021-2031 ($MILLION)
TABLE 109.CHINA SEMEN ANALYSIS MARKET, BY AGE GROUP, 2021-2031 ($MILLION)
TABLE 110.CHINA SEMEN ANALYSIS MARKET, BY END USER, 2021-2031 ($MILLION)
TABLE 111.AUSTRALIA SEMEN ANALYSIS MARKET, BY PRODUCT, 2021-2031 ($MILLION)
TABLE 112.AUSTRALIA SEMEN ANALYSIS MARKET, BY AGE GROUP, 2021-2031 ($MILLION)
TABLE 113.AUSTRALIA SEMEN ANALYSIS MARKET, BY END USER, 2021-2031 ($MILLION)
TABLE 114.INDIA SEMEN ANALYSIS MARKET, BY PRODUCT, 2021-2031 ($MILLION)
TABLE 115.INDIA SEMEN ANALYSIS MARKET, BY AGE GROUP, 2021-2031 ($MILLION)
TABLE 116.INDIA SEMEN ANALYSIS MARKET, BY END USER, 2021-2031 ($MILLION)
TABLE 117.SOUTH KOREA SEMEN ANALYSIS MARKET, BY PRODUCT, 2021-2031 ($MILLION)
TABLE 118.SOUTH KOREA SEMEN ANALYSIS MARKET, BY AGE GROUP, 2021-2031 ($MILLION)
TABLE 119.SOUTH KOREA SEMEN ANALYSIS MARKET, BY END USER, 2021-2031 ($MILLION)
TABLE 120.REST OF ASIA-PACIFIC SEMEN ANALYSIS MARKET, BY PRODUCT, 2021-2031 ($MILLION)
TABLE 121.REST OF ASIA-PACIFIC SEMEN ANALYSIS MARKET, BY AGE GROUP, 2021-2031 ($MILLION)
TABLE 122.REST OF ASIA-PACIFIC SEMEN ANALYSIS MARKET, BY END USER, 2021-2031 ($MILLION)
TABLE 123.LAMEA SEMEN ANALYSIS MARKET, BY PRODUCT, 2021-2031 ($MILLION)
TABLE 124.LAMEA SEMEN ANALYSIS MARKET, BY AGE GROUP, 2021-2031 ($MILLION)
TABLE 125.LAMEA SEMEN ANALYSIS MARKET, BY END USER, 2021-2031 ($MILLION)
TABLE 126.LAMEA SEMEN ANALYSIS MARKET, BY COUNTRY, 2021-2031 ($MILLION)
TABLE 127.BRAZIL SEMEN ANALYSIS MARKET, BY PRODUCT, 2021-2031 ($MILLION)
TABLE 128.BRAZIL SEMEN ANALYSIS MARKET, BY AGE GROUP, 2021-2031 ($MILLION)
TABLE 129.BRAZIL SEMEN ANALYSIS MARKET, BY END USER, 2021-2031 ($MILLION)
TABLE 130.SAUDI ARABIA SEMEN ANALYSIS MARKET, BY PRODUCT, 2021-2031 ($MILLION)
TABLE 131.SAUDI ARABIA SEMEN ANALYSIS MARKET, BY AGE GROUP, 2021-2031 ($MILLION)
TABLE 132.SAUDI ARABIA SEMEN ANALYSIS MARKET, BY END USER, 2021-2031 ($MILLION)
TABLE 133.SOUTH AFRICA SEMEN ANALYSIS MARKET, BY PRODUCT, 2021-2031 ($MILLION)
TABLE 134.SOUTH AFRICA SEMEN ANALYSIS MARKET, BY AGE GROUP, 2021-2031 ($MILLION)
TABLE 135.SOUTH AFRICA SEMEN ANALYSIS MARKET, BY END USER, 2021-2031 ($MILLION)
TABLE 136.REST OF LAMEA SEMEN ANALYSIS MARKET, BY PRODUCT, 2021-2031 ($MILLION)
TABLE 137.REST OF LAMEA SEMEN ANALYSIS MARKET, BY AGE GROUP, 2021-2031 ($MILLION)
TABLE 138.REST OF LAMEA SEMEN ANALYSIS MARKET, BY END USER, 2021-2031 ($MILLION)
TABLE 139.ANDROFERT: COMPANY SNAPSHOT -
TABLE 140.ANDROFERT OPERATING SEGMENT -
TABLE 141.ANDROFERT SERVICE PORTFOLIO-
TABLE 142.ARQUIMEA :KEY EXECUTIVE-
TABLE 143.ARQUIMEA : COMPANY SNAPSHOT -
TABLE 144.ARQUIMEA OPERATING SEGMENT -
TABLE 145.ARQUIMEA PRODUCT PORTFOLIO-
TABLE 146.BIOLINE TECHNOLOGIES:KEY EXECUTIVE-
TABLE 147.BIOLINE TECHNOLOGIES: COMPANY SNAPSHOT -
TABLE 148.BIOLINE TECHNOLOGIES OPERATING SEGMENT -
TABLE 149.BIOLINE TECHNOLOGIES PRODUCT PORTFOLIO-
TABLE 150.COOPER COMPANIES :KEY EXECUTIVE-
TABLE 151.COOPER COMPANIES: COMPANY SNAPSHOT -
TABLE 152.COOPER COMPANIES OPERATING SEGMENT -
TABLE 153.COOPER COMPANIES PRODUCT PORTFOLIO-
TABLE 154.COOPER COMPANIES R&D EXPENDITURE 2019–2021 ($MILLION) -
TABLE 155.COOPER COMPANIES NET SALES, 2019–2021 ($MILLION) --
TABLE 156.COOPER COMPANIES :KEY STRATEGIC MOVES AND DEVELOPMENTS -
TABLE 157.DNA DIAGNOSTIC CENTER:KEY EXECUTIVE-
TABLE 158.DNA DIAGNOSTIC CENTER: COMPANY SNAPSHOT -
TABLE 159.DNA DIAGNOSTIC CENTER OPERATING SEGMENT -
TABLE 160.DNA DIAGNOSTIC CENTER PRODUCT PORTFOLIO-
TABLE 161.DNA DIAGNOSTIC CENTER: KEY STRATEGIC MOVES AND DEVELOPMENTS -
TABLE 162.FLOWLABS:KEY EXECUTIVE-
TABLE 163.FLOWLABS: COMPANY SNAPSHOT -
TABLE 164.FLOWLABS OPERATING SEGMENT -
TABLE 165.FLOWLABS SERVICE PORTFOLIO-
TABLE 166.HAMILTON THORNE INC:KEY EXECUTIVE-
TABLE 167.HAMILTON THORNE INC: COMPANY SNAPSHOT -
TABLE 168.HAMILTON THORNE INC OPERATING SEGMENT -
TABLE 169.HAMILTON THORNE INC PRODUCT PORTFOLIO-
TABLE 170.HAMILTON THORNE INC R&D EXPENDITURE 2019–2021 ($MILLION)
TABLE 171.HAMILTON THORNE INC NET SALES, 2019–2021 ($MILLION) --
TABLE 172.LAB IVF : COMPANY SNAPSHOT -
TABLE 173.LAB IVF OPERATING SEGMENT -
TABLE 174.LAB IVF PRODUCT PORTFOLIO-
TABLE 175.LEJA PRODUCTS B.V:KEY EXECUTIVE-
TABLE 176.LEJA PRODUCTS B.V: COMPANY SNAPSHOT -
TABLE 177.LEJA PRODUCTS B.V OPERATING SEGMENT -
TABLE 178.LEJA PRODUCTS B.V PRODUCT PORTFOLIO-
TABLE 179.MICHIGAN CENTER FOR FERTILITY & WOMEN’S HEALTH: COMPANY SNAPSHOT -
TABLE 180.MICHIGAN CENTER FOR FERTILITY & WOMEN’S HEALTH OPERATING SEGMENT -
TABLE 181.MICHIGAN CENTER FOR FERTILITY & WOMEN’S HEALTH SERVICE PORTFOLIO-
TABLE 182.MIDLAND FERTILITY: COMPANY SNAPSHOT -
TABLE 183.MIDLAND FERTILITY OPERATING SEGMENT -
TABLE 184.MIDLAND FERTILITY: SERVICE PORTFOLIO-
TABLE 185.MOTILITY COUNT APS:KEY EXECUTIVE-
TABLE 186.MOTILITY COUNT APS: COMPANY SNAPSHOT -
TABLE 187.MOTILITY COUNT APS OPERATING SEGMENT -
TABLE 188.MOTILITY COUNT APS PRODUCT PORTFOLIO-
TABLE 189.NW CRYOBANK: COMPANY SNAPSHOT -
TABLE 190.NW CRYOBANK OPERATING SEGMENT -
TABLE 191.NW CRYOBANK PRODUCT PORTFOLIO-
TABLE 192.SPERM PROCESSOR :KEY EXECUTIVE-
TABLE 193.SPERM PROCESSOR : COMPANY SNAPSHOT -
TABLE 194.SPERM PROCESSOR OPERATING SEGMENT -
TABLE 195.SPERM PROCESSOR PRODUCT PORTFOLIO-
TABLE 196.SYNERGY MEDICAL SYSTEM:KEY EXECUTIVE-
TABLE 197.SYNERGY MEDICAL SYSTEM: COMPANY SNAPSHOT -
TABLE 198.SYNERGY MEDICAL SYSTEM OPERATING SEGMENT -
TABLE 199.SYNERGY MEDICAL SYSTEM PRODUCT PORTFOLIO-
TABLE 200.MICROPTIC SL:KEY EXECUTIVE-
TABLE 201.MICROPTIC SL: COMPANY SNAPSHOT -
TABLE 202.MICROPTIC SL OPERATING SEGMENT -
TABLE 203.MICROPTIC SL PRODUCT PORTFOLIO-
TABLE 204.MICROPTIC SL: KEY STRATEGIC MOVES AND DEVELOPMENTS -
TABLE 205.MEDICAL ELECTRONICS SYSTEMS:KEY EXECUTIVE-
TABLE 206.MEDICAL ELECTRONICS SYSTEMS: COMPANY SNAPSHOT -
TABLE 207.MEDICAL ELECTRONICS SYSTEMS OPERATING SEGMENT -
TABLE 208.MEDICAL ELECTRONIC SYSTEM PRODUCT PORTFOLIO-
TABLE 209.MEDICAL ELECTRONIC SYSTEM :KEY STRATEGIC MOVES AND DEVELOPMENTS -
LIST OF FIGURES
FIGURE 01.EXECUTIVE SUMMARY
FIGURE 02.EXECUTIVE SUMMARY
FIGURE 03.SEMEN ANALYSIS MARKET SEGMENTATION
FIGURE 04.TOP INVESTMENT POCKETS
FIGURE 05.LOW BARGANING POWER OF SUPPLIERS
FIGURE 06.MODERATE BARGANING POWER OF BUYERS
FIGURE 07.HIGH THREAT OF SUBSTITUTION
FIGURE 08.HIGH THREAT OF NEW ENTRANTS
FIGURE 09.MODERATE COMPETITIVE RIVALRY
FIGURE 10.PATENTS REGISTERED/APPROVED IN THE WORLD, 2020-2022
FIGURE 11.PATENTS ANALYSIS BY YEAR, 2020-2022
FIGURE 12.IMPACT ANALYSIS
FIGURE 13.SEMEN ANALYSIS MARKET, BY PRODUCT, 2021–2031 (%)
FIGURE 14.COMPARATIVE ANALYSIS OF SEMEN ANALYSIS MARKET FOR SEMEN ANALYZER, BY COUNTRY, 2021 & 2031 (%)
FIGURE 15.SEMEN ANALYSIS MARKET FOR MANUAL SEMEN ANALYZER, 2021–2031, ($MILLION)
FIGURE 16.SEMEN ANALYSIS MARKET FOR AUTOMATED SEMEN ANALYZER, 2021–2031, ($MILLION)
FIGURE 17.COMPARATIVE ANALYSIS OF SEMEN ANALYSIS MARKET FOR CENTRIFUGES FOR SAMPLE PREPARATION, BY COUNTRY, 2021 & 2031 (%)
FIGURE 18.COMPARATIVE ANALYSIS OF SEMEN ANALYSIS MARKET FOR SEMEN TEST KITS, BY COUNTRY, 2021 & 2031 (%)
FIGURE 19.COMPARATIVE ANALYSIS OF SEMEN ANALYSIS MARKET FOR DISPOSABLES & CONSUMABLES, BY COUNTRY, 2021 & 2031 (%)
FIGURE 20.COMPARATIVE ANALYSIS OF SEMEN ANALYSIS MARKET FOR SOFTWARE, BY COUNTRY, 2021 & 2031 (%)
FIGURE 21.SEMEN ANALYSIS MARKET, BY AGE GROUP, 2021–2031 (%)
FIGURE 22.COMPARATIVE ANALYSIS OF SEMEN ANALYSIS MARKET FOR 34 AND BELOW 34 YEARS, BY COUNTRY, 2021 & 2031 (%)
FIGURE 23.COMPARATIVE ANALYSIS OF SEMEN ANALYSIS MARKET FOR 35-40 YEARS, BY COUNTRY, 2021 & 2031 (%)
FIGURE 24.COMPARATIVE ANALYSIS OF SEMEN ANALYSIS MARKET FOR 41 AND GREATER THAN 41 YEARS, BY COUNTRY, 2021 & 2031 (%)
FIGURE 25.SEMEN ANALYSIS MARKET, BY END USER, 2021–2031 (%)
FIGURE 26.COMPARATIVE ANALYSIS OF SEMEN ANALYSIS MARKET FOR FERTILITY CENTERS, BY COUNTRY, 2021 & 2031 (%)
FIGURE 27.COMPARATIVE ANALYSIS OF SEMEN ANALYSIS MARKET FOR HOSPITALS, BY COUNTRY, 2021 & 2031 (%)
FIGURE 28.COMPARATIVE ANALYSIS OF SEMEN ANALYSIS MARKET FOR DIAGNOSTIC LABORATORIES, BY COUNTRY, 2021 & 2031 (%)
FIGURE 29.COMPARATIVE ANALYSIS OF SEMEN ANALYSIS MARKET FOR OTHERS, BY COUNTRY, 2021 & 2031 (%)
FIGURE 30.SEMEN ANALYSIS MARKET, BY REGION, 2021–2031 (%)
FIGURE 31.TOP WINNING STRATEGIES, BY YEAR, 2019–2022*
FIGURE 32.TOP WINNING STRATEGIES, BY DEVELOPMENT, 2019–2022 (%)
FIGURE 33.TOP WINNING STRATEGIES, BY COMPANY, 2019–2022
FIGURE 34.PRODUCT MAPPING OF TOP 17 KEY PLAYERS
FIGURE 35.COMPETITIVE DASHBOARD OF TOP 17 KEY PLAYERS
FIGURE 36.COMPETITIVE HEATMAP OF TOP 17 KEY PLAYERS
FIGURE 37.TOP PLAYER POSITIONING
FIGURE 38.COOPER COMPANIES R&D EXPENDITURE 2019–2021 ($MILLION)
FIGURE 39.COOPER COMPANIES NET SALES, 2019–2021 ($MILLION) :
FIGURE 40.COOPER COMPANIES: REVENUE SHARE BY SEGMENT, 2021 (%)
FIGURE 41.COOPER COMPANIES: REVENUE SHARE BY REGION, 2021(%)
FIGURE 42.HAMILTON THORNE INC R&D EXPENDITURE 2019–2021 ($MILLION)
FIGURE 43.HAMILTON THORNE INC NET SALES, 2019–2021 ($MILLION) :
FIGURE 44.HAMILTON THORNE INC: REVENUE SHARE BY SEGMENT, 2021 (%)
FIGURE 45.HAMILTON THORNE INC: REVENUE SHARE BY REGION, 2021(%)
The semen analysis market is expected to witness a healthy growth with the adoption of semen analysis tests among the infertile male has increased in recent years, due to technological advancements in fertility procedures. In addition, occurrence of infertility in developing countries is expected to increase in the coming years, owing to increase in sperm-related issues in males due to lifestyle habits such as smoking & drinking and other age-related chronic diseases among the population. Furthermore, supportive government laws and legislation further supplement the demand for semen analysis tests among several communities across the globe.
The use of semen analysis test is highest in Asia-Pacific, owing to the factors such as high prevalence of infertility and growth in awareness regarding fertility testing among population and availability of technologically advanced products. Although the use of fertility test in LAMEA is low, the adoption rate is expected to increase, owing to rise in launch of new and advanced products with greater efficiency.
A. The total market value of semen analysis market is $955.47 million in 2021.
A. Disposable & consumables segment is the most influencing segment owing to increase in adoption of consumable & disposable during semen analysis testing.
A. Upsurge in the incidences of infertility among males within the population globally, innovation and advancement in male fertility testing and rise in awareness regarding male fertility testing are some factors expected to boost the market growth during the forecast period.
A. The base year is 2021 in semen analysis market
A. Top companies such as Androfert, Arquimea (Arquimea Agrotech), Bioline Technologies, Cooper Companies Inc (Cooper Surgical), DNA Diagnostics Center, Inc., FlowLabs, Hamilton Thorne Inc., Lab IVF, Leja Products B.V, Medical Electronics Systems held a high market position in 2021.
A. The forecast period for semen analysis market is 2022 to 2031
A. The market value of semen analysis market in 2031 is $1,486.78 million.
Start reading instantly.
This Report and over 66,905+ more Reports, Available with Avenue Library. T&C*.
Enterprise
License/PDF
Library
Membership
*Taxes/Fees, if applicable will be added during checkout. All prices in USD
To ensure high-level data integrity, accurate analysis, and impeccable forecasts
For complete satisfaction
On-demand customization of scope of the report to exactly meet your needs
Targeted market view to provide pertinent information and save time of readers
Get insights on topics that are crucial for your business. Stay abreast of your interest areas.
Get Industry Data AlertsTo ensure high-level data integrity, accurate analysis, and impeccable forecasts
For complete satisfaction
On-demand customization of scope of the report to exactly meet your needs
Targeted market view to provide pertinent information and save time of readers