
Shape Memory Alloys Market Outlook 2030
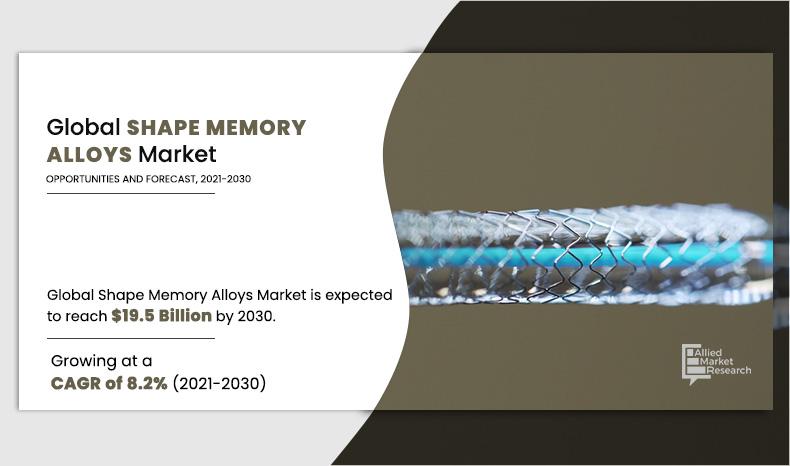
The global shape memory alloys market size was valued at $9.2 billion in 2020, and is projected to reach $19.5 billion by 2030, growing at a CAGR of 8.2% from 2021 to 2030. The rising adoption of shape memory alloys (SMAs) in robotics and actuators is significantly driving the demand for these materials, as their ability to change shape in response to temperature fluctuations makes them ideal for precise motion control in robotic systems.
Market Dynamics
The increase in wearable technology and smart materials is significantly driving the demand for shape memory alloys (SMAs). As wearable devices become more advanced, there is a growing need for materials that can offer flexibility, compactness, and durability, while also being able to perform in varying conditions. SMAs are ideal for these applications due to their ability to change shape in response to temperature fluctuations, allowing for intricate designs and precise functions. In wearable technology, SMAs can be used in components such as actuators, sensors, and adaptive structures, where the ability to respond to environmental stimuli is crucial for performance. All these factors are expected to drive the demand for the shape memory alloys market.
However, producing SMAs requires specialized techniques, such as precise alloy composition, controlled heat treatments, and advanced processing methods to achieve the desired properties and ensure the material's functionality. These processes are not only time-consuming but also costly, making SMAs more expensive compared to conventional materials. The need for high-quality control and precision during production further complicates scaling up for mass production, limiting the widespread adoption of SMAs in various industries. All these factors hamper the growth of the shape memory alloys market.
Shape memory alloys can be deformed and then restored to its original shape by applying heat. When shape memory alloys are cooled from their stronger, high-temperature form (austenite) to their weaker, low-temperature form (martensite), their crystal structure undergoes a phase shift (martensite). Special features of these alloys, such as shape memory and super elasticity are due to their inherent phase change. When a shape memory alloy is in the martensitic state, it is very easy to deform into a new shape. When heated to its transformation temperatures, alloy reverts and regains its previous shape with significant force. This transformation process is known as shape memory. Heat treatment and minor changes in alloy composition can be used to adjust the temperature at which the alloy remembers its austenite form when heated. Shape recovery process takes place over a small range of degrees and beginning or completion of transformation can be regulated within a degree or two, if needed.
Rise in demand for shape memory alloys (SMA) in the manufacturing of biomedical devices and surgical tools, aircraft components, and engineering & manufacturing actuators, and consumer electronics is the major driving factor for the shape memory alloys market. The market growth can also be attributed to rise in demand for high-quality life-saving medical devices as well as improved automotive and aerospace components. Physical properties of SMA promote their use in a variety of end-use industries. High cost of medical implants, which is the most common application of SMAs in the biomedical industry, is, however, a major hindrance for the market growth.
Segment Overview
The global shape memory alloys market is segmented on the basis of type, end use industry, and region. On the basis of type, the global shape memory alloys market report covers nickel titanium alloys, copper-based alloys, Fe-Mn-Si alloys and others. On the basis of end use industry, it is segmented into biomedical, aerospace & defense, automotive, and others. The report further outlines details about revenue generated through sales of shape memory alloys across North America, Europe, Asia-Pacific, and LAMEA. Presently, Asia-Pacific accounts for the largest share of the market, followed by Europe and North America.
Shape Memory Alloys Market, by Type
The nitinol segment accounted for the largest share in 2020, while the copper based alloys segment is projected to grow at the highest CAGR of 8.3%.
By Type
Nitinol in Shape Memory Alloys is projected as the most lucrative segment.
Shape Memory Alloys Market, by end use industry
The biomedical segment accounted for the largest share of the Shape Memory Alloys market in 2020, while the aerospace and defense segment is projected to grow at the highest CAGR of 9.1%.
By End-use Industry
Aerospace & Defence End-use Industry is projected as the most lucrative segment.
Shape Memory Alloys Market, by Region
The Asia-Pacific region accounted for the largest share of the Shape Memory Alloys market in 2020.
By Region
Asia-Pacific is projected as the most lucrative market.
Competitive Analysis
Major players operating in the global shape memory alloy market include Furukawa. Johnson Matthey, Metalwerks Inc., G. Rau GmbH & Co. KG, Fort Wayne Metals, Xi’an Saite Metal Material, Seabird Metal, Dynalloyinc, Saes Gaetters and Ati Specialty Alloys & Components.
Key Benefits For Stakeholders
- The report provides in-depth analysis of the global shape memory alloy market along with the current trends and future estimations.
- This report highlights the key drivers, opportunities, and restraints of the market along with the impact analysis during the forecast period.
- Porter’s five forces analysis helps to analyze the potential of the buyers & suppliers and the competitive scenario of the global shape memory alloy market for strategy building.
- A comprehensive market analysis covers the factors that drive and restrain the global shape memory alloys market growth.
- The qualitative data about market dynamics, trends, and developments is provided in the report.
Shape Memory Alloys Market Report Highlights
| Aspects | Details |
| By Type |
|
| By END USE INDUSTRIES |
|
| By Region |
|
| Key Market Players | Xi’an Saite Metal Materials Development Co., Ltd., ATIDYNALLOY, INC., METALWERKS, G.RAU GMBH & CO. KG, SAES Getters, FURUKAWA ELECTRIC CO., LTD., Johnson Matthey, Seabird Metal Materials Co. Ltd |
Analyst Review
Shape memory alloys have unique property of regaining their original shape following a temperature increase. In comparison to other traditional materials, these materials are more flexible. Shape memory alloys are used in aerospace & defense industry, as well as automobiles, robotics, valves, and medicinal devices. Owing to its features, such as high fatigue resistance, super elasticity, and biocompatibility, shape memory alloys are in high demand.
The global shape memory alloys market is segmented on the basis of type, end use industry, and region. On the basis of type, the global shape memory alloys market report covers nickel titanium alloys, copper-based alloys, Fe-Mn-Si alloys and others. On the basis of end use industry, it is segmented into biomedical, aerospace & defense, automotive, and others. The report further outlines details about revenue generated through sales of shape memory alloys across North America, Europe, Asia-Pacific, and LAMEA.
Growth drivers, restraints, and opportunities are explained in the report to better understand the market dynamics. This report further highlights key areas of investment. In addition, it includes Porter’s five forces analysis to understand the competitive scenario of the industry and role of each stakeholder. The report features strategies adopted by key market players to maintain their foothold in the market. Furthermore, it highlights the competitive landscape of key players to increase their market share and sustain intense competition in the industry.
Rise in demand for shape memory alloys (SMA) in the manufacturing of biomedical devices and surgical tools.
Rise in demand for shape memory alloys (SMA) in the manufacturing of biomedical devices and surgical tools.
The market size of the global shape memory alloys in 2021 is estimated to be around $9.6 billion in 2021 and is anticipated to rise to $19.5 billion by 2030.
Major players operating in the global shape memory alloy market include Furukawa. Johnson Matthey, Metalwerks Inc., G. Rau GmbH & Co. KG, Fort Wayne Metals, Xi’an Saite Metal Material, Seabird Metal, Dynalloyinc, Saes Gaetters and Ati Specialty Alloys & Components.
The aerospace & defense industry is projected to increase the demand for shape memory alloys market.
The global shape memory alloys market is segmented on the basis of type, end use industry, and region.
Rise in demand for shape memory alloys (SMA) in the manufacturing of biomedical devices and surgical tools, aircraft components, and engineering & manufacturing actuators, and consumer electronics is the major driving factor for the shape memory alloys market.
The biomedical and aerospace & defense applications are expected to drive the adoption of shape memory alloys during the forecast period.
Disruptions in supply chain management and temporary interruption in the manufacturing activities has negatively impacted the shape memory alloys market due to the COVID-19 pandemic.
Loading Table Of Content...

