
Shaving Cream Market Research, 2032
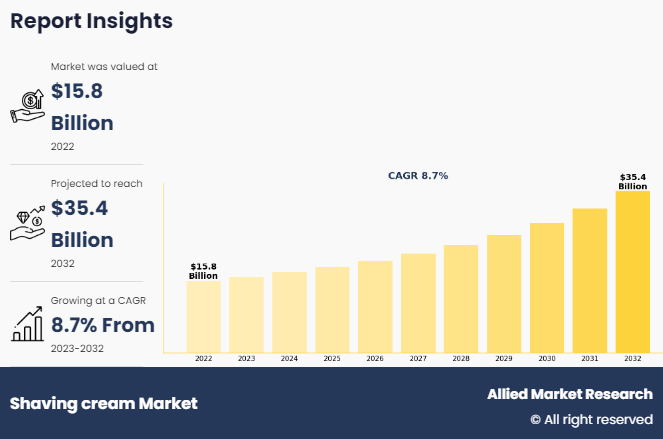
The global shaving cream market size was valued at $15.8 billion in 2022, and is projected to reach $35.4 billion by 2032, growing at a CAGR of 8.7% from 2023 to 2032. A smoother and more comfortable shaving experience is made possible by using shaving cream, an essential component of the grooming routine. It's usually applied to damp skin before shaving and comes in aerosol or tube form. It is a mixture of water, oils, and soaps that form a barrier, softening hair and hydrating skin to reduce friction between the skin and the razor. In addition to helping to elevate hair follicles, the creamy consistency lessens irritation and razor burn and facilitates closer shaving. The frequent use of fragrance and skin-soothing chemicals enhances the grooming ritual's sensory experience.
Key Takeaways of the Shaving Cream Market Report
- On the basis of end user, the men segment was the highest contributor to the market in 2022.
- On the basis of price point, the low segment is the fastest-growing segment with a 9.2% CAGR.
- On the basis of distribution channel, the specialty stores segment was the largest in the market in 2022.
- Region wise, Europe was the highest revenue contributor to the market in 2022.
Market Dynamics
The dynamics of the shaving cream market are mostly shaped by the preferences of consumers. Such variables as skin sensitivity, preferred natural or organic components, and preferred fragrances can all affect a person's preference. As skin health concerns have grown, there has been an increase in shaving cream market demand in recent years for shaving creams with soothing and moisturizing qualities.
In the past few years, there have been notable shifts in consumer grooming practices. Specifically for men, grooming has undergone a paradigm change where self-care and grooming regimens are given more importance. Due to this, there's a rise in the market for specialty shaving creams that address particular issues like beard maintenance, sensitive skin, or even specific shaving techniques like wet shaving.
Shaving cream retail has seen a transformation due to the growth of e-commerce. With the extra benefit of being able to access reviews and suggestions, online platforms provide customers with quick access to browse and buy things. In order to change consumer attitudes and increase sales in the shaving cream sector, digital marketing techniques such as influencer partnerships and social media campaigns have become crucial.
New delivery methods and sophisticated formulas for shaving cream have been made possible by technological advancements. To develop products with improved lubrication, skin protection, and persistent aroma, companies are spending funds on research and development. Development in packaging technology also helps with shelf appeal, product distinctiveness, and environmentally conscious campaigns.
Sustainability and eco-friendliness are becoming more popular in the market due to environmental concerns. Products with little environmental impact, cruelty-free testing, and biodegradable packaging are in high demand among consumers. Sustainability-minded businesses appeal to an increasing number of environmentally concerned customers while also helping to conserve the environment.
Due to companies entering new markets and meeting a variety of customer needs, the global market for shaving cream has grown. Fragrances, product compositions, and marketing techniques are influenced by regional and cultural preferences. A side effect of globalization is heightened competitiveness, which drives companies to innovate and set themselves apart from the competition in order to succeed in saturated markets.
The market for shaving cream is heavily influenced by economic factors such as disposable income and purchasing power. Consumers may choose lower-priced alternatives during economic downturns, but demand for high-end and premium shaving creams may increase during times of growth in the economy.
Segmental Overview
The shaving cream market is analyzed on the basis of end user, price point, distribution channel, and region. On the basis of end user, the market is bifurcated into men and women. On the basis of price point, the shaving cream market is divided into low, medium, and high. On the basis of distribution channel, the shaving cream industry is bifurcated into hypermarkets & supermarkets, specialty stores, online sales channel, and others. On the basis of region, it is studied across North America, Europe, Asia-Pacific, Middle East and Africa, and Latin America.
By End User
The men segment, as per end user, dominated the market in 2022 and is anticipated to maintain its dominance throughout the shaving cream market forecast period. The market for high-end, natural, and customized shaving products is being driven by a rise in men's awareness of personal grooming. E-commerce is essential since it provides convenience and a wide range of options. Sustainability is a major factor, and eco-friendly packaging and formulas are becoming more popular. Constant innovation brings novel products with modern technology and a wide range of fragrances to the market. Additionally, as men look for more comprehensive and customized grooming solutions, the market for shaving cream is growing due to the changing landscape of men's grooming, which is characterized by an increased focus on skincare.

By Price Point
The low segment dominates the shaving cream market in 2022. The demand for cost-effective grooming solutions and rising consumer price sensitivity are driving the growth of affordable options. Companies are responding to consumer demand for value-driven products by concentrating on formulations that are cost-effective without compromising quality. Increased market accessibility is facilitated by strategic alliances with discount retailers and the expansion of distribution channels, especially in emerging economies. Furthermore, innovative marketing techniques that highlight product efficacy and affordability are crucial in attracting the cost-conscious consumer base and promoting the low-cost shaving cream segment's expansion.

By Distribution Channel
The specialty stores segment, as per the distribution channel, dominated the market in 2022 and is anticipated to maintain its dominance throughout the forecast period. The distribution of shaving cream through specialty retailers is expected to rise as consumer preferences shift. Trends point to an increase in the demand for specialist and premium products, which attracts customers to specialty shops with carefully chosen inventory. These retailers can leverage individualized consumer interactions and in-store demos by emphasizing experiential shopping, thereby establishing a distinctive shopping experience. Furthermore, the growing emphasis on natural and organic shaving products complements the specialized selection frequently seen in these businesses, building customer confidence. The ease with which premium shaving creams can be located could increase specialty stores' shaving cream market share in this industry.

By Region
Region wise, Europe dominated the shaving cream market in 2022 and is anticipated to maintain its dominance throughout the forecast period. Growing emphasis on personal care and changing grooming trends are driving the European market for shaving cream to continue its dynamic expansion. A wide variety of formulations are available in the market to accommodate different skin types and preferences, as more people seek out high-end and customized products. In response to the discriminating needs of European consumers, leading companies in the region are concentrating on novel ingredients, environmentally friendly packaging, and dermatologist-tested formulas. By offering easy access to a large selection of shaving cream options, e-commerce channels further expand the market. Shaving cream sales in Europe as a whole show that the sector is flourishing and changing with the requirements of its customers.

Competitive Analysis
The major players analyzed for the shaving cream industry are Procter & Gamble (P&G) – Gillette, Unilever - Dove, Axe, Edgewell Personal Care - Edge, Skintimate, Colgate-Palmolive - Colgate Shaving Cream, The Art of Shaving, Pacific Shaving Company, Cremo Company, Barbasol, Proraso, and Nivea (Beiersdorf). Key players operating in the shaving cream market have adopted product business expansion, acquisition, partnership, and investment as key strategies to expand their market share, increase profitability, and remain competitive in the market.
The market is dominated by global brands with an established presence and broad product ranges, like Gillette (Procter & Gamble), Nivea (Beiersdorf AG), and Barbasol (Perio, Inc.). To be competitive, these companies make use of their substantial marketing budgets, extensive global distribution networks, and well-known brands. Their competitive position is greatly influenced by innovations in formulas, packaging, and extra features like moisturizing and skin-sensitive variants.
By focusing on local markets and particular customer preferences, regional firms can make a substantial contribution to the competition. These companies frequently place a strong emphasis on ecological or natural materials, affordability, and cultural significance. Three such companies include the Bombay Shaving Company in India, Arko in Turkey, and Proraso in Italy.
In addition, niche products that cater to particular markets like those for vegan or cruelty-free shaving creams, eco-friendly packaging, or distinctive scents have become more prevalent in the market. Despite their smaller size, these players appeal to a rising group of discerning and ecologically conscientious consumers who place a higher value on particular values when making purchases.
By giving both established and up-and-coming firms a direct line of communication with customers, e-commerce platforms increase the competition. Online reviews, specific recommendations, and focused marketing all have an impact on consumer decisions.
Recent Developments in the Shaving Cream Market
- In January 2024, a leading manufacturer of shaving products Gillette announced a strategic collaboration with a well-known skincare firm to jointly create a new range of shaving creams with cutting-edge skincare components. The goal of this collaboration was to provide customers with a high-end shaving experience that would improve skin health and moisturization.
- In March 2024, a new range of organic shaving creams was introduced by The Honest Company, which is well-known for its natural and eco-friendly goods. These creams are made with plant-based components and don't include harsh chemicals, making them ideal for customers who care about the environment and want delicate yet efficient shaving products.
Key Benefits For Stakeholders
- This report provides a quantitative analysis of the market segments, current trends, estimations, and dynamics of the shaving cream market analysis from 2022 to 2032 to identify the prevailing shaving cream market opportunities.
- The market research is offered along with information related to key drivers, restraints, and opportunities.
- Porter's five forces analysis highlights the potency of buyers and suppliers to enable stakeholders make profit-oriented business decisions and strengthen their supplier-buyer network.
- In-depth analysis of the shaving cream market segmentation assists to determine the prevailing market opportunities.
- Major countries in each region are mapped according to their revenue contribution to the global market.
- Market player positioning facilitates benchmarking and provides a clear understanding of the present position of the market players.
- The report includes the analysis of the regional as well as global shaving cream market trends, key players, market segments, application areas, and shaving cream market growth strategies.
Shaving cream Market Report Highlights
| Aspects | Details |
| Market Size By 2032 | USD 35.4 billion |
| Growth Rate | CAGR of 8.7% |
| Forecast period | 2022 - 2032 |
| Report Pages | 200 |
| By End User |
|
| By Price Point |
|
| By Distribution Channel |
|
| By Region |
|
| Key Market Players | BAXTER OF CALIFORNIA, Colgate-Palmolive Company (Softsoap), Beiersdorf AG (Nivea), Dollar Shave Club, Captain's Choice, bulldog skincare for men, Billy Jealousy, Barbasol, Cremo Company, LLC, ArtNaturals |
Analyst Review
The perspectives of the leading CXOs in the shaving cream market are presented in this section. Shaving cream is essential to the entire shaving process because it lubricates, moisturizes, and guards against razor burns and skin irritation. The market for shaving cream is being driven by several factors, such as the expanding significance of skincare, an increase in disposable income, and a greater emphasis on personal grooming. In response to consumer expectations, manufacturers consistently innovate by launching products with improved formulations, natural ingredients, and targeted benefits like eco-friendliness, anti-aging, or sensitive skin care.
According to CXOs, a diverse array of products, such as contemporary formulations like creams and serums as well as classic foams and gels, define this sector. In order to stand out from the competition and attract consumers in this highly competitive marketplace, brands frequently use marketing strategies, distinctive product formulas, and packaging. The emergence of e-commerce platforms has broadened the scope of shaving cream products by enabling customers to simply browse and buy a variety of alternatives. In addition, the market has seen a trend toward cruelty-free and ecological products, which is in line with the increasing emphasis on sustainable choices throughout the world.
The global shaving cream market was valued at $15,815.4 million in 2022, and is projected to reach $35,359.9 million by 2032, registering a CAGR of 8.7% from 2023 to 2032.
The forecast period in the Shaving cream market report is 2023 to 2032.
The base year calculated in the Shaving cream market report is 2022.
The top companies analyzed for the Shaving cream market report are Procter & Gamble (P&G) – Gillette, Unilever - Dove, Axe, Edgewell Personal Care - Edge, Skintimate, Colgate-Palmolive - Colgate Shaving Cream, The Art of Shaving, Pacific Shaving Company, Cremo Company, Barbasol, Proraso, and Nivea (Beiersdorf).
The men segment is the most influential segment in the Shaving cream market report.
Europe holds the maximum market share of the Shaving cream market.
The company profile has been selected on the basis of key developments such as partnership, product launch, merger and acquisition.
The market value of the Shaving cream market in 2022 was $15,815.4 million.
Loading Table Of Content...
Loading Research Methodology...

