A08511 | Pages: 219 | Dec 2021 | 4046 Views | | |
Author(s) : Prateek Yadav , Sonia Mutreja | Tables: 101 | Charts: 76 |
|
Pandemic disrupted the entire world and affected many industries.
Get detailed COVID-19 impact analysis on the Shipbuilding Market
Request Now !
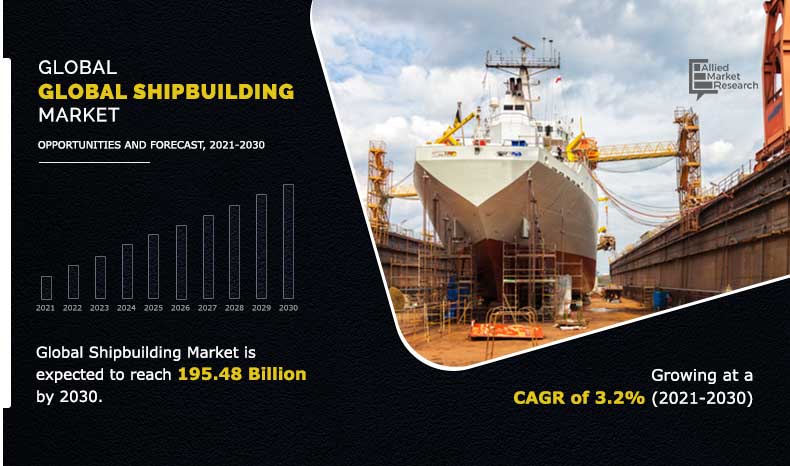
The global shipbuilding market was valued at $142.52 billion in 2020, and is projected to reach $195.48 billion by 2030, registering a CAGR of 3.2% during the forecast period. Shipbuilding refers to construction of ships and other floating vessels. It normally takes place in a specialized facility known as a shipyard. Shipbuilders are also called shipwrights. The shipbuilding industry is accountable for design and construction of oceangoing vessels all around the globe. Presently, the global shipbuilding industry is dominated by Asia-Pacific followed by Europe, North America, and LAMEA. Asia-Pacific is expected to maintain its dominance in the global market particularly in China, South Korea, and Japan due to some discrete advantages; such as relatively cheaper pays, strong government support, and strong forward & backward connection of industries. Shipbuilding is a highly capital-intensive industry, owing to which strong government support and political stability is prerequisite to survive this industry.
The COVID-19 pandemic outbreak has caused widespread economic downturn as several countries imposed strict lockdowns to contain the infection. This has affected diverse industries; manufacturing is one of the severely impacted sectors. Shipbuilding industry has witnessed decline in the pandemic, owing to disturbances in the supply chain. COVID-19 had a negative impact on the shipbuilding market and has affected the shipbuilding business in several countries. The shipbuilding market is currently hampered due to impact of virus on labour force. This has disrupted production and caused delays in the delivery of ships to buyers which further resulted in extra expenditures for shipbuilders. However, owing to the growing vaccination numbers globally coupled with gradual increase in the seaborne trade, the shipbuilding market is foreseen to augur well in near future.
Key factors driving growth of the global shipbuilding market are GDP growth, improved economic growth, global seaborne trade, increase in demand for cargo transportation through ships, rise in trade-related agreements, technological advancements in marine vessel engines, and trend of automation in marine transportation. However, fluctuations in transportation and inventory costs, coupled with environmental concerns associated with marine vessels are some noteworthy trends that could hamper growth of the market.
Get more information on this report : Request Sample Pages
The global shipbuilding market is segmented on the basis of type, end-use, and region. By type, the market is categorized into oil tankers, bulk carriers, general cargo ships, container ships, passenger ships, and others. On the basis of end-use, the global shipbuilding market is categorized into transport and military. Region wise, it is studied across North America, Europe, Asia-Pacific, and LAMEA.
The key players profiled in the global shipbuilding market includes companies such as BAE Systems PLC, Damen Shipyards group, Fincantieri group, General Dynamics corporation, Huntington Ingalls industries, Korea Shipbuilding & Offshore Engineering, Mitsubishi Heavy Industries, Oshima Shipbuilding co. ltd, Samsuung Heavy Industries, and Sumitomo Heavy Industries.
Get more information on this report : Request Sample Pages
Maritime transport is the backbone of globalization and industrialization, which supports supply chains and enables international trade. Maritime transport has seen a robust growth in the last decade, owing to rise in demand for bulk products such as crude oil, steel, ore, and finished products such as vehicles, mostly from developing countries. Around 80% of the global trade by volume is carried over the sea or other waterways and handled by seaports worldwide. As per the UNCTAD, in 2016, 10,303 million tons of loads were transported through waterways, which increased to 11,055 million tons in 2019 and 10,631 million tons in 2020. Moreover, gradual rise in international seaborne trade or maritime transport is expected to boost demand for tankers, cargo ships, and bulk carriers, which further reinforces the shipbuilding industry outlook.
Numerous trade-related agreements have been carried out between developed and developing nations to transport goods. Thus, suppliers have shifted their preference toward waterways as a better and efficient means of transportation. This increased inclination has led cargo vessel manufacturers to develop better and efficient container carriers of different sizes and capacities, propels growth of the global market. In addition, free trade agreements have enabled a reduction in duties and taxes. Furthermore, increase has been witnessed in trade activities as exporters and importers need not pay taxes to the government. Countries in trade blocs are lifting bans and making trade more flexible. Hence, rise in trade related agreements leads to increase in demand for stronger containers, thereby supplementing growth of the global shipbuilding market.
Get more information on this report : Request Sample Pages
The COVID-19 pandemic outbreak has caused widespread economic downturn as several countries imposed strict lockdowns to contain the infection. This has affected diverse industries; manufacturing is one of the severely impacted sectors. There has been significant impact on supply chains globally. Shipbuilding companies have faced huge losses during the first & second quarter of 2020, owing to disrupted supply chains and production schedules. Rapid spread of COVID-19 in the U.S., Europe, and Asian economies resulted in nationwide lockdowns and a temporary halt of production facilities to prevent further spread. Moreover, COVID-19 outbreak has resulted in disruptions for shipyards in terms of new building, repair and conversion projects. This outbreak has forced some of the companies to shut down their shipyard operations in several countries. For instance, in 2021, in China, Samsung Heavy industries has decided to shut down their 26-year-old Ningbo shipyard in eastern china. In addition, in 2020, Irving Shipbuilding has issued layoff notices impacting 1100 of 1800 workers & temporarily shut down Halifax shipyard for three weeks.
Get more information on this report : Request Sample Pages
Key Benefits For Stakeholders
Key Market Segments
Key Market Players
CHAPTER 1:INTRODUCTION
1.1.Report description
1.2.Key benefits for stakeholders
1.3.Key market segments
1.4.Research methodology
1.4.1.Primary research
1.4.2.Secondary research
1.4.3.Analyst tools and models
CHAPTER 2:EXECUTIVE SUMMARY
2.1.CXO perspective
CHAPTER 3:MARKET OVERVIEW
3.1.Market definition and scope
3.2.Key findings
3.2.1.Top impacting factors
3.2.2.Top investment pockets
3.2.3.Top winning strategies
3.3.Porter’s five forces analysis
3.4.Key player positioning (2020)
3.5.Market dynamics
3.5.1.Drivers
3.5.1.1.Gradual rise in international seaborne trade
3.5.1.2.Increase in demand for cargo transportation through ships
3.5.1.3.Rise in trade-related agreements
3.5.1.4.Technological advancements in marine vessel engines
3.5.2.Restraints
3.5.2.1.Fluctuations in transportation and inventory costs
3.5.2.2.Environmental concerns associated with marine vessels
3.5.3.Opportunities
3.5.3.1.Trend of automation in marine transportation
3.5.3.2.Increase in marine safety norms
3.6.Impact of COVID-19 on the market
3.6.1.Evolution of outbreaks
3.6.1.1.COVID-19
3.6.2.Micro-economic impact analysis
3.6.2.1.Consumer trend
3.6.2.2.Technology trends
3.6.2.3.Regulatory trend
3.6.2.4.Macroeconomic impact analysis
3.6.3.Impact on the Shipbuilding industry analysis
CHAPTER 4:SHIPBUILDING MARKET, TYPE
4.1.Overview
4.2.Oil tankers
4.2.1.Key market trends, growth factors, and opportunities
4.2.2.Market size and forecast, by region
4.2.3.Market analysis, by country
4.3.Bulk carriers
4.3.1.Key market trends, growth factors, and opportunities
4.3.2.Market size and forecast, by region
4.3.3.Market analysis, by country
4.4.General cargo ships
4.4.1.Key market trends, growth factors, and opportunities
4.4.2.Market size and forecast, by region
4.4.3.Market analysis, by country
4.5.Container ships
4.5.1.Key market trends, growth factors, and opportunities
4.5.2.Market size and forecast, by region
4.5.3.Market analysis, by country
4.6.Passenger ships
4.6.1.Key market trends, growth factors, and opportunities
4.6.2.Market size and forecast, by region
4.6.3.Market analysis, by country
4.7.Others
4.7.1.Key market trends, growth factors, and opportunities
4.7.2.Market size and forecast, by region
4.7.3.Market analysis, by country
CHAPTER 5:SHIPBUILDING MARKET, BY END-USE
5.1.Overview
5.2.Transport
5.2.1.Key market trends, growth factors, and opportunities
5.2.2.Market size and forecast, by region
5.2.3.Market analysis, by country
5.3.Military
5.3.1.Key market trends, growth factors, and opportunities
5.3.2.Market size and forecast, by region
5.3.3.Market analysis, by country
CHAPTER 6:SHIPBUILDING MARKET, BY REGION
6.1.Overview
6.2.North America
6.2.1.Key market trends, growth factors, and opportunities
6.2.2.Market size and forecast, by Type
6.2.3.Market size and forecast, by End-Use
6.2.4.Market size and forecast, by country
6.2.4.1.U.S.
6.2.4.1.1.Market size and forecast, by Type
6.2.4.1.2.Market size and forecast, by End-Use
6.2.4.2.Canada
6.2.4.2.1.Market size and forecast, by Type
6.2.4.2.2.Market size and forecast, by End-Use
6.2.4.3.Mexico
6.2.4.3.1.Market size and forecast, by Type
6.2.4.3.2.Market size and forecast, by End-Use
6.3.Europe
6.3.1.Key market trends, growth factors, and opportunities
6.3.2.Market size and forecast, by Type
6.3.3.Market size and forecast, by End-Use
6.3.4.Market size and forecast, by country
6.3.4.1.Germany
6.3.4.1.1.Market size and forecast, by Type
6.3.4.1.2.Market size and forecast, by End-Use
6.3.4.2.UK
6.3.4.2.1.Market size and forecast, by Type
6.3.4.2.2.Market size and forecast, by End-Use
6.3.4.3.France
6.3.4.3.1.Market size and forecast, by Type
6.3.4.3.2.Market size and forecast, by End-Use
6.3.4.4.Rest of Europe
6.3.4.4.1.Market size and forecast, by Type
6.3.4.4.2.Market size and forecast, by End-Use
6.4.Asia-Pacific
6.4.1.Key market trends, growth factors, and opportunities
6.4.2.Market size and forecast, by Type
6.4.3.Market size and forecast, by End-Use
6.4.4.Market size and forecast, by country
6.4.4.1.China
6.4.4.1.1.Market size and forecast, by Type
6.4.4.1.2.Market size and forecast, by End-Use
6.4.4.2.Japan
6.4.4.2.1.Market size and forecast, by Type
6.4.4.2.2.Market size and forecast, by End-Use
6.4.4.3.South Korea
6.4.4.3.1.Market size and forecast, by Type
6.4.4.3.2.Market size and forecast, by End-Use
6.4.4.4.Rest of Asia-Pacific
6.4.4.4.1.Market size and forecast, by Type
6.4.4.4.2.Market size and forecast, by End-Use
6.5.LAMEA
6.5.1.Key market trends, growth factors, and opportunities
6.5.2.Market size and forecast, by Type
6.5.3.Market size and forecast, by End-Use
6.5.4.Market size and forecast, by country
6.5.4.1.Latin America
6.5.4.1.1.Market size and forecast, by Type
6.5.4.1.2.Market size and forecast, by End-Use
6.5.4.2.Middle East
6.5.4.2.1.Market size and forecast, by Type
6.5.4.2.2.Market size and forecast, by End-Use
6.5.4.3.Africa
6.5.4.3.1.Market size and forecast, by Type
6.5.4.3.2.Market size and forecast, by End-Use
CHAPTER 7:COMPANY PROFILES
7.1.BAE SYSTEMS PLC
7.1.1.Company overview
7.1.2.Key executives
7.1.3.Company snapshot
7.1.4.Operating business segments
7.1.5.Product portfolio
7.1.6.R&D expenditure
7.1.7.Business performance
7.1.8.Key strategic moves and developments
7.2.DAMEN SHIPYARDS GROUP
7.2.1.Company overview
7.2.2.Key executives
7.2.3.Company snapshot
7.2.4.Product portfolio
7.2.5.Key strategic moves and developments
7.3.FINCANTIERI GROUP
7.3.1.Company overview
7.3.2.Key executives
7.3.3.Company snapshot
7.3.4.Operating business segments
7.3.5.Product portfolio
7.3.6.R&D expenditure
7.3.7.Business performance
7.3.8.Key strategic moves and developments
7.4.GENERAL DYNAMICS CORPORATION
7.4.1.Company overview
7.4.2.Key executives
7.4.3.Company snapshot
7.4.4.Operating business segments
7.4.5.Product portfolio
7.4.6.R&D expenditure
7.4.7.Business performance
7.4.8.Key strategic moves and developments
7.5.HUNTINGTON INGALLS INDUSTRIES, INC.
7.5.1.Company overview
7.5.2.Key executives
7.5.3.Company snapshot
7.5.4.Operating business segments
7.5.5.Product portfolio
7.5.6.R&D expenditure
7.5.7.Business performance
7.5.8.Key strategic moves and developments
7.6.KOREA SHIPBUILDING & OFFSHORE ENGINEERING CO., LTD. (HYUNDAI HEAVY INDUSTRIES CO., LTD.)
7.6.1.Company overview
7.6.2.Key executives
7.6.3.Company snapshot
7.6.4.Operating business segments
7.6.5.Product portfolio
7.6.6.R&D expenditure
7.6.7.Business performance
7.6.8.Key strategic moves and developments
7.7.MITSUBISHI HEAVY INDUSTRIES, LTD.
7.7.1.Company overview
7.7.2.Key executives
7.7.3.Company snapshot
7.7.4.Operating business segments
7.7.5.Product portfolio
7.7.6.R&D expenditure
7.7.7.Business performance
7.7.8.Key strategic moves and developments
7.8.OSHIMA SHIPBUILDING CO., LTD.
7.8.1.Company overview
7.8.2.Key executives
7.8.3.Company snapshot
7.8.4.Product portfolio
7.8.5.Key strategic moves and developments
7.9.SAMSUNG HEAVY INDUSTRIES CO., LTD.
7.9.1.Company overview
7.9.2.Key executives
7.9.3.Company snapshot
7.9.4.Operating business segments
7.9.5.Product portfolio
7.9.6.R&D expenditure
7.9.7.Business performance
7.9.8.Key strategic moves and developments
7.10.SUMITOMO HEAVY INDUSTRIES, LTD.
7.10.1.Company overview
7.10.2.Key executives
7.10.3.Company snapshot
7.10.4.Operating business segments
7.10.5.Product portfolio
7.10.6.R&D expenditure
7.10.7.Business performance
7.10.8.Key strategic moves and developments
LIST OF TABLES
TABLE 01.SHIPBUILDING MARKET, BY TYPE, 2020–2030 ($MILLION)
TABLE 02.SHIPBUILDING MARKET FOR OIL TANKERS, BY REGION 2020–2030 ($MILLION)
TABLE 03.SHIPBUILDING MARKET FOR BULK CARRIERS, BY REGION 2020–2030 ($MILLION)
TABLE 04.SHIPBUILDING MARKET FOR GENERAL CARGO SHIPS, BY REGION 2020–2030 ($MILLION)
TABLE 05.SHIPBUILDING MARKET FOR CONTAINER SHIPS, BY REGION 2020–2030 ($MILLION)
TABLE 06.SHIPBUILDING MARKET FOR PASSENGER SHIPS, BY REGION 2020–2030 ($MILLION)
TABLE 07.SHIPBUILDING MARKET FOR OTHERS, BY REGION 2020–2030 ($MILLION)
TABLE 08.SHIPBUILDING MARKET, BY END-USE, 2020–2030 ($MILLION)
TABLE 09.SHIPBUILDING MARKET FOR PRE-OWNED VEHICES, BY REGION 2020–2030 ($MILLION)
TABLE 10.SHIPBUILDING MARKET FOR MILITARYS, BY REGION 2020–2030 ($MILLION)
TABLE 11.SHIPBUILDING MARKET, BY REGION 2020–2030 ($MILLION)
TABLE 12.NORTH AMERICA SHIPBUILDING MARKET, BY TYPE, 2020–2030 ($MILLION)
TABLE 13.NORTH AMERICA SHIPBUILDING MARKET, BY END-USE, 2020–2030 ($MILLION)
TABLE 14.U.S. SHIPBUILDING MARKET, BY TYPE, 2020–2030 ($MILLION)
TABLE 15.U.S. SHIPBUILDING MARKET, BY END-USE, 2020–2030 ($MILLION)
TABLE 16.CANADA SHIPBUILDING MARKET, BY TYPE, 2020–2030 ($MILLION)
TABLE 17.CANADA SHIPBUILDING MARKET, BY END-USE, 2020–2030 ($MILLION)
TABLE 18.MEXICO SHIPBUILDING MARKET, BY TYPE, 2020–2030 ($MILLION)
TABLE 19.MEXICO SHIPBUILDING MARKET, BY END-USE, 2020–2030 ($MILLION)
TABLE 20.EUROPE SHIPBUILDING MARKET, BY TYPE, 2020–2030 ($MILLION)
TABLE 21.EUROPE SHIPBUILDING MARKET, BY END-USE, 2020–2030 ($MILLION)
TABLE 22.GERMANY SHIPBUILDING MARKET, BY TYPE, 2020–2030 ($MILLION)
TABLE 23.GERMANY SHIPBUILDING MARKET, BY END-USE, 2020–2030 ($MILLION)
TABLE 24.UK SHIPBUILDING MARKET, BY TYPE, 2020–2030 ($MILLION)
TABLE 25.UK SHIPBUILDING MARKET, BY END-USE, 2020–2030 ($MILLION)
TABLE 26.FRANCE SHIPBUILDING MARKET, BY TYPE, 2020–2030 ($MILLION)
TABLE 27.FRANCE SHIPBUILDING MARKET, BY END-USE, 2020–2030 ($MILLION)
TABLE 28.REST OF EUROPE SHIPBUILDING MARKET, BY TYPE, 2020–2030 ($MILLION)
TABLE 29.REST OF EUROPE SHIPBUILDING MARKET, BY END-USE, 2020–2030 ($MILLION)
TABLE 30.ASIA-PACIFIC SHIPBUILDING MARKET, BY TYPE, 2020–2030 ($MILLION)
TABLE 31.ASIA-PACIFIC SHIPBUILDING MARKET, BY END-USE, 2020–2030 ($MILLION)
TABLE 32.CHINA SHIPBUILDING MARKET, BY TYPE, 2020–2030 ($MILLION)
TABLE 33.CHINA SHIPBUILDING MARKET, BY END-USE, 2020–2030 ($MILLION)
TABLE 34.JAPAN SHIPBUILDING MARKET, BY TYPE, 2020–2030 ($MILLION)
TABLE 35.JAPAN SHIPBUILDING MARKET, BY END-USE, 2020–2030 ($MILLION)
TABLE 36.SOUTH KOREA SHIPBUILDING MARKET, BY TYPE, 2020–2030 ($MILLION)
TABLE 37.SOUTH KOREA SHIPBUILDING MARKET, BY END-USE, 2020–2030 ($MILLION)
TABLE 38.REST OF ASIA-PACIFIC SHIPBUILDING MARKET, BY TYPE, 2020–2030 ($MILLION)
TABLE 39.REST OF ASIA-PACIFIC SHIPBUILDING MARKET, BY END-USE, 2020–2030 ($MILLION)
TABLE 40.LAMEA SHIPBUILDING MARKET, BY TYPE, 2020–2030 ($MILLION)
TABLE 41.LAMEA SHIPBUILDING MARKET, BY END-USE, 2020–2030 ($MILLION)
TABLE 42.LATIN AMERICA SHIPBUILDING MARKET, BY TYPE, 2020–2030 ($MILLION)
TABLE 43.LATIN AMERICA SHIPBUILDING MARKET, BY END-USE, 2020–2030 ($MILLION)
TABLE 44.MIDDLE EAST SHIPBUILDING MARKET, BY TYPE, 2020–2030 ($MILLION)
TABLE 45.MIDDLE EAST SHIPBUILDING MARKET, BY END-USE, 2020–2030 ($MILLION)
TABLE 46.AFRICA SHIPBUILDING MARKET, BY TYPE, 2020–2030 ($MILLION)
TABLE 47.AFRICA SHIPBUILDING MARKET, BY END-USE, 2020–2030 ($MILLION)
TABLE 48.BAE SYSTEMS PLC: KEY EXECUTIVES
TABLE 49.BAE SYSTEMS PLC: COMPANY SNAPSHOT
TABLE 50.BAE SYSTEMS PLC: OPERATING SEGMENTS
TABLE 51.BAE SYSTEMS PLC: PRODUCT PORTFOLIO
TABLE 52.BAE SYSTEMS PLC: R&D EXPENDITURE, 2018–2020 ($MILLION)
TABLE 53.BAE SYSTEMS PLC: NET SALES, 2018–2020 ($MILLION)
TABLE 54.DAMEN SHIPYARDS GROUP: KEY EXECUTIVE
TABLE 55.DAMEN SHIPYARDS GROUP: COMPANY SNAPSHOT
TABLE 56.DAMEN SHIPYARDS GROUP: PRODUCT PORTFOLIO
TABLE 57.FINCANTIERI GROUP: KEY EXECUTIVES
TABLE 58.FINCANTIERI GROUP: COMPANY SNAPSHOT
TABLE 59.FINCANTIERI GROUP: OPERATING SEGMENTS
TABLE 60.FINCANTIERI GROUP: PRODUCT PORTFOLIO
TABLE 61.FINCANTIERI GROUP: R&D EXPENDITURE, 2018–2020 ($MILLION)
TABLE 62.FINCANTIERI GROUP: NET SALES, 2018–2020 ($MILLION)
TABLE 63.GENERAL DYNAMICS CORPORATION: KEY EXECUTIVES
TABLE 64.GENERAL DYNAMICS CORPORATION: COMPANY SNAPSHOT
TABLE 65.GENERAL DYNAMICS CORPORATION: OPERATING SEGMENTS
TABLE 66.GENERAL DYNAMICS CORPORATION: PRODUCT PORTFOLIO
TABLE 67.GENERAL DYNAMICS CORPORATION: R&D EXPENDITURE, 2018–2020 ($MILLION)
TABLE 68.GENERAL DYNAMICS CORPORATION: NET SALES, 2018–2020 ($MILLION)
TABLE 69.HUNTINGTON INGALLS INDUSTRIES, INC.: KEY EXECUTIVES
TABLE 70.HUNTINGTON INGALLS INDUSTRIES, INC.: COMPANY SNAPSHOT
TABLE 71.HUNTINGTON INGALLS INDUSTRIES, INC.: OPERATING SEGMENTS
TABLE 72.HUNTINGTON INGALLS INDUSTRIES, INC.: PRODUCT PORTFOLIO
TABLE 73.HUNTINGTON INGALLS INDUSTRIES, INC.: R&D EXPENDITURE, 2018–2020 ($MILLION)
TABLE 74.HUNTINGTON INGALLS INDUSTRIES, INC.: NET SALES, 2018–2020 ($MILLION)
TABLE 75.KOREA SHIPBUILDING & OFFSHORE ENGINEERING CO., LTD.: KEY EXECUTIVES
TABLE 76.KOREA SHIPBUILDING & OFFSHORE ENGINEERING CO., LTD.: COMPANY SNAPSHOT
TABLE 77.KOREA SHIPBUILDING & OFFSHORE ENGINEERING CO., LTD.: OPERATING SEGMENTS
TABLE 78.KOREA SHIPBUILDING & OFFSHORE ENGINEERING CO., LTD.: PRODUCT PORTFOLIO
TABLE 79.KOREA SHIPBUILDING & OFFSHORE ENGINEERING CO., LTD.: R&D EXPENDITURE, 2018–2020 ($MILLION)
TABLE 80.KOREA SHIPBUILDING & OFFSHORE ENGINEERING CO., LTD.: NET SALES, 2018–2020 ($MILLION)
TABLE 81.MITSUBISHI HEAVY INDUSTRIES, LTD.: KEY EXECUTIVES
TABLE 82.MITSUBISHI HEAVY INDUSTRIES, LTD.: COMPANY SNAPSHOT
TABLE 83.MITSUBISHI HEAVY INDUSTRIES, LTD.: OPERATING SEGMENTS
TABLE 84.MITSUBISHI HEAVY INDUSTRIES, LTD.: PRODUCT PORTFOLIO
TABLE 85.MITSUBISHI HEAVY INDUSTRIES, LTD.: R&D EXPENDITURE, 2018–2020 ($MILLION)
TABLE 86.MITSUBISHI HEAVY INDUSTRIES, LTD.: NET SALES, 2018–2020 ($MILLION)
TABLE 87.OSHIMA SHIPBUILDING CO., LTD.: KEY EXECUTIVES
TABLE 88.OSHIMA SHIPBUILDING CO., LTD.: COMPANY SNAPSHOT
TABLE 89.OSHIMA SHIPBUILDING CO., LTD.: PRODUCT PORTFOLIO
TABLE 90.SAMSUNG HEAVY INDUSTRIES CO., LTD.: KEY EXECUTIVES
TABLE 91.SAMSUNG HEAVY INDUSTRIES CO., LTD.: COMPANY SNAPSHOT
TABLE 92.SAMSUNG HEAVY INDUSTRIES CO., LTD.: OPERATING SEGMENTS
TABLE 93.SAMSUNG HEAVY INDUSTRIES CO., LTD.: PRODUCT PORTFOLIO
TABLE 94.SAMSUNG HEAVY INDUSTRIES CO., LTD.: R&D EXPENDITURE, 2018–2020 ($MILLION)
TABLE 95.SAMSUNG HEAVY INDUSTRIES CO., LTD.: NET SALES, 2018–2020 ($MILLION)
TABLE 96.SUMITOMO HEAVY INDUSTRIES, LTD.: KEY EXECUTIVES
TABLE 97.SUMITOMO HEAVY INDUSTRIES, LTD.: COMPANY SNAPSHOT
TABLE 98.SUMITOMO HEAVY INDUSTRIES, LTD.: OPERATING SEGMENTS
TABLE 99.SUMITOMO HEAVY INDUSTRIES, LTD.: PRODUCT PORTFOLIO
TABLE 100.SUMITOMO HEAVY INDUSTRIES, LTD.: R&D EXPENDITURE, 2018–2020 ($MILLION)
TABLE 101.SUMITOMO HEAVY INDUSTRIES, LTD.: NET SALES, 2018–2020 ($MILLION)
LIST OF FIGURES
FIGURE 01.KEY MARKET SEGMENTS
FIGURE 02.EXECUTIVE SUMMARY, BY SEGMENT
FIGURE 03.EXECUTIVE SUMMARY, BY COUNTRY
FIGURE 04.TOP IMPACTING FACTORS
FIGURE 05.TOP INVESTMENT POCKETS
FIGURE 06.TOP WINNING STRATEGIES, BY YEAR, 2018–2021*
FIGURE 07.TOP WINNING STRATEGIES, BY YEAR, 2018–2021*
FIGURE 08.TOP WINNING STRATEGIES, BY COMPANY, 2018–2021*
FIGURE 09.MODERATE BARGAINING POWER OF SUPPLIERS
FIGURE 10.MODERATE BARGAINING POWER OF BUYERS
FIGURE 11.MODERATE-TO-HIGH OF NEW ENTRANTS
FIGURE 12.MODERATE OF SUBSTITUTES
FIGURE 13.MODERATE COMPETITIVE RIVALARY
FIGURE 14.KEY PLAYER POSITIOING (2020)
FIGURE 15.INTERNATIONAL SEABORNE TRADE (MN OF TONS)
FIGURE 16.MACRO-ECONOMIC INDICATORS PROJECTIONS (1/2):
FIGURE 17.MACRO-ECONOMIC INDICATORS PROJECTIONS (2/2):
FIGURE 18.SHIPBUILDING MARKET SHARE, BY TYPE, 2020–2030 (%)
FIGURE 19.COMPARATIVE SHARE ANALYSIS OF SHIPBUILDING MARKET FOR ELECTRIC SHIPBUILDING, BY COUNTRY, 2020 & 2030(%)
FIGURE 20.COMPARATIVE SHARE ANALYSIS OF SHIPBUILDING MARKET FOR BULK CARRIERS, BY COUNTRY, 2020 & 2030(%)
FIGURE 21.COMPARATIVE SHARE ANALYSIS OF SHIPBUILDING MARKET FOR GENERAL CARGO SHIPS, BY COUNTRY, 2020 & 2030(%)
FIGURE 22.COMPARATIVE SHARE ANALYSIS OF SHIPBUILDING MARKET FOR CONTAINER SHIPS, BY COUNTRY, 2020 & 2030(%)
FIGURE 23.COMPARATIVE SHARE ANALYSIS OF SHIPBUILDING MARKET FOR PASSENGER SHIPS, BY COUNTRY, 2020 & 2030(%)
FIGURE 24.COMPARATIVE SHARE ANALYSIS OF SHIPBUILDING MARKET FOR OTHERS, BY COUNTRY, 2020 & 2030(%)
FIGURE 25.SHIPBUILDING MARKET SHARE, BY END-USE, 2020–2030 (%)
FIGURE 26.COMPARATIVE SHARE ANALYSIS OF SHIPBUILDING MARKET FOR TRANSPORT, BY COUNTRY, 2020 & 2030(%)
FIGURE 27.COMPARATIVE SHARE ANALYSIS OF SHIPBUILDING MARKET FOR MILITARYS, BY COUNTRY, 2020 & 2030(%)
FIGURE 28.SHIPBUILDING MARKET, BY REGION, 2021–2030 (%)
FIGURE 29.COMPARATIVE SHARE ANALYSIS OF SHIPBUILDING MARKET, BY COUNTRY, 2020–2030 (%)
FIGURE 30.U.S. SHIPBUILDING MARKET, 2020–2030 ($MILLION)
FIGURE 31.CANADA SHIPBUILDING MARKET, 2020–2030 ($MILLION)
FIGURE 32.MEXICO SHIPBUILDING MARKET, 2020–2030 ($MILLION)
FIGURE 33.COMPARATIVE SHARE ANALYSIS OF SHIPBUILDING MARKET, BY COUNTRY, 2020–2030 (%)
FIGURE 34.GERMANY SHIPBUILDING MARKET, 2020–2030 ($MILLION)
FIGURE 35.UK SHIPBUILDING MARKET, 2020–2030 ($MILLION)
FIGURE 36.FRANCE SHIPBUILDING MARKET, 2020–2030 ($MILLION)
FIGURE 37.REST OF EUROPE SHIPBUILDING MARKET, 2020–2030 ($MILLION)
FIGURE 38.COMPARATIVE SHARE ANALYSIS OF SHIPBUILDING MARKET, BY COUNTRY, 2020–2030 (%)
FIGURE 39.CHINA SHIPBUILDING MARKET, 2020–2030 ($MILLION)
FIGURE 40.JAPAN SHIPBUILDING MARKET, 2020–2030 ($MILLION)
FIGURE 41.SOUTH KOREA SHIPBUILDING MARKET, 2020–2030 ($MILLION)
FIGURE 42.REST OF ASIA-PACIFIC SHIPBUILDING MARKET, 2020–2030 ($MILLION)
FIGURE 43.COMPARATIVE SHARE ANALYSIS OF SHIPBUILDING MARKET, BY COUNTRY, 2020–2030 (%)
FIGURE 44.LATIN AMERICA SHIPBUILDING MARKET, 2020–2030 ($MILLION)
FIGURE 45.MIDDLE EAST SHIPBUILDING MARKET, 2020–2030 ($MILLION)
FIGURE 46.AFRICA SHIPBUILDING MARKET, 2020–2030 ($MILLION)
FIGURE 47.BAE SYSTEMS PLC: R&D EXPENDITURE, 2018–2020 ($MILLION)
FIGURE 48.BAE SYSTEMS PLC: NET SALES, 2018–2020 ($MILLION)
FIGURE 49.BAE SYSTEMS PLC: REVENUE SHARE BY SEGMENT, 2020 (%)
FIGURE 50.BAE SYSTEMS PLC: REVENUE SHARE BY REGION, 2020 (%)
FIGURE 51.FINCANTIERI GROUP: R&D EXPENDITURE, 2018–2020 ($MILLION)
FIGURE 52.FINCANTIERI GROUP: NET SALES, 2018–2020 ($MILLION)
FIGURE 53.FINCANTIERI GROUP: REVENUE SHARE BY SEGMENT, 2020 (%)
FIGURE 54.FINCANTIERI GROUP: REVENUE SHARE BY REGION, 2020 (%)
FIGURE 55.GENERAL DYNAMICS CORPORATION: R&D EXPENDITURE, 2018–2020 ($MILLION)
FIGURE 56.GENERAL DYNAMICS CORPORATION: NET SALES, 2018–2020 ($MILLION)
FIGURE 57.GENERAL DYNAMICS CORPORATION: REVENUE SHARE BY SEGMENT, 2020 (%)
FIGURE 58.GENERAL DYNAMICS CORPORATION: REVENUE SHARE BY REGION, 2020 (%)
FIGURE 59.HUNTINGTON INGALLS INDUSTRIES, INC.: R&D EXPENDITURE, 2018–2020 ($MILLION)
FIGURE 60.HUNTINGTON INGALLS INDUSTRIES, INC.: NET SALES, 2018–2020 ($MILLION)
FIGURE 61.HUNTINGTON INGALLS INDUSTRIES, INC.: REVENUE SHARE BY SEGMENT, 2020 (%)
FIGURE 62.KOREA SHIPBUILDING & OFFSHORE ENGINEERING CO., LTD.: R&D EXPENDITURE, 2018–2020 ($MILLION)
FIGURE 63.KOREA SHIPBUILDING & OFFSHORE ENGINEERING CO., LTD.: NET SALES, 2018–2020 ($MILLION)
FIGURE 64.KOREA SHIPBUILDING & OFFSHORE ENGINEERING CO., LTD.: REVENUE SHARE BY SEGMENT, 2020 (%)
FIGURE 65.MITSUBISHI HEAVY INDUSTRIES, LTD.: R&D EXPENDITURE, 2018–2020 ($MILLION)
FIGURE 66.MITSUBISHI HEAVY INDUSTRIES, LTD.: NET SALES, 2018–2020 ($MILLION)
FIGURE 67.MITSUBISHI HEAVY INDUSTRIES, LTD.: REVENUE SHARE BY SEGMENT, 2020 (%)
FIGURE 68.MITSUBISHI HEAVY INDUSTRIES, LTD.: REVENUE SHARE BY REGION, 2020 (%)
FIGURE 69.SAMSUNG HEAVY INDUSTRIES CO., LTD.: R&D EXPENDITURE, 2018–2020 ($MILLION)
FIGURE 70.SAMSUNG HEAVY INDUSTRIES CO., LTD.: NET SALES, 2018–2020 ($MILLION)
FIGURE 71.SAMSUNG HEAVY INDUSTRIES CO., LTD.: REVENUE SHARE BY SEGMENT, 2020 (%)
FIGURE 72.SAMSUNG HEAVY INDUSTRIES CO., LTD.: REVENUE SHARE BY REGION, 2020 (%)
FIGURE 73.SUMITOMO HEAVY INDUSTRIES, LTD.: R&D EXPENDITURE, 2018–2020 ($MILLION)
FIGURE 74.SUMITOMO HEAVY INDUSTRIES, LTD.: NET SALES, 2018–2020 ($MILLION)
FIGURE 75.SUMITOMO HEAVY INDUSTRIES, LTD.: REVENUE SHARE BY SEGMENT, 2020 (%)
FIGURE 76.SUMITOMO HEAVY INDUSTRIES, LTD.: REVENUE SHARE BY REGION, 2020 (%)
This section provides opinions of various top-level CXOs in the shipbuilding market. The market is supplemented by numerous developments carried out by top shipbuilding players, which has led to growth of the market. Moreover, continuous product development followed by increased trade agreements carried out between countries supplements growth of the global shipbuilding market.
For instance, in November 2019, Alnmaritec Ltd, developed & delivered first in class Wave Handler 1100 vessel, which is designed to support FPSO Egina in Nigeria. Similarly, in April 2021, Damen Shipyards Group launched Star Tug 1004 to ‘Corps van Vletterlieden’ for operations on port of Ijmuiden situated in the north of the Netherlands. Such developments and product launches supplement growth of the market. Currently, the global shipbuilding industry is dominated by Asia-Pacific mainly by China, South Korea, and Japan. Asia-Pacific is anticipated to maintain its dominance in the global shipbuilding market in the future, owing to some discrete advantages; such as cheaper pays, strong government support, and strong forward & backward connection industries. Currently, the shipbuilding market is expected to witness a steady growth. In addition, to entice the next generation of maritime authorities, shipyards need to become more advanced and innovative, technologically advanced, and must learn new skills and adopt new technology.
The key factors driving growth of the global shipbuilding market include GDP growth, improved economic growth, global seaborne trade, increase in demand for cargo transportation through ships and rise in trade-related agreements, technological advancements in marine vessel engines and trend of automation in marine transportation. However, fluctuations in transportation and inventory costs, coupled with environmental concerns associated with marine vessels are some noteworthy trends that could hamper growth of the market.
Clients can easily download both quantitative as well as
qualitative reports in PDF and excel formats.
Start reading instantly.
This Report and over 13,000+ thousand more Reports, Available with Avenue Library. T&C*.
Enterprise
License/PDF
*Taxes/Fees, if applicable will be added during checkout. All prices in USD
To ensure high-level data integrity, accurate analysis, and impeccable forecasts
For complete satisfaction
On-demand customization of scope of the report to exactly meet your needs
Targeted market view to provide pertinent information and save time of readers
Get insights on topics that are crucial for your business. Stay abreast of your interest areas.
To ensure high-level data integrity, accurate analysis, and impeccable forecasts
For complete satisfaction
On-demand customization of scope of the report to exactly meet your needs
Targeted market view to provide pertinent information and save time of readers