
Shoe With Knitted Upper Market Research, 2033
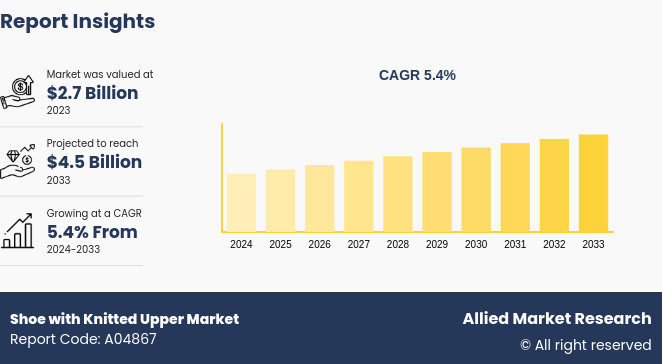
The global shoe with knitted upper market was valued at $2.7 billion in 2023, and is projected to reach $4.5 billion by 2033, growing at a CAGR of 5.4% from 2024 to 2033.
Market Introduction and Definition
The knitted upper refers to the upper material of shoe that is manufactured using knitting machine. With the improvement of living standards, higher demand has been witnessed for comfort of sportswear and athleisure such as lightweight, functional, and other aesthetic effects. Knitted technology can be directly used with dyed yarn without any dying process, and can be used with various colors. These shoes provide sock-like comfort and maintain a trendy yet athletic look. The shoe with knitted upper has become increasingly popular among the younger generation owing to the high influence of sports. The knitted upper shoe requires little to no manual labor while manufacturing and the only labor required is to fix the knitted part to the shoe. This allows footwear manufacturers to move production closer to their larger markets, which reduces or possibly eliminates the costs of shipping and tariffs.
Key Takeaways
The Shoe with Knitted Upper industry study covers 20 countries. The research includes a segment analysis of each country in terms of value ($Million) for the projected period 2023-2032.
More than 1, 500 product literatures, industry releases, annual reports, and other such documents of major energy storage system industry participants along with authentic industry journals, trade associations' releases, and government websites have been reviewed for generating high-value industry insights.
The study integrated high-quality data, professional opinions and analysis, and critical independent perspectives. The research approach is intended to provide a balanced view of global markets and to assist stakeholders in making educated decisions in order to achieve their most ambitious growth objectives.
Key Market Dynamics
The increasing consumer preference for comfort and personalized fit is a major driver for the knitted upper shoe market. Knitted uppers offer superior flexibility and adaptability to various foot shapes, enhancing overall comfort. This demand is reflected in the growth of athleisure and casual footwear segments, where knitted shoes are highly favored for their snug fit and breathability, increasing the Shoe with Knitted Upper Market Size.
Technological innovations, such as 3D knitting and seamless construction, are driving the market. These advancements enable the production of lightweight, durable, and high-performance footwear. Enhanced design capabilities and reduced material waste also contribute to the growing adoption of knitted uppers in the footwear industry, boosting the Shoe with Knitted Upper Market Growth.
The cost of advanced knitting technology and high-quality yarns can be significant, impacting the overall production costs of knitted upper shoes, affecting the Shoe with Knitted Upper Market Share. This can result in higher retail prices compared to traditional footwear, potentially limiting market growth among price-sensitive consumers.
Despite their comfort, knitted uppers may face durability issues compared to traditional materials, especially in high-wear scenarios. Concerns about wear and tear, as well as potential difficulty in maintaining the structural integrity of knitted uppers over time, can affect consumer confidence and limit widespread adoption.
There is a growing opportunity to leverage sustainability trends by using recycled and eco-friendly materials in knitted uppers. Incorporating sustainable practices aligns with increasing consumer awareness about environmental issues and can enhance brand appeal. Companies that innovate with recycled fibers and sustainable production processes can differentiate themselves in the market.
Value Chain of the Shoe with Knitted Upper Market
The value chain of shoes with knitted uppers encompasses several stages from inception to consumer delivery. It begins with design and development, where designers create patterns and select materials, integrating advanced knitting techniques like 3D knitting. Following this, material sourcing involves procuring high-quality yarns and fibers, which are essential for the knitted uppers. The knitting and manufacturing stage involves producing the knitted uppers using specialized machinery and techniques, followed by assembly where these uppers are combined with other shoe components such as soles and insoles. Quality control and testing ensure the shoes meet performance and durability standards. Once approved, the shoes are packaged for distribution. Effective distribution and retail strategies ensure that the product reaches various sales channels, including online platforms and physical stores. Marketing and sales efforts then promote the shoes, emphasizing their comfort, innovation, and sustainability. Post-sale, customer feedback is gathered to enhance future products, while customer service addresses any concerns. Finally, end-of-life management includes options for recycling or disposal, supporting sustainability efforts and minimizing environmental impact.
Market Segmentation
Shoe with knitted upper market?has been segmented based on type, distribution channel, and region. Based on type, the market is segmented into casual shoes, sports shoes, and running shoes. Based on the distribution channel, the market is divided into supermarkets & hypermarkets, specialty stores, e-commerce, and others. By region, the market has been studied across North America, Europe, Asia-Pacific, and LAMEA.
Regional/Country Market Outlook
In the United States, the market for shoes with knitted uppers has seen robust growth, driven by rising consumer demand for comfort and innovative footwear. According to the American Apparel & Footwear Association (AAFA) , the U.S. footwear market has experienced a significant increase in the adoption of knitted upper shoes, with annual growth rates of around 8% in recent years. This growth is supported by the booming athleisure and casual wear segments, where knitted shoes are popular for their flexibility and breathability. Additionally, technological advancements in knitting and sustainable materials are contributing to market expansion. The U.S. market's infrastructure, including advanced manufacturing capabilities and extensive retail networks, further supports the widespread availability and popularity of these products, increasing the Shoe with Knitted Upper Market Demand.
In China, the market for shoes with knitted uppers is also expanding rapidly, reflecting the country’s growing interest in innovative and comfortable footwear. The China National Textile and Apparel Council reports that the demand for knitted upper shoes has increased significantly due to the rising middle class and their growing preference for high-performance and stylish footwear. The market growth in China is fueled by technological advancements in manufacturing and a shift towards more sustainable and eco-friendly materials. The country's strong manufacturing base and large consumer market make it a significant player in the global knitted upper shoe market. According to a 2023 report by the Ministry of Industry and Information Technology, China’s footwear sector, including knitted upper shoes, is expected to continue its upward trajectory, with a projected annual growth rate of approximately 10% over the next five years.
Industry Trends
According to a report by the American Apparel & Footwear Association (AAFA) , the market for knitted upper shoes in the U.S. has seen an annual growth rate of approximately 8% over the past five years. This growth is attributed to the increasing demand for athleisure and casual footwear that combines functionality with modern aesthetics. A significant trend in the knitted upper shoe market is the shift towards sustainability. Consumers and manufacturers alike are focusing on eco-friendly materials and processes. The use of recycled fibers, such as PET (polyethylene terephthalate) bottles, in knitted uppers is on the rise. According to the Environmental Protection Agency (EPA) , the use of recycled materials in footwear is projected to increase by 15% annually, reflecting a broader industry trend towards reducing environmental impact. This shift is driven by growing consumer awareness and regulatory pressures to adopt more sustainable practices.
According to Shoe with Knitted Upper Market Forecast, the adoption of advanced knitting technologies, such as 3D knitting and seamless construction, is transforming the knitted upper shoe market. These innovations allow for greater design flexibility, reduced waste, and improved comfort. The International Textile Manufacturers Federation (ITMF) reports that 3D knitting technology has grown by 20% annually, as brands leverage these techniques to create more customized and performance-oriented footwear. These technological advancements are enhancing the functionality and appeal of knitted upper shoes, contributing to their increasing popularity in the global market.
According to a report by the American Apparel & Footwear Association (AAFA) , the market for knitted upper shoes in the U.S. has seen an annual growth rate of approximately 8% over the past five years. This growth is attributed to the increasing demand for athleisure and casual footwear that combines functionality with modern aesthetics. A significant trend in the knitted upper shoe market is the shift towards sustainability. Consumers and manufacturers alike are focusing on eco-friendly materials and processes. The use of recycled fibers, such as PET (polyethylene terephthalate) bottles, in knitted uppers is on the rise. According to the Environmental Protection Agency (EPA) , the use of recycled materials in footwear is projected to increase by 15% annually, reflecting a broader industry trend towards reducing environmental impact. This shift is driven by growing consumer awareness and regulatory pressures to adopt more sustainable practices.
The adoption of advanced knitting technologies, such as 3D knitting and seamless construction, is transforming the knitted upper shoe market. These innovations allow for greater design flexibility, reduced waste, and improved comfort. The International Textile Manufacturers Federation (ITMF) reports that 3D knitting technology has grown by 20% annually, as brands leverage these techniques to create more customized and performance-oriented footwear. These technological advancements are enhancing the functionality and appeal of knitted upper shoes, contributing to their increasing popularity in the global market.
Competitive Landscape
The key players in the shoe with knitted upper market focus on new product launch as the prominent strategy to improve product portfolio, overcome competition, and maintain or improve their shoe with knitted upper market in the global market. The key players profiled in the report include Adidas AG, Asics Corporation, FILA Korea ltd., Jack Wolfskin GmbH & Co. KGaA, K-SWISS (E. Land World Company, ltd.) , New Balance, Nike, Inc., Puma SE (Kering) , Skechers USA, Inc. and VF Corporation (VFC) .
Recent Key Strategies and Developments
In September 2021, New Balance collaborated with Stone Island and have released their initial 3D knit upper stripped-down look using 3D technology. The design details include the left foot featuring the Stone Island compass logo and the right foot with bold new balance graphics.
Key Sources Referred
American Apparel & Footwear Association (AAFA)
Ministry of Industry and Information Technology
Key Benefits For Stakeholders
- This report provides a quantitative analysis of the market segments, current trends, estimations, and dynamics of the shoe with knitted upper market analysis from 2024 to 2033 to identify the prevailing shoe with knitted upper market opportunities.
- The market research is offered along with information related to key drivers, restraints, and opportunities.
- Porter's five forces analysis highlights the potency of buyers and suppliers to enable stakeholders make profit-oriented business decisions and strengthen their supplier-buyer network.
- In-depth analysis of the shoe with knitted upper market segmentation assists to determine the prevailing market opportunities.
- Major countries in each region are mapped according to their revenue contribution to the global market.
- Market player positioning facilitates benchmarking and provides a clear understanding of the present position of the market players.
- The report includes the analysis of the regional as well as global shoe with knitted upper market trends, key players, market segments, application areas, and market growth strategies.
Shoe with Knitted Upper Market Report Highlights
| Aspects | Details |
| Market Size By 2033 | USD 4.5 Billion |
| Growth Rate | CAGR of 5.4% |
| Forecast period | 2024 - 2033 |
| Report Pages | 270 |
| By Type |
|
| By Distribution Channel |
|
| By Region |
|
| Key Market Players | Puma SE (Kering), VF Corporation (VFC), Adidas AG, K-SWISS (E. Land World Company, ltd.), Asics Corporation, New Balance, Jack Wolfskin GmbH & Co. KGaA, Nike, Inc., Skechers USA, Inc, FILA Korea ltd |
Analyst Review
Shoe with knitted upper are footwear in which the upper part of the shoe is made using machine knitted fabric.
Based on the interviews of various top-level CXOs of leading companies, the rise in the disposable income and improvements in the living standard has been the major factor driving the growth of the market. This rise in demand for this product is also attributed to the functional benefits such as the lightweight and comfort, which also supports its growth in the global market.
Furthermore, rise in the number of sports inspired children and rise in concerns about foot health among customers also boost the growth of the global shoe with knitted upper market. However, implementation of government regulations toward footwear industries majorly restricts the market growth.
The global shoe with knitted upper market was valued at $2.7 billion in 2023, and is projected to reach $4.5 billion by 2033, growing at a CAGR of 5.4% from 2024 to 2033.
The key players profiled in the report include Adidas AG, Asics Corporation, FILA Korea ltd., Jack Wolfskin GmbH & Co. KGaA, K-SWISS (E. Land World Company, ltd.), New Balance, Nike, Inc., Puma SE (Kering), Skechers USA, Inc. and VF Corporation (VFC).
Increasing use of recycled materials, such as recycled polyester and nylon, in knitted uppers to align with the growing emphasis on sustainability.
The primary application of knitted upper shoes is in the athleisure and casual wear segments.
The largest regional market for Shoe with Knitted Upper is North America.
Loading Table Of Content...

