0
2018
Silicon Fertilizer Market

Silicon Fertilizer Market

by Type (Calcium Silicate, Potassium Silicate and Sodium Silicate), Form (Liquid and Solid), and Application (Field Crops, Horticultural Crops, Hydroponics, Floriculture): Global Opportunity Analysis and Industry Forecast, 2016 - 2025

Report Code: A02444
Sep 2018 | Pages: 222
Tables: 115
Charts: 53
  • Formats*:

  • pdf

    Single User License, Five User
    License & Enterprise User License

  • xls

    Data Pack Excel License

  • ppt

    It comes with the additional cost
    of $2500.00 contact sales.


COVID-19

Pandemic disrupted the entire world and affected many industries.

Get detailed COVID-19 impact analysis on the Silicon Fertilizer Market

Request Now !

Silicon Fertilizer Market Overview:

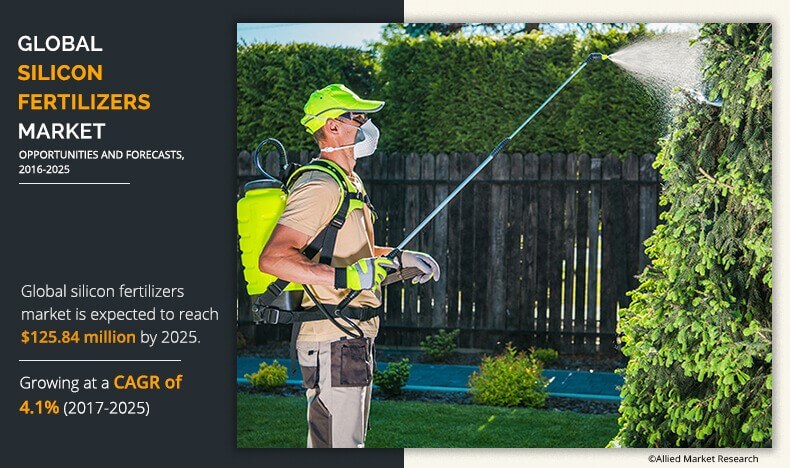
The global silicon fertilizer market was valued at $87.43 million in 2016 and is projected to reach $125.84 million by 2025, registering a CAGR of 4.1% from 2017 to 2025. Silicon fertilizers help resist diseases and insect attack, unfavorable climatic conditions, and improve physical & chemical soil properties as well as maintain nutrients in plants. These are used in different crops such as barley, wheat, corn, sugarcane, cucumber, citrus, tomato, and others for increased productivity along with sustainable production. Increasing applications of silicon fertilizers in field crops, hydroponics, and floriculture are expected to experience high demand in future.

Silicon-based fertilizer helps reduce PH and increases adsorption of essential minerals from the soil. It helps the plant overcome deficiency that mainly arises due to lack of proper nutrients in the soil. In addition, it improves the mechanical properties of a plant by improving elasticity and rigidity, and thus, protects plants against infection. This further increases the demand for silicon fertilizers. Large-scale requirement and high demand for field crops & horticultural crops in different regions further drive the demand for silicon fertilizers.

Silicon Fertilizer Market


The report on the global silicon fertilizer market is segmented based on type, form, application, and geography. Based on form, the global silicon fertilizer market is bifurcated into liquid and solid silicon fertilizers. According to type, the silicon fertilizer market is segmented into calcium silicate, potassium silicate, and sodium silicate. By application, the report is classified into field crops, horticultural crops, hydroponics, and floriculture. Based on region, the market is analyzed across North America, Europe, Asia-Pacific, and LAMEA

Silicon Fertilizer Market by Application


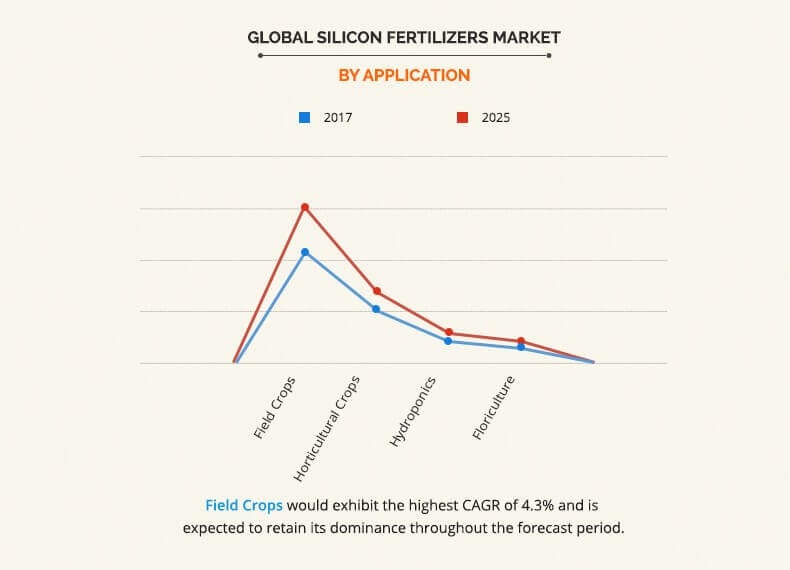
Field crops and horticultural crops segments are projected to be the top investment pockets owing to increase in consumption of food and rise in demand for healthy & nutritious food among the population across the globe. Silicon fertilizers help in the development of plant roots, prevent stalk lodging, resist bacterial and fungal diseases, and decrease some abiotic stress, which promote healthy growth of all field or horticultural crops. These help plants retain other essential micronutrients such as iron, copper, and boron, and thus, improves the productivity of all agronomic crops. The production of field crops and horticultural crops provides high returns to farmers & growers and thus, helps increase their profitability.

Silicon Fertilizer Market by Form


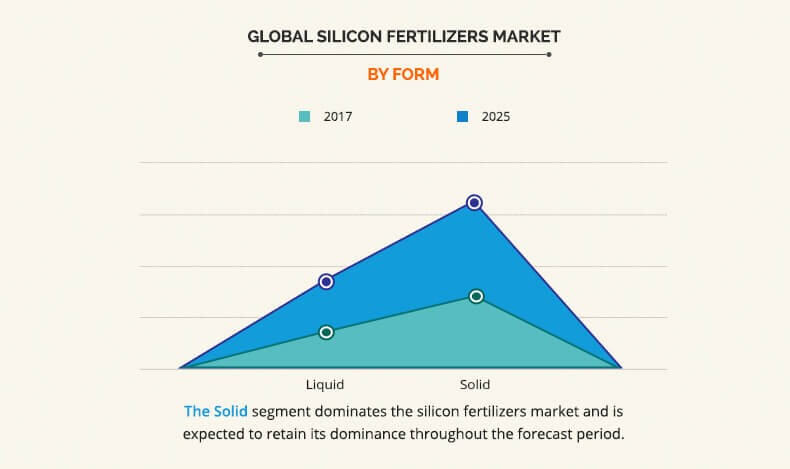
Liquid silicon fertilizers consist of products such as silicon acid or silicic acid, silicon conditioners, and other products. Liquid silicon plays an important role in the uptake and vascular transport of mineral nutrients and can improve the mechanical strength of the plant. These are mainly used for foliar application, as plants can only absorb silicon in silica acid form. It helps plants to fight diseases such as powdery mildew, septoria and eye-spot, insect pests, and others. New farming technologies such as hydroponics and floriculture, provide new opportunities for the growth of liquid silicon fertilizers in the market.


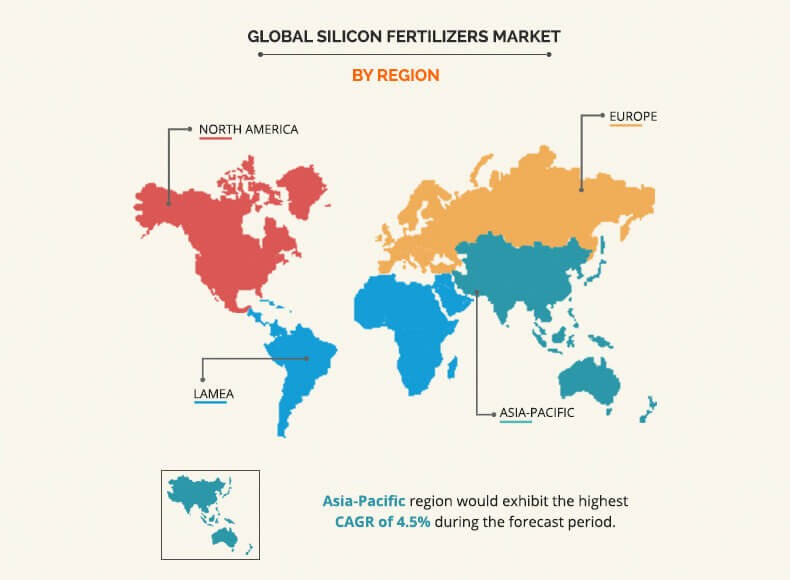
Asia-Pacific was the largest market for silicon fertilizers in terms of value in 2017. High demand for rice and wheat crops that are required on a large scale in different regions drive the growth of silicon fertilizers in this region. Several factors that fuel the demand for the staple food include an increase in per capita consumption owing to surge in global population and rise in demand for high-quality foods. All these factors contribute to an increase in demand for silicon fertilizers by growers, providing new opportunities for the silicon fertilizers market.

Top market players in the global silicon fertilizer market include Agripower, Aries Agro Ltd., BASF SE, Compass Minerals International, Inc., Denka Co. Ltd., MaxSil, Plant Tuff Inc., Redox Pty Ltd., The Mosaic Company, and Yara International ASA.

Key Benefits for the Silicon Fertilizer Market

  • The study provides an in-depth analysis of the global silicon fertilizer market with current trends and future estimations to elucidate the investment pockets.
  • Porter’s five forces analysis highlights the potency of buyers and suppliers to enable stakeholders to make profit-oriented business decisions and strengthen their supplierbuyer network
  • A comprehensive analysis of the factors that drive and restrict the growth of the silicon fertilizer market is provided.
  • The report provides a quantitative analysis to help stakeholders to capitalize on the prevailing market opportunities.
  • The report includes a detailed analysis of the regional as well as the global market, key players, market segments, application areas, and growth strategies.
  • Key players are profiled, and their strategies are analyzed thoroughly, which predict the competitive outlook of the silicon fertilizer market.

Silicon Fertilizer Market Report Highlights

Aspects Details
By Type
  • Calcium Silicate
  • Potassium Silicate
  • Sodium Silicate
By Form
  • Liquid
  • Solid
By Application
  • Field Crops
  • Horticultural Crops
  • Hydroponics
  • Floriculture
By Region
  • North America  (U.S., Canada, Mexico)
  • Europe  (Germany, Spain, UK, Italy, France, Rest of Europe)
  • Asia-Pacific  (China, India, Japan, Australia, South Korea, Rest of Asia-Pacific)
  • LAMEA  (Brazil, Argentina, South Africa, Turkey, Rest of LAMEA)
Key Market Players Aries Agro Ltd., Denka Co. Ltd., Redox Pty Ltd., Agripower, Compass Minerals International, Inc., Maxsil (Silicon Fertilisers Pty Ltd), BASF SE, Plant Tuff Inc., Yara International ASA, The Mosaic Company
 

CHAPTER 1: INTRODUCTION

1.1. Report Description
1.2. Key Benefits for Stakeholders
1.3. Key Market Segments
1.4. Research MethodologY

1.4.1. Primary Research
1.4.2. Secondary Research
1.4.3. Analyst Tools and Models

CHAPTER 2: EXECUTIVE SUMMARY

2.1. Key Findings of The Study
2.2. CXO Perspective

CHAPTER 3: MARKET OVERVIEW

3.1. Market Definition and Scope
3.2. Key Findings

3.2.1. Top investment pocket
3.2.2. Top impacting factors

3.3. Porter's Five Forces analysis

3.3.1. Bargaining power of suppliers
3.3.2. Bargaining power of buyers
3.3.3. Threat of substitution
3.3.4. Threat of new entrants
3.3.5. Intensity of competitive rivalry

3.4. Market dynamics

3.4.1. Drivers

3.4.1.1. Benefits of using silicon fertilizer
3.4.1.2. Population growth and limited availability of arable land
3.4.1.3. Growth of per capita GDP in developing countries

3.4.2. Restraints

3.4.2.1. Lack of awareness regarding dosage and proper application of silicon fertilizers among farmers
3.4.2.2. Poor availability of analytical laboratories for soil testing and plant tissue analysis for the nutrient requirement.

3.4.3. Opportunities

3.4.3.1. Increase in new methods of farming
3.4.3.2. Potential exploitable land

CHAPTER 4: SILICON FERTILIZER MARKET, BY TYPE

4.1. Overview

4.1.1. Market size and forecast

4.2. Calcium Silicate

4.2.1. Key market trends, growth factors, and opportunities
4.2.2. Market size and forecast
4.2.3. Market analysis by country

4.3. Potassium Silicate

4.3.1. Key market trends, growth factors, and opportunities
4.3.2. Market size and forecast
4.3.3. Market analysis by country

4.4. Sodium Silicate

4.4.1. Key market trends, growth factors, and opportunities
4.4.2. Market size and forecast
4.4.3. Market analysis by country

CHAPTER 5: SILICON FERTILIZER MARKET, BY FORM

5.1. Overview

5.1.1. Market size and forecast

5.2. Liquid

5.2.1. Key market trends, growth factors, and opportunities
5.2.2. Market size and forecast
5.2.3. Market analysis by country

5.3. Solid

5.3.1. Key market trends, growth factors, and opportunities
5.3.2. Market size and forecast
5.3.3. Market analysis by country

CHAPTER 6: SILICON FERTILIZER MARKET, BY APPLICATION

6.1. Overview

6.1.1. Market size and forecast

6.2. Field Crops

6.2.1. Key market trends, growth factors, and opportunities
6.2.2. Market size and forecast
6.2.3. Market analysis by country

6.3. Horticultural Crops

6.3.1. Key market trends, growth factors, and opportunities
6.3.2. Market size and forecast
6.3.3. Market analysis by country

6.4. Hydroponics

6.4.1. Key market trends, growth factors, and opportunities
6.4.2. Market size and forecast
6.4.3. Market analysis by country

6.5. Floriculture

6.5.1. Key market trends, growth factors, and opportunities
6.5.2. Market size and forecast
6.5.3. Market analysis by country

CHAPTER 7: SILICON FERTILIZER MARKET, BY REGION

7.1. Overview

7.1.1. Market size and forecast

7.2. North America

7.2.1. Key market trends, growth factors, and opportunities
7.2.2. Market size and forecast, by type
7.2.3. Market size and forecast, by form
7.2.4. Market size and forecast, by application
7.2.5. Market size and forecast, by country

7.2.5.1. U.S.

7.2.5.1.1. Market size and forecast
7.2.5.1.2. Market size and forecast, by type
7.2.5.1.3. Market size and forecast, by form
7.2.5.1.4. Market size and forecast, by application

7.2.5.2. Canada

7.2.5.2.1. Market size and forecast
7.2.5.2.2. Market size and forecast, by type
7.2.5.2.3. Market size and forecast, by form
7.2.5.2.4. Market size and forecast, by application

7.2.5.3. Mexico

7.2.5.3.1. Market size and forecast
7.2.5.3.2. Market size and forecast, by type
7.2.5.3.3. Market size and forecast, by form
7.2.5.3.4. Market size and forecast, by application

7.3. Europe

7.3.1. Key market trends, growth factors, and opportunities
7.3.2. Market size and forecast, by type
7.3.3. Market size and forecast, by form
7.3.4. Market size and forecast, by application
7.3.5. Market size and forecast, by country

7.3.5.1. Germany

7.3.5.1.1. Market size and forecast
7.3.5.1.2. Market size and forecast, by type
7.3.5.1.3. Market size and forecast, by form
7.3.5.1.4. Market size and forecast, by application

7.3.5.2. Spain

7.3.5.2.1. Market size and forecast
7.3.5.2.2. Market size and forecast, by type
7.3.5.2.3. Market size and forecast, by form
7.3.5.2.4. Market size and forecast, by application

7.3.5.3. UK

7.3.5.3.1. Market size and forecast
7.3.5.3.2. Market size and forecast, by type
7.3.5.3.3. Market size and forecast, by form
7.3.5.3.4. Market size and forecast, by application

7.3.5.4. Italy

7.3.5.4.1. Market size and forecast
7.3.5.4.2. Market size and forecast, by type
7.3.5.4.3. Market size and forecast, by form
7.3.5.4.4. Market size and forecast, by application

7.3.5.5. France

7.3.5.5.1. Market size and forecast
7.3.5.5.2. Market size and forecast, by type
7.3.5.5.3. Market size and forecast, by form
7.3.5.5.4. Market size and forecast, by application

7.3.5.6. Rest of Europe

7.3.5.6.1. Market size and forecast
7.3.5.6.2. Market size and forecast, by type
7.3.5.6.3. Market size and forecast, by form
7.3.5.6.4. Market size and forecast, by application

7.4. Asia-Pacific

7.4.1. Key market trends, growth factors, and opportunities
7.4.2. Market size and forecast, by type
7.4.3. Market size and forecast, by form
7.4.4. Market size and forecast, by application
7.4.5. Market size and forecast, by country

7.4.5.1. China

7.4.5.1.1. Market size and forecast
7.4.5.1.2. Market size and forecast, by type
7.4.5.1.3. Market size and forecast, by form
7.4.5.1.4. Market size and forecast, by application

7.4.5.2. India

7.4.5.2.1. Market size and forecast
7.4.5.2.2. Market size and forecast, by type
7.4.5.2.3. Market size and forecast, by form
7.4.5.2.4. Market size and forecast, by application

7.4.5.3. Japan

7.4.5.3.1. Market size and forecast
7.4.5.3.2. Market size and forecast, by type
7.4.5.3.3. Market size and forecast, by form
7.4.5.3.4. Market size and forecast, by application

7.4.5.4. Australia

7.4.5.4.1. Market size and forecast
7.4.5.4.2. Market size and forecast, by type
7.4.5.4.3. Market size and forecast, by form
7.4.5.4.4. Market size and forecast, by application

7.4.5.5. South Korea

7.4.5.5.1. Market size and forecast
7.4.5.5.2. Market size and forecast, by type
7.4.5.5.3. Market size and forecast, by form
7.4.5.5.4. Market size and forecast, by application

7.4.5.6. Rest of Asia-Pacific

7.4.5.6.1. Market size and forecast
7.4.5.6.2. Market size and forecast, by type
7.4.5.6.3. Market size and forecast, by form
7.4.5.6.4. Market size and forecast, by application

7.5. LAMEA

7.5.1. Key market trends, growth factors, and opportunities
7.5.2. Market size and forecast, by type
7.5.3. Market size and forecast, by form
7.5.4. Market size and forecast, by application
7.5.5. Market size and forecast, by country

7.5.5.1. Brazil

7.5.5.1.1. Market size and forecast
7.5.5.1.2. Market size and forecast, by type
7.5.5.1.3. Market size and forecast, by form
7.5.5.1.4. Market size and forecast, by application

7.5.5.2. Argentina

7.5.5.2.1. Market size and forecast
7.5.5.2.2. Market size and forecast, by type
7.5.5.2.3. Market size and forecast, by form
7.5.5.2.4. Market size and forecast, by application

7.5.5.3. South Africa

7.5.5.3.1. Market size and forecast
7.5.5.3.2. Market size and forecast, by type
7.5.5.3.3. Market size and forecast, by form
7.5.5.3.4. Market size and forecast, by application

7.5.5.4. Turkey

7.5.5.4.1. Market size and forecast
7.5.5.4.2. Market size and forecast, by type
7.5.5.4.3. Market size and forecast, by form
7.5.5.4.4. Market size and forecast, by application

7.5.5.5. Rest of LAMEA

7.5.5.5.1. Market size and forecast
7.5.5.5.2. Market size and forecast, by type
7.5.5.5.3. Market size and forecast, by form
7.5.5.5.4. Market size and forecast, by application

CHAPTER 1: COMPANY PROFILE

1.1. Plant Tuff Inc.

1.1.1. Company overview
1.1.2. Company snapshot
1.1.3. Product portfolio

1.2. Agripower

1.2.1. Company overview
1.2.2. Company snapshot
1.2.3. Product portfolio
1.2.4. Key strategic moves and developments

1.3. Maxsil (Silicon Fertilisers Pty Ltd)

1.3.1. Company overview
1.3.2. Company snapshot
1.3.3. Product portfolio

1.4. Denka Co. Ltd.

1.4.1. Company overview
1.4.2. Company snapshot
1.4.3. Operating business segments
1.4.4. Product portfolio
1.4.5. Business performance

1.5. Redox Pty Ltd.

1.5.1. Company overview
1.5.2. Company snapshot
1.5.3. Product portfolio
1.5.4. Business performance
1.5.5. Key strategic moves and developments

1.6. Aries Agro Ltd.

1.6.1. Company overview
1.6.2. Company snapshot
1.6.3. Operating business segments
1.6.4. Product portfolio
1.6.5. Business performance
1.6.6. Key strategic moves and developments

1.7. BASF SE

1.7.1. Company overview
1.7.2. Company snapshot
1.7.3. Operating business segments
1.7.4. Product portfolio
1.7.5. Business performance
1.7.6. Key strategic moves and developments

1.8. Compass Minerals International, Inc.

1.8.1. Company overview
1.8.2. Company snapshot
1.8.3. Operating business segments
1.8.4. Product portfolio
1.8.5. Business performance
1.8.6. Key strategic moves and developments

1.9. The Mosaic Company

1.9.1. Company overview
1.9.2. Company snapshot
1.9.3. Operating business segments
1.9.4. Product portfolio
1.9.5. Business performance
1.9.6. Key strategic moves and developments

1.10. Yara International ASA

1.10.1. Company overview
1.10.2. Company snapshot
1.10.3. Operating business segments
1.10.4. Product portfolio
1.10.5. Business performance
1.10.6. Key strategic moves and developments

LIST OF TABLES

TABLE 01. GLOBAL SILICON FERTILIZER MARKET, BY TYPE, 2016-2025 ($MILLION)
TABLE 02. CALCIUM SILICATE FERTILIZER MARKET, BY REGION, 2016-2025 ($MILLION)
TABLE 03. POTASSIUM SILICATE FERTILIZER MARKET, BY REGION, 2016-2025 ($MILLION)
TABLE 04. SODIUM SILICATE FERTILIZER MARKET, BY REGION, 2016-2025 ($MILLION)
TABLE 05. GLOBAL SILICON FERTILIZER MARKET, BY FORM, 2017-2025 ($MILLION)
TABLE 06. LIQUID SILICON FERTILIZER MARKET, BY REGION, 2017-2025 ($MILLION)
TABLE 07. SOLID SILICON FERTILIZER MARKET, BY REGION, 2017-2025 ($MILLION)
TABLE 08. GLOBAL SILICON FERTILIZER MARKET, BY APPLICATION, 2016-2025 ($MILLION)
TABLE 09. SILICON FERTILIZER MARKET FOR FIELD CROPS, BY REGION, 2016-2025 ($MILLION)
TABLE 10. SILICON FERTILIZER MARKET FOR HORTICULTURAL CROPS, BY REGION, 2016-2025 ($MILLION)
TABLE 11. SILICON FERTILIZER MARKET FOR HYDROPONICS, BY REGION, 2016-2025 ($MILLION)
TABLE 12. SILICON FERTILIZER MARKET FOR FLORICULTURE, BY REGION, 2016-2025 ($MILLION)
TABLE 13. GLOBAL SILICON FERTILIZER MARKET, BY REGION, 2016-2025 ($MILLION)
TABLE 14. NORTH AMERICA SILICON FERTILIZER MARKET, BY TYPE, 2016-2025 ($MILLION)
TABLE 15. NORTH AMERICA SILICON FERTILIZER MARKET, BY FORM, 2016-2025 ($MILLION)
TABLE 16. NORTH AMERICA SILICON FERTILIZER MARKET, BY APPLICATION, 2016-2025 ($MILLION)
TABLE 17. NORTH AMERICA SILICON FERTILIZER MARKET, BY COUNTRY, 2016-2025 ($MILLION)
TABLE 18. US SILICON FERTILIZER MARKET, BY TYPE, 2016-2025 ($MILLION)
TABLE 19. US SILICON FERTILIZER MARKET, BY FORM, 2016-2025 ($MILLION)
TABLE 20. US SILICON FERTILIZER MARKET, BY APPLICATION, 2016-2025 ($MILLION)
TABLE 21. CANADA SILICON FERTILIZER MARKET, BY TYPE, 2016-2025 ($MILLION)
TABLE 22. CANADA SILICON FERTILIZER MARKET, BY FORM, 2016-2025 ($MILLION)
TABLE 23. CANADA SILICON FERTILIZER MARKET, BY APPLICATION, 2016-2025 ($MILLION)
TABLE 24. MEXICO SILICON FERTILIZER MARKET, BY TYPE, 2016-2025 ($MILLION)
TABLE 25. MEXICO SILICON FERTILIZER MARKET, BY FORM, 2016-2025 ($MILLION)
TABLE 26. MEXICO SILICON FERTILIZER MARKET, BY APPLICATION, 2016-2025 ($MILLION)
TABLE 27. EUROPE AMERICA SILICON FERTILIZER MARKET, BY TYPE, 2016-2025 ($MILLION)
TABLE 28. EUROPE AMERICA SILICON FERTILIZER MARKET, BY FORM, 2016-2025 ($MILLION)
TABLE 29. EUROPE AMERICA SILICON FERTILIZER MARKET, BY APPLICATION, 2016-2025 ($MILLION)
TABLE 30. EUROPE SILICON FERTILIZER MARKET, BY COUNTRY, 2016-2025 ($MILLION)
TABLE 31. GERMANY SILICON FERTILIZER MARKET, BY TYPE, 2016-2025 ($MILLION)
TABLE 32. GERMANY SILICON FERTILIZER MARKET, BY FORM, 2016-2025 ($MILLION)
TABLE 33. GERMANY SILICON FERTILIZER MARKET, BY APPLICATION, 2016-2025 ($MILLION)
TABLE 34. SPAIN SILICON FERTILIZER MARKET, BY TYPE, 2016-2025 ($MILLION)
TABLE 35. SPAIN SILICON FERTILIZER MARKET, BY FORM, 2016-2025 ($MILLION)
TABLE 36. SPAIN SILICON FERTILIZER MARKET, BY APPLICATION, 2016-2025 ($MILLION)
TABLE 37. UK SILICON FERTILIZER MARKET, BY TYPE, 2016-2025 ($MILLION)
TABLE 38. UK SILICON FERTILIZER MARKET, BY FORM, 2016-2025 ($MILLION)
TABLE 39. UK SILICON FERTILIZER MARKET, BY APPLICATION, 2016-2025 ($MILLION)
TABLE 40. ITALY SILICON FERTILIZER MARKET, BY TYPE, 2016-2025 ($MILLION)
TABLE 41. ITALY SILICON FERTILIZER MARKET, BY FORM, 2016-2025 ($MILLION)
TABLE 42. ITALY SILICON FERTILIZER MARKET, BY APPLICATION, 2016-2025 ($MILLION)
TABLE 43. FRANCE SILICON FERTILIZER MARKET, BY TYPE, 2016-2025 ($MILLION)
TABLE 44. FRANCE SILICON FERTILIZER MARKET, BY FORM, 2016-2025 ($MILLION)
TABLE 45. FRANCE SILICON FERTILIZER MARKET, BY APPLICATION, 2016-2025 ($MILLION)
TABLE 46. REST OF EUROPE SILICON FERTILIZER MARKET, BY TYPE, 2016-2025 ($MILLION)
TABLE 47. REST OF EUROPE SILICON FERTILIZER MARKET, BY FORM, 2016-2025 ($MILLION)
TABLE 48. REST OF EUROPE SILICON FERTILIZER MARKET, BY APPLICATION, 2016-2025 ($MILLION)
TABLE 49. ASIA-PACIFIC SILICON FERTILIZER MARKET, BY TYPE, 2016-2025 ($MILLION)
TABLE 50. ASIA-PACIFIC SILICON FERTILIZER MARKET, BY FORM, 2016-2025 ($MILLION)
TABLE 51. ASIA-PACIFIC SILICON FERTILIZER MARKET, BY APPLICATION, 2016-2025 ($MILLION)
TABLE 52. ASIA-PACIFIC SILICON FERTILIZER MARKET, BY COUNTRY, 2016-2025 ($MILLION)
TABLE 53. CHINA SILICON FERTILIZER MARKET, BY TYPE, 2016-2025 ($MILLION)
TABLE 54. CHINA SILICON FERTILIZER MARKET, BY FORM, 2016-2025 ($MILLION)
TABLE 55. CHINA SILICON FERTILIZER MARKET, BY APPLICATION, 2016-2025 ($MILLION)
TABLE 56. INDIA SILICON FERTILIZER MARKET, BY TYPE, 2016-2025 ($MILLION)
TABLE 57. INDIA SILICON FERTILIZER MARKET, BY FORM, 2016-2025 ($MILLION)
TABLE 58. INDIA SILICON FERTILIZER MARKET, BY APPLICATION, 2016-2025 ($MILLION)
TABLE 59. JAPAN SILICON FERTILIZER MARKET, BY TYPE, 2016-2025 ($MILLION)
TABLE 60. JAPAN SILICON FERTILIZER MARKET, BY FORM, 2016-2025 ($MILLION)
TABLE 61. JAPAN SILICON FERTILIZER MARKET, BY APPLICATION, 2016-2025 ($MILLION)
TABLE 62. AUSTRALIA SILICON FERTILIZER MARKET, BY TYPE, 2016-2025 ($MILLION)
TABLE 63. AUSTRALIA SILICON FERTILIZER MARKET, BY FORM, 2016-2025 ($MILLION)
TABLE 64. AUSTRALIA SILICON FERTILIZER MARKET, BY APPLICATION, 2016-2025 ($MILLION)
TABLE 65. SOUTH KOREA SILICON FERTILIZER MARKET, BY TYPE, 2016-2025 ($MILLION)
TABLE 66. SOUTH KOREA SILICON FERTILIZER MARKET, BY FORM, 2016-2025 ($MILLION)
TABLE 67. SOUTH KOREA SILICON FERTILIZER MARKET, BY APPLICATION, 2016-2025 ($MILLION)
TABLE 68. REST OF ASIA-PACIFIC SILICON FERTILIZER MARKET, BY TYPE, 2016-2025 ($MILLION)
TABLE 69. REST OF ASIA-PACIFIC SILICON FERTILIZER MARKET, BY FORM, 2016-2025 ($MILLION)
TABLE 70. REST OF ASIA-PACIFIC SILICON FERTILIZER MARKET, BY APPLICATION, 2016-2025 ($MILLION)
TABLE 71. LAMEA SILICON FERTILIZER MARKET, BY TYPE, 2016-2025 ($MILLION)
TABLE 72. LAMEA SILICON FERTILIZER MARKET, BY FORM, 2016-2025 ($MILLION)
TABLE 73. LAMEA SILICON FERTILIZER MARKET, BY APPLICATION, 2016-2025 ($MILLION)
TABLE 74. LAMEA SILICON FERTILIZER MARKET, BY COUNTRY, 2016-2025 ($MILLION)
TABLE 75. BRAZIL SILICON FERTILIZER MARKET, BY TYPE, 2016-2025 ($MILLION)
TABLE 76. BRAZIL SILICON FERTILIZER MARKET, BY FORM, 2016-2025 ($MILLION)
TABLE 77. BRAZIL SILICON FERTILIZER MARKET, BY APPLICATION, 2016-2025 ($MILLION)
TABLE 78. ARGENTINA SILICON FERTILIZER MARKET, BY TYPE, 2016-2025 ($MILLION)
TABLE 79. ARGENTINA SILICON FERTILIZER MARKET, BY FORM, 2016-2025 ($MILLION)
TABLE 80. ARGENTINA SILICON FERTILIZER MARKET, BY APPLICATION, 2016-2025 ($MILLION)
TABLE 81. SOUTH AFRICA SILICON FERTILIZER MARKET, BY TYPE, 2016-2025 ($MILLION)
TABLE 82. SOUTH AFRICA SILICON FERTILIZER MARKET, BY FORM, 2016-2025 ($MILLION)
TABLE 83. SOUTH AFRICA SILICON FERTILIZER MARKET, BY APPLICATION, 2016-2025 ($MILLION)
TABLE 84. TURKEY SILICON FERTILIZER MARKET, BY TYPE, 2016-2025 ($MILLION)
TABLE 85. TURKEY SILICON FERTILIZER MARKET, BY FORM, 2016-2025 ($MILLION)
TABLE 86. TURKEY SILICON FERTILIZER MARKET, BY APPLICATION, 2016-2025 ($MILLION)
TABLE 87. REST OF LAMEA SILICON FERTILIZER MARKET, BY TYPE, 2016-2025 ($MILLION)
TABLE 88. REST OF LAMEA SILICON FERTILIZER MARKET, BY FORM, 2016-2025 ($MILLION)
TABLE 89. REST OF LAMEA SILICON FERTILIZER MARKET, BY APPLICATION, 2016-2025 ($MILLION)
TABLE 90. PLANT TUFF INC.: COMPANY SNAPSHOT
TABLE 91. PLANT TUFF INC.: PRODUCT PORTFOLIO
TABLE 92. AGRIPOWER: COMPANY SNAPSHOT
TABLE 93. AGRIPOWER: PRODUCT PORTFOLIO
TABLE 94. AGRIPOWER: KEY STRATEGIC MOVES AND DEVELOPMENTS
TABLE 95. MAXSIL: COMPANY SNAPSHOT
TABLE 96. MAXSIL: PRODUCT PORTFOLIO
TABLE 97. DENKA CO. LTD.: COMPANY SNAPSHOT
TABLE 98. DENKA CO. LTD.: OPERATING SEGMENTS
TABLE 99. DENKA CO. LTD.: PRODUCT PORTFOLIO
TABLE 100. REDOX PTY LTD.: COMPANY SNAPSHOT
TABLE 101. REDOX PTY LTD.: PRODUCT PORTFOLIO
TABLE 102. REDOX PTY LTD.: KEY STRATEGIC MOVES AND DEVELOPMENTS
TABLE 103. ARIES AGRO LIMITED: COMPANY SNAPSHOT
TABLE 104. ARIES AGRO LIMITED: OPERATING SEGMENTS
TABLE 105. ARIES AGRO LIMITED: PRODUCT PORTFOLIO
TABLE 106. BASF SE: COMPANY SNAPSHOT
TABLE 107. BASF SE: PRODUCT SEGMENTS
TABLE 108. BASF SE: PRODUCT PORTFOLIO
TABLE 109. COMPASS MINERALS INTERNATIONAL, INC.: COMPANY SNAPSHOT
TABLE 110. COMPASS MINERALS INTERNATIONAL, INC.: PRODUCT SEGMENTS
TABLE 111. COMPASS MINERALS INTERNATIONAL, INC.: PRODUCT PORTFOLIO
TABLE 112. THE MOSAIC COMPANY: COMPANY SNAPSHOT
TABLE 113. THE MOSAIC COMPANY: PRODUCT PORTFOLIO
TABLE 114. YARA INTERNATIONAL ASA: COMPANY SNAPSHOT
TABLE 115. YARA INTERNATIONAL ASA: PRODUCT PORTFOLIO


LIST OF FIGURES

FIGURE 01. KEY MARKET SEGMENTS
FIGURE 02. TOP INVESTMENT POCKET
FIGURE 03. TOP IMPACTING FACTORS
FIGURE 04. MODERATE BARGAINING POWER OF SUPPLIERS
FIGURE 05. MODERATE-HIGH BARGAINING POWER OF BUYERS
FIGURE 06. HIGH THREAT OF SUBSTITUTION
FIGURE 07. LOW-MODERATE THREAT OF NEW ENTRANTS
FIGURE 08. MODERATE INTENSITY OF COMPETITIVE RIVALRY
FIGURE 09. COMPARATIVE SHARE ANALYSIS OF CALCIUM SILICATE FERTILIZER MARKET ($MILLIONS), BY COUNTRY, 2016 & 2025 (%)
FIGURE 10. COMPARATIVE SHARE ANALYSIS OF POTASSIUM SILICATE FERTILIZER MARKET ($MILLIONS), BY COUNTRY, 2017 & 2025 (%)
FIGURE 11. COMPARATIVE SHARE ANALYSIS OF SODIUM SILICATE FERTILIZER MARKET ($MILLIONS), BY COUNTRY, 2017 & 2025 (%)
FIGURE 12. COMPARATIVE SHARE ANALYSIS OF LIQUID SILICON FERTILIZER MARKET ($MILLION), BY COUNTRY, 2017 & 2025 (%)
FIGURE 13. COMPARATIVE SHARE ANALYSIS OF SOLID SILICON FERTILIZER MARKET ($MILLIONS), BY COUNTRY, 2017 & 2025 (%)
FIGURE 14. COMPARATIVE SHARE ANALYSIS SILICON FERTILIZER MARKET FOR FIELD CROPS ($MILLIONS), BY COUNTRY, 2016 & 2025 (%)
FIGURE 15. COMPARATIVE SHARE ANALYSIS OF SILICON FERTILIZER MARKET FOR HORTICULTURAL CROPS ($MILLIONS), BY COUNTRY, 2016 & 2025 (%)
FIGURE 16. COMPARATIVE SHARE ANALYSIS OF SILICON FERTILIZER MARKET FOR HYDROPONICS ($MILLIONS), BY COUNTRY, 2016 & 2025 (%)
FIGURE 17. COMPARATIVE SHARE ANALYSIS SILICON FERTILIZER MARKET FOR FLORICULTURE ($MILLIONS), BY COUNTRY, 2016 & 2025 (%)
FIGURE 18. U.S. SILICON FERTILIZER MARKET, 2016-2025 ($MILLION)
FIGURE 19. CANADA SILICON FERTILIZER MARKET, 2016-2025 ($MILLION)
FIGURE 20. MEXICO SILICON FERTILIZER MARKET, 2016-2025 ($MILLION)
FIGURE 21. GERMANY SILICON FERTILIZER MARKET, 2016-2025 ($MILLION)
FIGURE 22. SPAIN SILICON FERTILIZER MARKET, 2016-2025 ($MILLION)
FIGURE 23. UK SILICON FERTILIZER MARKET, 2016-2025 ($MILLION)
FIGURE 24. ITALY SILICON FERTILIZER MARKET, 2016-2025 ($MILLION)
FIGURE 25. FRANCE SILICON FERTILIZER MARKET, 2016-2025 ($MILLION)
FIGURE 26. REST OF EUROPE SILICON FERTILIZER MARKET, 2016-2025 ($MILLION)
FIGURE 27. CHINA SILICON FERTILIZER MARKET, 2016-2025 ($MILLION)
FIGURE 28. INDIA SILICON FERTILIZER MARKET, 2016-2025 ($MILLION)
FIGURE 29. JAPAN SILICON FERTILIZER MARKET, 2016-2025 ($MILLION)
FIGURE 30. AUSTRALIA SILICON FERTILIZER MARKET, 2016-2025 ($MILLION)
FIGURE 31. SOUTH KOREA SILICON FERTILIZER MARKET, 2016-2025 ($MILLION)
FIGURE 32. REST OF ASIA-PACIFIC SILICON FERTILIZER MARKET, 2016-2025 ($MILLION)
FIGURE 33. BRAZIL SILICON FERTILIZER MARKET, 2016-2025 ($MILLION)
FIGURE 34. ARGENTINA SILICON FERTILIZER MARKET, 2016-2025 ($MILLION)
FIGURE 35. SOUTH AFRICA SILICON FERTILIZER MARKET, 2016-2025 ($MILLION)
FIGURE 36. TURKEY SILICON FERTILIZER MARKET, 2016-2025 ($MILLION)
FIGURE 37. REST OF LAMEA SILICON FERTILIZER MARKET, 2016-2025 ($MILLION)
FIGURE 38. DENKA CO. LTD.: REVENUE, 2015-2017 ($MILLION)
FIGURE 39. DENKA CO. LTD.: REVENUE SHARE BY SEGMENT, 2017 (%)
FIGURE 40. REDOX PTY LTD.: REVENUE, 2016-2017 ($MILLION)
FIGURE 41. ARIES AGRO LIMITED: NET SALES, 2015-2017 ($MILLION)
FIGURE 42. BASF SE: NET SALES, 2015-2017 ($MILLION)
FIGURE 43. BASF SE: REVENUE SHARE BY PRODUCT, 2017 (%)
FIGURE 44. BASF SE: REVENUE SHARE BY GEOGRAPHY, 2017 (%)
FIGURE 45. COMPASS MINERALS INTERNATIONAL, INC.: NET SALES, 2015-2017 ($MILLION)
FIGURE 46. COMPASS MINERALS INTERNATIONAL, INC.: REVENUE SHARE BY SEGMENT, 2017 (%)
FIGURE 47. COMPASS MINERALS INTERNATIONAL, INC.: REVENUE SHARE BY GEOGRAPHY, 2017 (%)
FIGURE 48. THE MOSAIC COMPANY: NET SALES, 2015-2017 ($MILLION)
FIGURE 49. THE MOSAIC COMPANY: REVENUE SHARE BY SEGMENT, 2017 (%)
FIGURE 50. THE MOSAIC COMPANY: REVENUE SHARE BY GEOGRAPHY, 2017 (%)
FIGURE 51. YARA INTERNATIONAL ASA: NET SALES, 2015-2017 ($MILLION)
FIGURE 52. YARA INTERNATIONAL ASA: REVENUE SHARE BY PRODUCT, 2017 (%)
FIGURE 53. YARA INTERNATIONBAL ASA: REVENUE SHARE BY GEOGRAPHY, 2017 (%)


Silicon fertilizers are increasingly deployed in agricultural production to enhance the nutrient level in soil and promote growth of crops. Increase in the global population along with rapid urbanization has consistently fueled the demand for nutritious & protein-rich food. Therefore, to produce high quality and uniform crop yield as well as cater to the increase in global demands, food growers are focusing on the use of effective & efficient micronutrients fertilizers, which indirectly supports the growth of the silicon fertilizers market. In addition, growth of the agriculture industry and expansion of planted areas across the globe have resulted in an increase in demand for silicon fertilizers, and thus, fueling the growth of the global silicon fertilizer market.

Silicon fertilizers have gained popularity among farmers in the recent years owing to increase in awareness regarding the benefits of these fertilizers, rise in farm expenditure, ease of application, and effectiveness for crop yield & productivity. In addition, growing popularity of hydroponic system field areas and easy availability of fertilizers at low and subsidized rates encourage farmers to use them effectively.

The Asia-Pacific silicon fertilizers market offers lucrative opportunities for market players owing to the growth of the agriculture industry. This helps cater to the substantial rise in the global demand for food. In addition, the field crop segment is expected to exhibit high potential due to continuous technological advancements and increased demands. Furthermore, investment initiatives by government and private manufacturers fuel the activities pertaining to new product developments, which in turn boosts the market growth.

PURCHASE OPTIONS

Call or Email us

U.S.-Canada Toll-free: +1-800-792-5285
Int'l : +1-503-894-6022
Europe : +44-845-528-1300
Email : help@alliedmarketresearch.com

Looking for Customization?

 Customization Request

Have a Question?

 Speak with Analyst

Any Confusion?

 Inquire Before Buying

Have a glance of the Report

  Request Sample

Purchase Full Report of
Silicon Fertilizer Market

Start reading instantly.
This Report and over 67,112+ more Reports, Available with Avenue Library. T&C*.

  • Online Only
  • $3,456
  • Online cloud access only
  • Restricted print, copy, paste & download
  • Read only
  • Free industry update
    (Within 180 days)
  • Free report update in next update cycle
    (Sep 2019 - Sep 2020)
  • Data Pack
  • $3,840
  • Restricted to one authorized user
  • One print only
  • Available in
    Excel
  • Free industry update
    (Within 180 days)
  •   Free report update in next update cycle
    (Sep 2019 - Sep 2020)
  • Single User
  • $5,769
  • Restricted to one authorized user
  • One print only
  • Available in
    PDF
  • Free industry update
    (Within 180 days)
  •   Free report update in next update cycle
    (Sep 2019 - Sep 2020)
  • Five Users
  • $6,450
  • Limited to five authorized users
  • Print upto five copies
  • Available in
    PDF
  • Free industry update
    (Within 180 days)
  •   Free report update in next update cycle
    (Sep 2019 - Sep 2020)
  • Enterprise
    License/PDF

  • $10,995
  • Unlimited
    within
    company/enterprise
  • Available in Excel & PDF
  • Free industry update
    (Within 180 days)
  •   Free report update in next update cycle
    (Sep 2019 - Sep 2020)
  • Library
    Membership

  • $999 $ 1,175
    Per User/ Per month/ Billed annually
  • Published Content
    E-access
  • Company Profiles
    E-access
  • Newly Added Content Access
  • 10 PDF
    Downloads
  • 5 Excel Data
    Pack Downloads
  • 250 Company Profiles PDF Downloads
  • Buy Now

*Taxes/Fees, if applicable will be added during checkout. All prices in USD

RELATED REPORTS
 

Why Allied Market Research?


Infallible Methodology

To ensure high-level data integrity, accurate analysis, and impeccable forecasts

Analyst Support

For complete satisfaction

Customization

On-demand customization of scope of the report to exactly meet your needs

TARGETED MARKET VIEW

Targeted market view to provide pertinent information and save time of readers

Get fresh content delivered

Get insights on topics that are crucial for your business. Stay abreast of your interest areas.

Get Industry Data Alerts

Why Allied Market Research?

Infallible Methodology

To ensure high-level data integrity, accurate analysis, and impeccable forecasts

Analyst Support

For complete satisfaction

Customization

On-demand customization of scope of the report to exactly meet your needs

TARGETED MARKET VIEW

Targeted market view to provide pertinent information and save time of readers