
Silver Nanoparticles Market Research, 2034
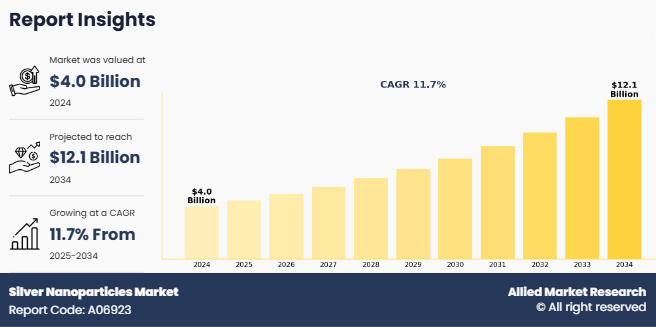
The global silver nanoparticles market size was valued at $4 billion in 2024, and is projected to reach $12.1 billion by 2034, growing at a CAGR of 11.7% from 2025 to 2034.
Introduction
Silver nanoparticles (AgNPs) are nanoscale particles of silver that typically range in size from 1 to 100 nanometers. Due to their small size and large surface area-to-volume ratio, they exhibit unique physical, chemical, and biological properties that are significantly different from bulk silver. These properties include high electrical conductivity, potent antimicrobial activity, and strong optical behavior, especially in terms of plasmon resonance. The development of silver nanoparticles industry has opened new avenues in materials science, medicine, electronics, and environmental technology. One of the most prominent applications of silver nanoparticles is in the field of medicine. Due to their strong antimicrobial properties, AgNPs are widely used to combat bacterial, viral, and fungal infections. They are particularly effective against a broad spectrum of Gram-positive and Gram-negative bacteria, including antibiotic-resistant strains such as Staphylococcus aureus (MRSA). This makes them ideal candidates for wound care, coatings on medical devices, and infection control.
The textile industry is a major area where silver nanoparticles are extensively used. Clothing, sportswear, socks, undergarments, and hospital garments, often incorporates AgNPs to provide antimicrobial properties. These particles help prevent the growth of odor-causing bacteria and extend the freshness of the fabric. Textiles treated with silver nanoparticles retain their antimicrobial properties even after multiple washes.
Key Takeaways
The silver nanoparticles market study covers 20 countries. The research includes a segment analysis of each country in terms of value for the projected period.
The study integrated high-quality data, professional opinions and analysis, and critical independent perspectives. The research approach is intended to provide a balanced view of global silver nanoparticles markets and to assist stakeholders in making educated decisions in order to achieve their most ambitious growth objectives.
Over 3,700 product literature, annual reports, industry statements, and other comparable materials from major industry participants were reviewed to gain a better understanding of the silver nanoparticles industry.
The key players in the silver nanoparticles market share are Advanced Nano Products Co., Ltd, American Elements Corporation, Ames Goldsmith Corporation, Cerion, LLC, Aritech Chemazone Pvt. Ltd., Meliorum Technologies, Inc., M K Impex Corp., NanoComposix, Inc., Nanocs, Inc., NANOGAP SUB-NM-POWDER, S.A, Nanografi co, inc, NanoPure, Nanoshel LLC, NovaCentrix, Pen Inc., Prime Nanotechnology Co., Ltd., Strem Chemicals, Inc, Platonic Nanotech, Thermo Fisher Scientific Inc. They have adopted strategies such as acquisition, product launch, merger, and expansion to gain an edge in the market.
Market Dynamics
Rising demand for silver nanoparticles in electronics and consumer products is expected to drive silver nanoparticles market growth. Silver nanoparticles (AgNPs) play a vital role in electronics and consumer products due to their excellent electrical, thermal, and antimicrobial properties. In electronics, AgNPs are used in PCBs, conductive inks, sensors, and chip manufacturing, enabling high performance, miniaturization, and energy efficiency. As demand grows for compact, efficient devices, their adoption is accelerating. In April 2025, Apple expanded iPhone production in India through a new Tata Electronics facility in Tamil Nadu and a $2.6 billion Foxconn plant in Karnataka, set to produce iPhone 16 models and generate 50,000 jobs. India now contributes 18% to global iPhone output. In consumer products, AgNPs are widely used in antibacterial textiles like sportswear and medical garments, effectively reducing bacterial growth and odor.
However, toxicity concerns for silver nanoparticles is expected to restrain the growth of the silver nanoparticles market. Silver nanoparticles (AgNPs) exhibit size-, concentration-, and time-dependent toxicity. Smaller particles (10–15 nm) are more harmful, causing mitochondrial dysfunction and reducing immune cell activity. Even low concentrations (6.25–11 µg/mL) can trigger cytotoxic effects in kidney, colon, and lung cells by generating reactive oxygen species (ROS), leading to DNA damage, apoptosis, and necrosis. In animal models, prolonged exposure results in brain accumulation and neuronal damage. Organ-specific effects include liver necrosis, kidney inflammation, and impaired hepatocyte function. Notably, AgNPs promote or inhibit cell proliferation depending on the dose. Reproductive toxicity occurs at just 0.5 µg/mL, especially in germ and neural cells.
Segments Overview
The silver nanoparticles market is segmented into synthesis method, shape, application, and region. On the basis of type, the market is divided into wet chemistry, ion implantation, and biological synthesis method (plant based, and others). On the basis of shape, the silver nanoparticles market is categorized into spheres, platelets, rods, colloidal silver particles, and others. On the basis of application, the silver nanoparticles market is divided into healthcare and life science, textile, electronics and IT, food and beverages, pharmaceuticals, cosmetics (soap and others), water treatment, and others. Based on region the market is divided into North America, Europe, Asia-Pacific, and Latin America, Middle East and Africa.

On the basis of synthesis method, the wet chemistry segment dominated the market in 2024 accounting for more than half of the market share. Silver nanoparticles are extensively utilized in wet chemical synthesis as nucleating agents and stabilizers. Their presence can influence the growth and morphology of other nanomaterials during synthesis, enabling control over particle size and shape. This is critical for producing nanostructures with specific optical or electronic properties. In biochemical applications, AgNPs synthesized via wet chemistry methods are often employed in sensors and diagnostic assays due to their strong surface plasmon resonance effects, which enhance signal detection and sensitivity.

On the basis of shapes, the spheres segment dominated the market in 2024, representing the CAGR of 12.0% during the forecast period. Silver nanoparticles (AgNPs) have gained significant attention in the form of spheres due to their unique physical and chemical properties, which make them highly effective in a variety of applications. The spherical shape provides a high surface area-to-volume ratio, enhancing their interaction with biological systems, chemicals, and light. In January 2022, researchers introduced an automated polyol synthesis method for AgNPs, enabling the production of nanoparticles with mean radii of 3 and 5 nm. This approach offers reproducibility and tunability, addressing challenges like high polydispersity and lack of size control in traditional synthesis methods.

On the basis of application, the electronics and IT segment dominated the market in 2024, representing the CAGR of 11.6% during the forecast period. Silver nanoparticles (AgNPs) have become increasingly significant in the fields of electronics and information technology due to their exceptional electrical, thermal, and antimicrobial properties. In electronics, silver nanoparticles are widely used to enhance the conductivity of various components. Because silver is one of the best conductors of electricity, incorporating silver nanoparticles into conductive inks and pastes enables the production of flexible, lightweight, and highly efficient electronic circuits. These nanoparticles are crucial in printed electronics, including flexible displays, RFID tags, and wearable devices, where traditional bulky wiring is replaced by fine conductive patterns that maintain excellent performance while allowing for bending and stretching. .In October 2022, CHIPS and Science Act (2022) legislation allocated approximately $280 billion to bolster semiconductor research and manufacturing. It includes $13 billion for semiconductor R&D and $39 billion in subsidies for domestic chip manufacturing, indirectly supporting the development of advanced materials like silver nanoparticles in electronics.

On the basis of region, North America dominated the nano fertilizers market in 2024, accounting for more than one third of the market share. Silver nanoparticles (AgNPs) have seen significant growth in usage across North American countries due to their unique antimicrobial, optical, and conductive properties. In the U.S. and Canada, silver nanoparticles are extensively utilized in various industries, including healthcare, electronics, textiles, and environmental applications. Their potent antimicrobial effect has made them highly popular in medical devices, wound dressings, and coatings for hospital surfaces, helping to reduce infections and improve patient outcomes. The healthcare sector in North America continues to drive innovation in silver nanoparticle-based products, supported by strong research and regulatory frameworks that ensure safety and efficacy.
Competitive Analysis
The major prominent players operating in the silver nanoparticles market include Advanced Nano Products Co., Ltd, American Elements Corporation, Ames Goldsmith Corporation, Cerion, LLC, Aritech Chemazone Pvt. Ltd., Meliorum Technologies, Inc., M K Impex Corp., NanoComposix, Inc., Nanocs, Inc., NANOGAP SUB-NM-POWDER, S.A, Nanografi co, inc, NanoPure, Nanoshel LLC, NovaCentrix, Pen Inc., Prime Nanotechnology Co., Ltd., Strem Chemicals, Inc, Platonic Nanotech, Thermo Fisher Scientific Inc.
Recent Key Developments of Silver Nanoparticles Market
- In January 2025, researchers at Delhi Technological University developed silver nanoparticles from ginger extract, achieving 99% degradation of textile dye, offering an efficient environmental remedy.
- In April 2024, The U.S. Department of Agriculture’s Agriculture Research Services (ARS) announced that ARS published a study which reveals the ability of cotton gin waste to generate silver nanoparticles in the presence of silver ions.
- In January 2023, scientists at the University of Florida discovered that combining silver nanoparticles with antibiotics was effective against antibiotic-resistant bacteria, highlighting AgNPs' potential in combating superbugs.
Key Benefits For Stakeholders
- This report provides a quantitative analysis of the market segments, current trends, estimations, and dynamics of the silver nanoparticles market analysis from 2024 to 2034 to identify the prevailing silver nanoparticles market opportunities.
- The market research is offered along with information related to key drivers, restraints, and opportunities.
- Porter's five forces analysis highlights the potency of buyers and suppliers to enable stakeholders make profit-oriented business decisions and strengthen their supplier-buyer network.
- In-depth analysis of the silver nanoparticles market segmentation assists to determine the prevailing market opportunities.
- Major countries in each region are mapped according to their revenue contribution to the global market.
- Market player positioning facilitates benchmarking and provides a clear understanding of the present position of the market players.
- The report includes the analysis of the regional as well as global silver nanoparticles market trends, key players, market segments, application areas, and market growth strategies.
Silver Nanoparticles Market Report Highlights
| Aspects | Details |
| Market Size By 2034 | USD 12.1 billion |
| Growth Rate | CAGR of 11.7% |
| Forecast period | 2024 - 2034 |
| Report Pages | 732 |
| By Shape |
|
| By Synthesis Method |
|
| By Application |
|
| By Region |
|
| Key Market Players | Cerion LLC, Platonic Nanotech, Nanografi co,inc, American Elements Corporation, Pen Inc, Prime Nanotechnology Co., Ltd., Aritech Chemazone Pvt. Ltd., Ames Goldsmith Corporation, Nanopure, Meliorum Technologies, Inc, Nanocs Inc, Advanced Nano Products Co Ltd, Nanoshel LLC., Thermo Fisher Scientific, Inc, NovaCentrix, Strem Chemicals, Inc., M K Impex Corp., Techinstro, NANOGAP SUB-NM-POWDER, S.A., NanoComposix Inc |
Analyst Review
According to the opinions of various CXOs of leading companies, an increase in demand for silver nanoparticles in healthcare drives the growth of silver nanoparticles market. In drug delivery, silver nanoparticles are being explored as carriers for the targeted and controlled release of therapeutic agents. Due to their small size and large surface area, silver nanoparticles can easily encapsulate drugs and facilitate their transport to specific sites within the body. This targeted delivery improves the effectiveness of treatments by ensuring that the drug reaches the desired location, while minimizing the exposure of healthy tissues to potentially harmful chemicals. Moreover, silver nanoparticles can be functionalized with targeting ligands, enabling them to recognize and bind to specific cells, such as cancer cells, further enhancing their therapeutic potential in treatments like cancer therapy. In 2022, Schott Pharma was established as a separate entity from Schott AG, focusing on pharmaceutical drug containment and delivery systems. The company went public on the Frankfurt Stock Exchange in 2023, reflecting its growing presence in the pharmaceutical industry.
However, regulatory challenges for silver nanoparticles is expected to hamper the growth of market. The regulatory environment around silver nanoparticles is fragmented, with different countries and regions adopting varying approaches to their assessment and regulation. While some nations have established guidelines for the use of nanomaterials, including silver nanoparticles, these regulations are often inconsistent, and the criteria for testing and approval can vary widely. For instance, while the European Union has begun to formulate regulations for nanomaterials under the REACH (Registration, Evaluation, Authorization, and Restriction of Chemicals) framework, other regions like the United States and parts of Asia have less stringent or slower-moving regulatory processes. This lack of harmonization complicates the global commercialization of silver nanoparticle-based products, as manufacturers must navigate diverse requirements and undergo multiple regulatory processes depending on the market.
The key players operating in the silver nanoparticles market include Advanced Nano Products Co., Ltd, American Elements Corporation, Ames Goldsmith Corporation, Cerion, LLC, Aritech Chemazone Pvt. Ltd., Meliorum Technologies, Inc., M K Impex Corp., NanoComposix, Inc., Nanocs, Inc., NANOGAP SUB-NM-POWDER, S.A, Nanografi co, inc, NanoPure, Nanoshel LLC, NovaCentrix, Pen Inc., Prime Nanotechnology Co., Ltd., Strem Chemicals, Inc, Platonic Nanotech, Thermo Fisher Scientific Inc.
The global silver nanoparticles market was valued at $4 billion in 2024, and is projected to reach $12.1 billion by 2034, growing at a CAGR of 11.7% from 2025 to 2034.
North America is the largest regional market for silver nanoparticles.
Electronics and IT are the leading application of silver nanoparticles market.
Increase in demand for silver nanoparticles in antibacterial coatings for medical devices are the upcoming trends of silver nanoparticles market.
Loading Table Of Content...
Loading Research Methodology...

