0
2018
Simulation Software Market

Simulation Software Market

by Component (Software and Services), Deployment Mode (On-premise and Cloud), and Industry Vertical (Architecture, Engineering, Construction (AEC), Aerospace & Defense, Automotive, Electrical & Electronics, Healthcare, and Others): Global Opportunity Analysis and Industry Forecast, 2018 - 2025

Report Code: A03034
Nov 2018 | Pages: 221
Tables: 95
Charts: 59
  • Formats*:

  • pdf

    Single User License, Five User
    License & Enterprise User License

  • xls

    Data Pack Excel License

  • ppt

    It comes with the additional cost
    of $2500.00 contact sales.


COVID-19

Pandemic disrupted the entire world and affected many industries.

Get detailed COVID-19 impact analysis on the Simulation Software Market

Request Now !

Simulation Software Market Outlook: 2025

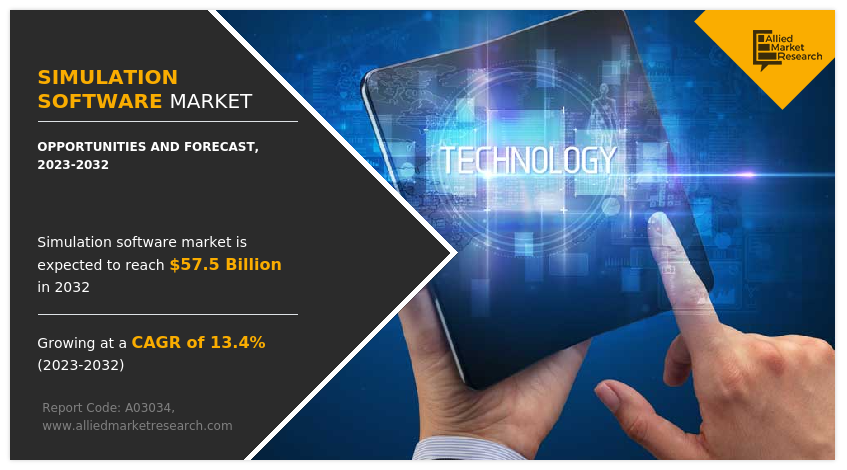
Simulation software is a program that allows companies to create a dummy process and observe an operation without actually performing it. It enables testing the same or modified system with different inputs, tracking, and analyzing responses. Simulation software is used widely to design equipment so that the final product could be close to the design specifications without being expensive in process modification. Numerous companies in aerospace & defense and automobile sectors have invested heavily in research to develop image recognition and related applications. The global simulation software market was valued at $5,135 million in 2017 and is projected to reach $10,029 million by 2025, growing at a CAGR of 8.90% from 2018 to 2025.

The electronics and electrical segment led the simulation software market share in 2017. However, the aerospace & defense segment is expected to grow at a significant pace during the forecast period due to increase in expenditure on the R&D of military equipment by developed and developing countries. In addition, the demand for simulation software is driven by the need for advanced flight simulations and training, as well as for the manufacturing process of lightweight aerospace parts.

The report focuses on the growth prospects and restraints of the simulation software market analysis based on regional trends. The study provides Porter’s five forces analysis of the simulation software industry to understand the impact of various factors such as bargaining power of suppliers, competitive intensity of competitors, threat of new entrants, threat of substitutes, and bargaining power of buyers on the growth of the market.

Segment review

The global simulation software market is segmented based on component, deployment mode, industry vertical, and region. Based on component, it is divided into software and services. Based on deployment mode, the market is bifurcated into on-premise and cloud. Based on industry vertical, it is divided into architecture, engineering, construction (AEC), aerospace & defense, automotive, electrical & electronics, healthcare, and others. Based on region, the simulation software market is analyzed across North America, Europe, Asia-Pacific, and LAMEA.

The global simulation software market is dominated by key players such as Altair Engineering, Inc.; ANSYS, Inc.; Autodesk, Inc.; Bentley Systems; Dassault Systmes; Hexagon (MSC Software Corporation); The MathWorks, Inc.; PTC, Inc.; Siemens PLM Software; and The AnyLogic Company.

Top impacting factors

The major factors that drive the growth of the global simulation software market include significant adoption of simulation among aerospace & defense, rise in demand for eco-friendly work environment, and increase in use of simulation software in automotive and healthcare industry. However, risks associated with data security is anticipated to hamper the simulation software market size during the forecast period.

Significant adoption of simulation among aerospace & defense

The aerospace & defense industry has been one of the major end users of simulation as they use modeling and simulation for numerous purposes including, training of individual soldiers, conducting joint training operations, formulating operational plans, develop doctrine and tactics, and analyzing alternative force structures. The technology fulfills critical defense needs of command, control, and communications; manpower, personnel, and training; computing and software; electronics; and manufacturing technology. These defense models and simulations vary in a broad range from components of large weapons systems through system-level to simulations of missions and battles, and so forth. Such significant applications are the major factors driving the growth of the global market in these industries.

Emerging scope of simulations to digital twins

As product development becomes increasingly complex and sophisticated, and the risks and consequences of failure keep on rising, it is anticipated that the use of simulation will continue to grow. Companies will require the ability to use multiple physics and perform complete system simulations even more. In addition, the ability to create a “digital twin” and use real-world operational data from sensors to run simulations based on live environments will expand the uses of simulation beyond engineers. Therefore, the amount of simulation use currently point out the potential for future opportunities worldwide among different industries.

The simulation-based digital twin assists companies to analyze smart machines in real-life operating environment and make informed decisions to improve performance. When incorporated in a digital twin, engineering simulation helps companies analyze and optimize the performance of products in real-world operating conditions and make assured predictions about future performance to enhance product operation and productivity, and decrease the cost and risk of unplanned downtime. Thus, increasing awareness and growing adoption of digital twins are anticipated to drive the growth of the global simulation software market.

Covid-19 Impact on the Simulation Software Market-

  • The demand for simulation software is likely to surge during Covid-19 pandemic to generate simulated based insights to limit the spread of corona virus. The simulations will be designed to imitate physical behaviors of people under specific conditions.
  • In addition, its demand is also likely to surge from ventilator manufacturers to optimize the design of the ventilators required to treat Covid-19 patients.

Key Benefits for Simulation Software Market:

  • This study provides the analytical depiction of the global simulation software market along with the current trends and future estimations to determine the imminent investment pockets.

  • The report presents information related to key drivers, restraints, and opportunities.

  • The current market is quantitatively analyzed from 2017 to 2025 to highlight the financial competency of the market.

  • Porter’s five forces analysis illustrates the potency of buyers & suppliers in the global simulation software market.

Simulation Software Market Report Highlights

Aspects Details
By Component
  • Software
  • Services
By Deployment Mode
  • On-premise
  • Cloud
By Industry Vertical
  • AEC (ARCHITECTURE, ENGINEERING, CONSTRUCTION)
  • Aerospace & Defense
  • Automotive
  • Electrical & Electronics
  • Healthcare
  • Others
By Region
  • North America  (U.S., Canada)
  • Europe  (UK, France, Germany, Rest of Europe)
  • Asia-Pacific  (China, India, Japan, Rest of Asia-Pacific)
  • LAMEA  (Latin America, Middle East, Africa)
Key Market Players SIEMENS AG (SIEMENS PLM SOFTWARE INC.), BENTLEY SYSTEMS, INCORPORATED, ALTAIR ENGINEERING, INC., THE MATHWORKS, INC., AUTODESK INC., DASSAULT SYSTÈMES, PTC, ANSYS, INC., HEXAGON MANUFACTURING INTELLIGENCE (HEXAGON AB), THE ANYLOGIC COMPANY
 

CHAPTER 1:    INTRODUCTION

1.1.    REPORT DESCRIPTION
1.2.    KEY BENEFITS FOR STAKEHOLDERS
1.3.    RESEARCH METHODOLOGY

1.3.1.    Secondary research
1.3.2.    Primary research
1.3.3.    Analyst tools & models

CHAPTER 2:    EXECUTIVE SUMMARY

2.1.    CXO PERSPECTIVE

CHAPTER 3:    MARKET OVERVIEW

3.1.    MARKET DEFINITION AND SCOPE
3.2.    KEY FINDINGS

3.2.1.    Top impacting factors
3.2.2.    Top investment pockets
3.2.3.    Top winning strategies

3.3.    PORTER'S FIVE FORCES ANALYSIS
3.4.    KEY PLAYER POSITIONING, 2017
3.5.    MARKET DYNAMICS

3.5.1.    Drivers

3.5.1.1.    Rise in demand for ecofriendly work environment
3.5.1.2.    Upsurge in use of simulation software in Automotive and Healthcare industry
3.5.1.3.    Significant adoption of simulation among aerospace and defense

3.5.2.    Restraints

3.5.2.1.    Security concerns associated with the simulation software

3.5.3.    Opportunities

3.5.3.1.    Emerging scope of simulations to digital twins
3.5.3.2.    Use of simulation software to develop IoT supporting devices

CHAPTER 4:    SIMULATION SOFTWARE MARKET, BY COMPONENTS

4.1.    OVERVIEW
4.2.    SOFTWARE

4.2.1.    Key market trends
4.2.2.    Key growth factors and opportunities
4.2.3.    Market size and forecast, by region
4.2.4.    Market analysis by country

4.3.    SERVICES

4.3.1.    Key market trends
4.3.2.    Key growth factors and opportunities
4.3.3.    Market size and forecast, by region
4.3.4.    Market analysis by country

CHAPTER 5:    SIMULATION SOFTWARE MARKET, BY DEPLOYMENT MODE

5.1.    OVERVIEW
5.2.    ON-PREMISE

5.2.1.    Key market trends
5.2.2.    Key growth factors and opportunities
5.2.3.    Market size and forecast, by region
5.2.4.    Market analysis by country

5.3.    CLOUD

5.3.1.    Key market trends
5.3.2.    Key growth factors and opportunities
5.3.3.    Market size and forecast, by region
5.3.4.    Market analysis by country

CHAPTER 6:    SIMULATION SOFTWARE MARKET, BY INDUSTRY VERTICAL

6.1.    OVERVIEW

6.2.    AEC (ARCHITECTURE, ENGINEERING, CONSTRUCTION)

6.2.1.    Key market trends
6.2.2.    Key growth factors and opportunities
6.2.3.    Market size and forecast, by region
6.2.4.    Market analysis by country

6.3.    AEROSPACE AND DEFENSE

6.3.1.    Key market trends
6.3.2.    Key growth factors and opportunities
6.3.3.    Market size and forecast, by region
6.3.4.    Market analysis by country

6.4.    AUTOMOTIVE

6.4.1.    Key market trends
6.4.2.    Key growth factors and opportunities
6.4.3.    Market size and forecast, by region
6.4.4.    Market analysis by country

6.5.    ELECTRICAL AND ELECTRONICS

6.5.1.    Key market trends
6.5.2.    Key growth factors and opportunities
6.5.3.    Market size and forecast, by region
6.5.4.    Market analysis by country

6.6.    HEALTHCARE

6.6.1.    Key market trends
6.6.2.    Key growth factors and opportunities
6.6.3.    Market size and forecast, by region
6.6.4.    Market analysis by country

6.7.    OTHERS

6.7.1.    Key market trends
6.7.2.    Key growth factors and opportunities
6.7.3.    Market size and forecast, by region
6.7.4.    Market analysis by country

CHAPTER 7:    SIMULATION SOFTWARE MARKET, BY REGION

7.1.    OVERVIEW
7.2.    NORTH AMERICA

7.2.1.    Key market trends
7.2.2.    Key growth factors and opportunities
7.2.3.    Market size and forecast

7.2.3.1.    Market size and forecast, by component
7.2.3.2.    Market size and forecast, by deployment mode
7.2.3.3.    Market size and forecast, by industry vertical
7.2.3.4.    Market size and forecast, by country

7.2.3.5.    U.S.

7.2.3.5.1.    Market size and forecast, by component
7.2.3.5.2.    Market size and forecast, by deployment mode
7.2.3.5.3.    Market size and forecast, by industry vertical

7.2.3.6.    Canada

7.2.3.6.1.    Market size and forecast, by component
7.2.3.6.2.    Market size and forecast, by deployment mode
7.2.3.6.3.    Market size and forecast, by industry vertical

7.3.    EUROPE

7.3.1.    Key market trends
7.3.2.    Key growth factors and opportunities
7.3.3.    Market size and forecast

7.3.3.1.    Market size and forecast, by component
7.3.3.2.    Market size and forecast, by deployment mode
7.3.3.3.    Market size and forecast, by industry vertical
7.3.3.4.    Market size and forecast, by country

7.3.3.5.    UK

7.3.3.5.1.    Market size and forecast, by component
7.3.3.5.2.    Market size and forecast, by deployment mode
7.3.3.5.3.    Market size and forecast, by industry vertical

7.3.3.6.    France

7.3.3.6.1.    Market size and forecast, by component
7.3.3.6.2.    Market size and forecast, by deployment mode
7.3.3.6.3.    Market size and forecast, by industry vertical

7.3.3.7.    Germany

7.3.3.7.1.    Market size and forecast, by component
7.3.3.7.2.    Market size and forecast, by deployment mode
7.3.3.7.3.    Market size and forecast, by industry vertical

7.3.3.8.    Rest of Europe

7.3.3.8.1.    Market size and forecast, by component
7.3.3.8.2.    Market size and forecast, by deployment mode
7.3.3.8.3.    Market size and forecast, by industry vertical

7.4.    ASIA-PACIFIC

7.4.1.    Key market trends
7.4.2.    Key growth factors and opportunities
7.4.3.    Market size and forecast

7.4.3.1.    Market size and forecast, by component
7.4.3.2.    Market size and forecast, by deployment mode
7.4.3.3.    Market size and forecast, by industry vertical
7.4.3.4.    Market size and forecast, by country

7.4.3.5.    China

7.4.3.5.1.    Market size and forecast, by component
7.4.3.5.2.    Market size and forecast, by deployment mode
7.4.3.5.3.    Market size and forecast, by industry vertical

7.4.3.6.    India

7.4.3.6.1.    Market size and forecast, by component
7.4.3.6.2.    Market size and forecast, by deployment mode
7.4.3.6.3.    Market size and forecast, by industry vertical

7.4.3.7.    Japan

7.4.3.7.1.    Market size and forecast, by component
7.4.3.7.2.    Market size and forecast, by deployment mode
7.4.3.7.3.    Market size and forecast, by industry vertical

7.4.3.8.    Rest of Asia-Pacific

7.4.3.8.1.    Market size and forecast, by component
7.4.3.8.2.    Market size and forecast, by deployment mode
7.4.3.8.3.    Market size and forecast, by industry vertical

7.5.    LAMEA

7.5.1.    Key market trends
7.5.2.    Key growth factors and opportunities
7.5.3.    Market size and forecast

7.5.3.1.    Market size and forecast, by component
7.5.3.2.    Market size and forecast, by deployment mode
7.5.3.3.    Market size and forecast, by industry vertical
7.5.3.5.    Market size and forecast, by country
7.5.3.6.    Latin America

7.5.3.6.1.    Market size and forecast, by component
7.5.3.6.2.    Market size and forecast, by deployment mode
7.5.3.6.3.    Market size and forecast, by industry vertical

7.5.3.7.    Middle East

7.5.3.7.1.    Market size and forecast, by component
7.5.3.7.2.    Market size and forecast, by deployment mode
7.5.3.7.3.    Market size and forecast, by industry vertical

7.5.3.8.    Africa

7.5.3.8.1.    Market size and forecast, by component
7.5.3.8.2.    Market size and forecast, by deployment mode
7.5.3.8.3.    Market size and forecast, by industry vertical

CHAPTER 8:    COMPANY PROFILES

8.1.    ALTAIR ENGINEERING, INC.

8.1.1.    Company overview
8.1.2.    Company snapshot
8.1.3.    Operating business segments
8.1.4.    Product portfolio
8.1.5.    Business performance
8.1.6.    Key strategic moves and developments

8.2.    ANSYS, INC.

8.2.1.    Company overview
8.2.2.    Company snapshot
8.2.3.    Product portfolio
8.2.4.    Business performance
8.2.5.    Key strategic moves and developments

8.3.    AUTODESK INC.

8.3.1.    Company overview
8.3.2.    Company snapshot
8.3.3.    Operating business segments
8.3.4.    Product portfolio
8.3.5.    Business performance
8.3.6.    Key strategic moves and developments

8.4.    BENTLEY SYSTEMS, INCORPORATED

8.4.1.    Company overview
8.4.2.    Company snapshot
8.4.3.    Product portfolio
8.4.4.    Key strategic moves and developments

8.5.    DASSAULT SYSTÈMES

8.5.1.    Company overview
8.5.2.    Company snapshot
8.5.3.    Operating business segments
8.5.4.    Product portfolio
8.5.5.    Business performance
8.5.6.    Key strategic moves and developments

8.6.    HEXAGON MANUFACTURING INTELLIGENCE (HEXAGON AB)

8.6.1.    Company overview
8.6.2.    Company snapshot
8.6.3.    Operating business segments
8.6.4.    Product portfolio
8.6.5.    Business performance
8.6.6.    Key strategic moves and developments

8.7.    PTC

8.7.1.    Company overview
8.7.2.    Company snapshot
8.7.3.    Operating business segments
8.7.4.    Product portfolio
8.7.5.    Business performance
8.7.6.    Key strategic moves and developments

8.8.    SIEMENS AG (SIEMENS PLM SOFTWARE INC.)

8.8.1.    Company overview
8.8.2.    Company snapshot
8.8.3.    Operating business segments
8.8.4.    Product portfolio
8.8.5.    Business performance
8.8.6.    Key strategic moves and developments

8.9.    THE ANYLOGIC COMPANY

8.9.1.    Company overview
8.9.2.    Company snapshot
8.9.3.    Product portfolio

8.10.    THE MATHWORKS, INC.

8.10.1.    Company overview
8.10.2.    Company snapshot
8.10.3.    Product portfolio
8.10.4.    Key strategic moves and developments

LIST OF TABLES

TABLE 01.    GLOBAL SIMULATION SOFTWARE MARKET REVENUE, BY COMPONENTS, 2017–2025($MILLION)
TABLE 02.    SIMULATION SOFTWARE MARKET REVENUE, BY REGION, 2017–2025($MILLION)
TABLE 03.    SIMULATION SOFTWARE SERVICES MARKET REVENUE, BY REGION, 2017–2025($MILLION)
TABLE 04.    GLOBAL SIMULATION SOFTWARE MARKET REVENUE, BY DEPLOYMENT MODE, 2017–2025($MILLION)
TABLE 05.    ON PREMISE SIMULATION SOFTWARE MARKET REVENUE, BY REGION, 2017–2025($MILLION)
TABLE 06.    CLOUD BASED SIMULATION SOFTWARE MARKET REVENUE, BY REGION, 2017–2025($MILLION)
TABLE 07.    GLOBAL SIMULATION SOFTWARE MARKET REVENUE, BY INDUSTRY VERTICAL, 2017–2025($MILLION)
TABLE 08.    AEC MARKET REVENUE, BY REGION, 2017–2025($MILLION)
TABLE 09.    AEROSPACE AND DEFENSE SIMULATION SOFTWARE MARKET REVENUE, BY REGION, 2017–2025($MILLION)
TABLE 10.    AUTOMOTIVE SIMULATION SOFTWARE MARKET REVENUE, BY REGION, 2017–2025($MILLION)
TABLE 11.    ELECTRICAL AND ELECTRONICS  SIMULATION SOFWTARE MARKET REVENUE, BY REGION, 2017–2025($MILLION)
TABLE 12.    HEALTHCARE SIMULATION SOFTWARE MARKET REVENUE, BY REGION, 2017–2025($MILLION)
TABLE 13.    OTHERSSIMULATION SOFTWARE MARKET REVENUE, BY REGION, 2017–2025($MILLION)
TABLE 14.    SIMULATION SOFTWARE MARKET REVENUE, BY REGION, 2017–2025($MILLION)
TABLE 15.    NORTH AMERICA SIMULATION SOFTWARE MARKET, BY COMPONENT, 2017–2025($MILLION)
TABLE 16.    NORTH AMERICA SIMULATION SOFTWARE MARKET, BY DEPLOYMENT MODE, 2017–2025($MILLION)
TABLE 17.    NORTH AMERICA SIMULATION SOFTWARE MARKET, BY INDUSTRY VERTICAL, 2017–2025($MILLION)
TABLE 18.    NORTH AMERICA SIMULATION SOFTWARE MARKET, BY COUNTRY, 2017–2025($MILLION)
TABLE 19.    U.S. SIMULATION SOFTWARE MARKET, BY COMPONENT, 2017–2025($MILLION)
TABLE 20.    U.S. SIMULATION SOFTWARE MARKET, BY DEPLOYMENT MODE, 2017–2025($MILLION)
TABLE 21.    U.S. SIMULATION SOFTWARE MARKET, BY INDUSTRY VERTICAL, 2017–2025($MILLION)
TABLE 22.    CANADA SIMULATION SOFTWARE MARKET, BY COMPONENT, 2017–2025($MILLION)
TABLE 23.    CANADA SIMULATION SOFTWARE MARKET, BY DEPLOYMENT MODE, 2017–2025($MILLION)
TABLE 24.    CANADA SIMULATION SOFTWARE MARKET, BY END USER, 2017–2025($MILLION)
TABLE 25.    EUROPE SIMULATION SOFTWARE MARKET, BY COMPONENT, 2017–2025($MILLION)
TABLE 26.    EUROPE SIMULATION SOFTWARE MARKET, BY DEPLOYMENT MODE, 2017–2025($MILLION)
TABLE 27.    EUROPE SIMULATION SOFTWARE MARKET, BY INDUSTRY VERTICAL, 2017–2025($MILLION)
TABLE 28.    EUROPE SIMULATION SOFTWARE MARKET, BY COUNTRY, 2017–2025($MILLION)
TABLE 29.    UK SIMULATION SOFTWARE MARKET, BY COMPONENT, 2017–2025($MILLION)
TABLE 30.    UK SIMULATION SOFTWARE MARKET, BY DEPLOYMENT MODE, 2017–2025($MILLION)
TABLE 31.    UK SIMULATION SOFTWARE MARKET, BY INDUSTRY VERTICAL, 2017–2025($MILLION)
TABLE 32.    FRANCE SIMULATION SOFTWARE MARKET, BY COMPONENT, 2017–2025($MILLION)
TABLE 33.    FRANCE SIMULATION SOFTWARE MARKET, BY DEPLOYMENT MODE, 2017–2025($MILLION)
TABLE 34.    FRANCE SIMULATION SOFTWARE MARKET, BY INDUSTRY VERTICAL, 2017–2025($MILLION)
TABLE 35.    GERMANY SIMULATION SOFTWARE MARKET, BY COMPONENT, 2017–2025($MILLION)
TABLE 36.    GERMANY SIMULATION SOFTWARE MARKET, BY DEPLOYMENT MODE, 2017–2025($MILLION)
TABLE 37.    GERMANY SIMULATION SOFTWARE MARKET, BY INDUSTRY VERTICAL, 2017–2025($MILLION)
TABLE 38.    REST OF EUROPE SIMULATION SOFTWARE MARKET, BY COMPONENT, 2017–2025($MILLION)
TABLE 39.    REST OF EUROPE SIMULATION SOFTWARE MARKET, BY DEPLOYMENT MODE, 2017–2025($MILLION)
TABLE 40.    REST OF EUROPE SIMULATION SOFTWARE MARKET, BY INDUSTRY VERTICAL, 2017–2025($MILLION)
TABLE 41.    ASIA-PACIFIC SIMULATION SOFTWARE MARKET, BY COMPONENT, 2017–2025($MILLION)
TABLE 42.    ASIA-PACIFIC SIMULATION SOFTWARE MARKET, BY DEPLOYMENT MODE, 2017–2025($MILLION)
TABLE 43.    ASIA-PACIFIC SIMULATION SOFTWARE MARKET, BY INDUSTRY VERTICAL, 2017–2025($MILLION)
TABLE 44.    ASIA-PACIFIC SIMULATION SOFTWARE MARKET, BY COUNTRY, 2017–2025($MILLION)
TABLE 45.    CHINA SIMULATION SOFTWARE MARKET, BY COMPONENT, 2017–2025($MILLION)
TABLE 46.    CHINA SIMULATION SOFTWARE MARKET, BY DEPLOYMENT MODE, 2017–2025($MILLION)
TABLE 47.    CHINA SIMULATION SOFTWARE MARKET, BY INDUSTRY VERTICAL, 2017–2025($MILLION)
TABLE 48.    INDIA SIMULATION SOFTWARE MARKET, BY COMPONENT, 2017–2025($MILLION)
TABLE 49.    INDIA SIMULATION SOFTWARE MARKET, BY DEPLOYMENT MODE, 2017–2025($MILLION)
TABLE 50.    INDIA SIMULATION SOFTWARE MARKET, BY INDUSTRY VERTICAL, 2017–2025($MILLION)
TABLE 51.    JAPAN SIMULATION SOFTWARE MARKET, BY COMPONENT, 2017–2025($MILLION)
TABLE 52.    JAPAN SIMULATION SOFTWARE MARKET, BY DEPLOYMENT MODE, 2017–2025($MILLION)
TABLE 53.    JAPAN SIMULATION SOFTWARE MARKET, BY INDUSTRY VERTICAL, 2017–2025($MILLION)
TABLE 54.    REST OF ASIA-PACIFIC SIMULATION SOFTWARE MARKET, BY COMPONENT, 2017–2025($MILLION)
TABLE 55.    REST OF ASIA-PACIFIC SIMULATION SOFTWARE MARKET, BY DEPLOYMENT MODE, 2017–2025($MILLION)
TABLE 56.    REST OF ASIA-PACIFIC SIMULATION SOFTWARE MARKET, BY INDUSTRY VERTICAL, 2017–2025($MILLION)
TABLE 57.    LAMEA SIMULATION SOFTWARE MARKET, BY COMPONENT, 2017–2025($MILLION)
TABLE 58.    LAMEA SIMULATION SOFTWARE MARKET, BY DEPLOYMENT MODE, 2017–2025($MILLION)
TABLE 59.    LAMEA SIMULATION SOFTWARE MARKET, BY INDUSTRY VERTICAL, 2017–2025($MILLION)
TABLE 60.    LAMEA SIMULATION SOFTWARE MARKET, BY COUNTRY, 2017–2025($MILLION)
TABLE 61.    LATIN AMERICA SIMULATION SOFTWARE MARKET, BY COMPONENT, 2017–2025($MILLION)
TABLE 62.    LATIN AMERICA SIMULATION SOFTWARE MARKET, BY DEPLOYMENT MODE, 2017–2025($MILLION)
TABLE 63.    LATIN AMERICA SIMULATION SOFTWARE MARKET, BY INDUSTRY VERTICAL, 2017–2025($MILLION)
TABLE 64.    MIDDLE EAST SIMULATION SOFTWARE MARKET, BY COMPONENT, 2017–2025($MILLION)
TABLE 65.    MIDDLE EAST SIMULATION SOFTWARE MARKET, BY DEPLOYMENT MODE, 2017–2025($MILLION)
TABLE 66.    MIDDLE EAST SIMULATION SOFTWARE MARKET, BY INDUSTRY VERTICAL, 2017–2025($MILLION)
TABLE 67.    AFRICA SIMULATION SOFTWARE MARKET, BY COMPONENT, 2017–2025($MILLION)
TABLE 68.    AFRICA SIMULATION SOFTWARE MARKET, BY DEPLOYMENT MODE, 2017–2025($MILLION)
TABLE 69.    AFRICA SIMULATION SOFTWARE MARKET, BY INDUSTRY VERTICAL, 2017–2025($MILLION)
TABLE 70.    ALTAIR ENGINEERING, INC.: COMPANY SNAPSHOT
TABLE 71.    ALTAIR ENGINEERING, INC.: OPERATING SEGMENT
TABLE 72.    ALTAIR ENGINEERING, INC.: PRODUCT PORTFOLIO
TABLE 73.    ANSYS, INC.: COMPANY SNAPSHOT
TABLE 74.    ANSYS, INC.: PRODUCT PORTFOLIO
TABLE 75.    AUTODESK INC. : COMPANY SNAPSHOT
TABLE 76.    AUTODESK INC. : OPERATING SEGMENT
TABLE 77.    AUTODESK INC. : PRODUCT PORTFOLIO
TABLE 78.    BENTLEY SYSTEMS, INCORPORATED: COMPANY SNAPSHOT
TABLE 79.    BENTLEY SYSTEMS, INCORPORATED: PRODUCT PORTFOLIO
TABLE 80.    DASSAULT SYSTÈMES: COMPANY SNAPSHOT
TABLE 81.    DASSAULT SYSTÈMES: OPERATING SEGMENTS
TABLE 82.    DASSAULT SYSTÈMES: PRODUCT PORTFOLIO
TABLE 83.    HEXAGON AB: COMPANY SNAPSHOT
TABLE 84.    HEXAGON AB: PRODUCT CATEGORY
TABLE 85.    HEXAGON AB: PRODUCT PORTFOLIO
TABLE 86.    PTC: COMPANY SNAPSHOT
TABLE 87.    PTC: OPERATING SEGMENTS
TABLE 88.    PTC: PRODUCT PORTFOLIO
TABLE 89.    SIEMENS AG: COMPANY SNAPSHOT
TABLE 90.    SIEMENS AG: OPERATING SEGMENTS
TABLE 91.    SIEMENS AG: PRODUCT PORTFOLIO
TABLE 92.    THE ANYLOGIC COMPANY: COMPANY SNAPSHOT
TABLE 93.    THE ANYLOGIC COMPANY: PRODUCT PORTFOLIO
TABLE 94.    THE MATHWORKS, INC. COMPANY SNAPSHOT
TABLE 95.    THE MATHWORKS, INC.: PRODUCT PORTFOLIO

LIST OF FIGURES

FIGURE 01.    GLOBAL SIMULATION SOFTWARE MARKET, 2017–2025
FIGURE 02.    SIMULATION SOFTWARE MARKET, BY REGION, 2017–2025
FIGURE 03.    GLOBAL SIMULATION SOFTWARE MARKET: KEY PLAYERS
FIGURE 04.    GLOBAL SIMULATION SOFTWARE MARKET SEGMENTATION
FIGURE 05.    TOP IMPACTING FACTORS
FIGURE 06.    TOP INVESTMENT POCKETS
FIGURE 07.    TOP WINNING STRATEGIES, BY YEAR, 2015–2018*
FIGURE 08.    TOP WINNING STRATEGIES, BY DEVELOPMENT, 2015–2018* (%)
FIGURE 09.    TOP WINNING STRATEGIES, BY COMPANY, 2015–2018*
FIGURE 10.    MODERATE BARGAINING POWER OF SUPPLIER
FIGURE 11.    HIGH BARGAINING POWER OF BUYER
FIGURE 12.    HIGH THREAT OF SUBSTITUTES
FIGURE 13.    MODERATE-TO-HIGH THREAT OF NEW ENTRANTS
FIGURE 14.    HIGH COMPETITIVE RIVALRY
FIGURE 15.    SIMULATION SOFTWARE MARKET: KEY PLAYER POSITIONING, 2017
FIGURE 16.    DRIVERS, RESTRAINTS, AND OPPORTUNITIES
FIGURE 17.    COMPARATIVE SHARE ANALYSIS OF SIMULATION SOFTWARE MARKET, BY COUNTRY,  2017 & 2025(%)
FIGURE 18.    COMPARATIVE SHARE ANALYSIS OF SIMULATION SOFTWARE SERVICES MARKET, BY COUNTRY,  2017 & 2025(%)
FIGURE 19.    COMPARATIVE SHARE ANALYSIS OF ON PREMISE SIMULATION SOFTWARE MARKET, BY COUNTRY,  2017 & 2025(%)
FIGURE 20.    COMPARATIVE SHARE ANALYSIS OF CLOUD BASED SIMULATION SOFTWRAE MARKET, BY COUNTRY,  2017 & 2025(%)
FIGURE 21.    COMPARATIVE SHARE ANALYSIS OF AEC SIMULATION SOFTWARE MARKET, BY COUNTRY,  2017 & 2025(%)
FIGURE 22.    COMPARATIVE SHARE ANALYSIS OF AEROSPACE AND DEFENSE SIMULATION SOFTWARE MARKET, BY COUNTRY,  2017 & 2025(%)
FIGURE 23.    COMPARATIVE SHARE ANALYSIS OF AUTOMOTIVE SIMULATION SOFTWARE MARKET, BY COUNTRY,  2017 & 2025(%)
FIGURE 24.    COMPARATIVE SHARE ANALYSIS OF ELECTRICAL AND ELECTRONICS SIMULATION SOFWTARE MARKET, BY COUNTRY,  2017 & 2025(%)
FIGURE 25.    COMPARATIVE SHARE ANALYSIS OF HEALTHCARE SIMULATION SOFTWARE MARKET, BY COUNTRY,  2017 & 2025(%)
FIGURE 26.    COMPARATIVE SHARE ANALYSIS OF OTHERS SIMULATION SOFTWARE MARKET, BY COUNTRY,  2017 & 2025(%)
FIGURE 27.    U.S. SIMULATION SOFTWARE MARKET, 2017–2025($MILLION)
FIGURE 28.    CANADA SIMULATION SOFTWARE MARKET, 2017–2025($MILLION)
FIGURE 29.    UK SIMULATION SOFTWARE MARKET, 2017–2025($MILLION)
FIGURE 30.    FRANCE SIMULATION SOFTWARE MARKET, 2017–2025($MILLION)
FIGURE 31.    GERMANY SIMULATION SOFTWARE MARKET, 2017–2025($MILLION)
FIGURE 32.    REST OF EUROPE SIMULATION SOFTWARE MARKET, 2017–2025($MILLION)
FIGURE 33.    CHINA SIMULATION SOFTWARE MARKET, 2017–2025($MILLION)
FIGURE 34.    INDIA SIMULATION SOFTWARE MARKET, 2017–2025($MILLION)
FIGURE 35.    JAPAN SIMULATION SOFTWARE MARKET, 2017–2025($MILLION)
FIGURE 36.    REST OF ASIA-PACIFIC SIMULATION SOFTWARE MARKET, 2017–2025($MILLION)
FIGURE 37.    LATIN AMERICA SIMULATION SOFTWARE MARKET, 2017–2025($MILLION)
FIGURE 38.    MIDDLE EAST SIMULATION SOFTWARE MARKET, 2017–2025($MILLION)
FIGURE 39.    AFRICA SIMULATION SOFTWARE MARKET, 2017–2025($MILLION)
FIGURE 40.    ALTAIR ENGINEERING, INC.: REVENUE, 2018–2025 ($MILLION)
FIGURE 41.    ALTAIR ENGINEERING, INC.: REVENUE SHARE BY SEGMENT, 2017 (%)
FIGURE 42.    ALTAIR ENGINEERING, INC.: REVENUE SHARE BY GEOGRAPHY, 2017 (%)
FIGURE 43.    ANSYS, INC.: REVENUE, 2018–2025 ($MILLION)
FIGURE 44.    ANSYS, INC.: REVENUE SHARE BY GEOGRAPHY, 2017 (%)
FIGURE 45.    AUTODESK INC.: REVENUE, 2015–2017 ($MILLION)
FIGURE 46.    AUTODESK INC.: REVENUE SHARE BY SEGMENT, 2017 (%)
FIGURE 47.    AUTODESK INC.: REVENUE SHARE BY GEOGRAPHY, 2017 (%)
FIGURE 48.    DASSAULT SYSTÈMES: REVENUE, 2015–2017 ($MILLION)
FIGURE 49.    DASSAULT SYSTÈMES: REVENUE SHARE BY SEGMENT, 2017 (%)
FIGURE 50.    DASSAULT SYSTÈMES: REVENUE SHARE BY GEOGRAPHY, 2017 (%)
FIGURE 51.    HEXAGON AB: REVENUE, 2015–2017 ($MILLION)
FIGURE 52.    HEXAGON AB: REVENUE SHARE BY SEGMENT, 2017 (%)
FIGURE 53.    HEXAGON AB: REVENUE SHARE BY GEOGRAPHY, 2017 (%)
FIGURE 54.    PTC: REVENUE, 2015–2017 ($MILLION)
FIGURE 55.    PTC: REVENUE SHARE BY SEGMENT, 2017 (%)
FIGURE 56.    PTC: REVENUE SHARE BY GEOGRAPHY, 2017 (%)
FIGURE 57.    SIEMENS AG: REVENUE, 2015–2017 ($MILLION)
FIGURE 58.    SIEMENS AG: REVENUE SHARE BY SEGMENT, 2017 (%)
FIGURE 59.    SIEMENS AG: REVENUE SHARE BY GEOGRAPHY, 2017 (%)


Simulation software assists in predicting the behavior of a system under conditions that are difficult to replicate. It facilitates the evaluation of new designs, diagnoses the problems associated with it, and tests the system under various complex conditions.

There is an increase in demand for simulation software due to rise in expenditure on R&D in various industries such as aerospace & defense, automobiles, healthcare, among others. Further, rise in demand for reduced timeline of product development and reduced cost are the key factors driving the growth of this market. Simulation software market is anticipated to impact positively due to emerging trends such as additive manufacturing, digital twin, real-time simulation support, and effective use of IoT and data analytics in simulation.

Furthermore, simulation software market has witnessed the trend of strategic partnerships and collaborations between peer as well as major players from end-user industries to cater the challenging requirements in the related sector. This is anticipated to boost the growth of the market during the forecast period.

The key players profiled in the report include Altair Engineering Inc.; ANSYS, Inc.; Autodesk, Inc.; Bentley Systems; Dassault Systѐmes; Hexagon (MSC Software Corporation); The MathWorks, Inc.; PTC Inc.; Siemens PLM Software; and The AnyLogic Company. These players have adopted various growth strategies to enhance their product portfolio and increase market penetration. For instance, on September 2017, Siemens PLM Software acquired Infolytica to add advanced capabilities in electronics simulation and testing, autonomous driving, and electromagnetics to their portfolio.

PURCHASE OPTIONS

Call or Email us

U.S.-Canada Toll-free: +1-800-792-5285
Int'l : +1-503-894-6022
Europe : +44-845-528-1300
Email : help@alliedmarketresearch.com
 
FREQUENTLY ASKED QUESTIONS?

A. The simulation software market is expected to grow at CAGR of 8.90% from 2018 to 2025.

A. Rise in demand for ecofriendly work environment, Upsurge in use of simulation software in Automotive and Healthcare industry & Significant adoption of simulation among aerospace and defense

A. To get updated version of simulation software market report

A. The simulation software market is estimated to reach $10,029 million by 2025.

A. Majority of the company operating in the market are investing on R&D practices.

A. On the basis of top growing big corporation we select top 10 players.

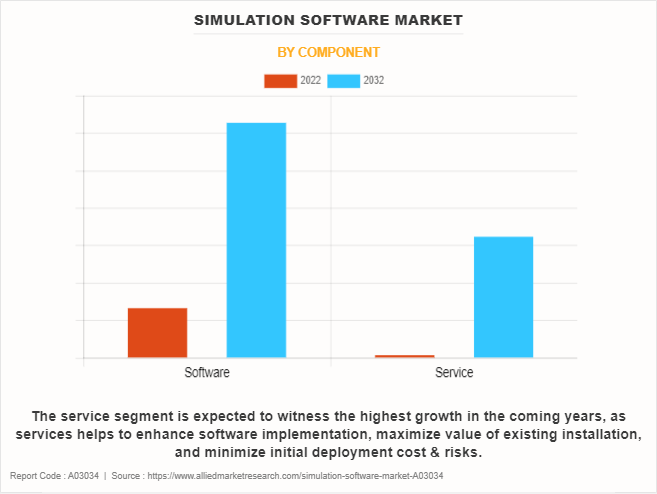
A. The software segment is expected to exhibit significant increase in terms of revenue during the forecast period.

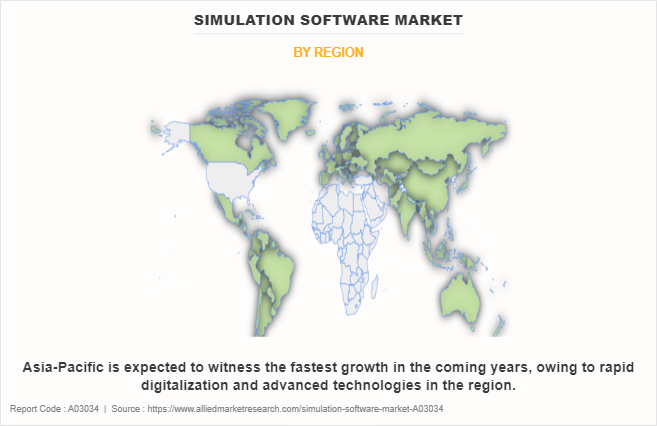
A. Asia-Pacific is projected to exhibit substantial growth during the forecast period.

A. The simulation software market in 2017 was $5,135 million

A. Altair Engineering, Inc., ANSYS, Inc., Autodesk, Inc., Bentley Systems, Dassault Systmes, Hexagon (MSC Software Corporation), The MathWorks, Inc., PTC, Inc. some of the key players operating in the global market.

Looking for Customization?

 Customization Request

Have a Question?

 Speak with Analyst

Any Confusion?

 Inquire Before Buying

Have a glance of the Report

  Request Sample

Purchase Full Report of
Simulation Software Market

Start reading instantly.
This Report and over 66,804+ more Reports, Available with Avenue Library. T&C*.

  • Online Only
  • $3,456
  • Online cloud access only
  • Restricted print, copy, paste & download
  • Read only
  • Free industry update
    (Within 180 days)
  • Free report update in next update cycle
    (Nov 2019 - Nov 2020)
  • Data Pack
  • $3,840
  • Restricted to one authorized user
  • One print only
  • Available in
    Excel
  • Free industry update
    (Within 180 days)
  •   Free report update in next update cycle
    (Nov 2019 - Nov 2020)
  • Single User
  • $5,769
  • Restricted to one authorized user
  • One print only
  • Available in
    PDF
  • Free industry update
    (Within 180 days)
  •   Free report update in next update cycle
    (Nov 2019 - Nov 2020)
  • Five Users
  • $6,450
  • Limited to five authorized users
  • Print upto five copies
  • Available in
    PDF
  • Free industry update
    (Within 180 days)
  •   Free report update in next update cycle
    (Nov 2019 - Nov 2020)
  • Enterprise
    License/PDF

  • $10,995
  • Unlimited
    within
    company/enterprise
  • Available in Excel & PDF
  • Free industry update
    (Within 180 days)
  •   Free report update in next update cycle
    (Nov 2019 - Nov 2020)
  • Library
    Membership

  • $999 $ 1,175
    Per User/ Per month/ Billed annually
  • Published Content
    E-access
  • Company Profiles
    E-access
  • Newly Added Content Access
  • 10 PDF
    Downloads
  • 5 Excel Data
    Pack Downloads
  • 250 Company Profiles PDF Downloads
  • Buy Now

*Taxes/Fees, if applicable will be added during checkout. All prices in USD

RELATED REPORTS
 

Why Allied Market Research?


Infallible Methodology

To ensure high-level data integrity, accurate analysis, and impeccable forecasts

Analyst Support

For complete satisfaction

Customization

On-demand customization of scope of the report to exactly meet your needs

TARGETED MARKET VIEW

Targeted market view to provide pertinent information and save time of readers

Get fresh content delivered

Get insights on topics that are crucial for your business. Stay abreast of your interest areas.

Get Industry Data Alerts

Why Allied Market Research?

Infallible Methodology

To ensure high-level data integrity, accurate analysis, and impeccable forecasts

Analyst Support

For complete satisfaction

Customization

On-demand customization of scope of the report to exactly meet your needs

TARGETED MARKET VIEW

Targeted market view to provide pertinent information and save time of readers