
Small Satellite Market Summary
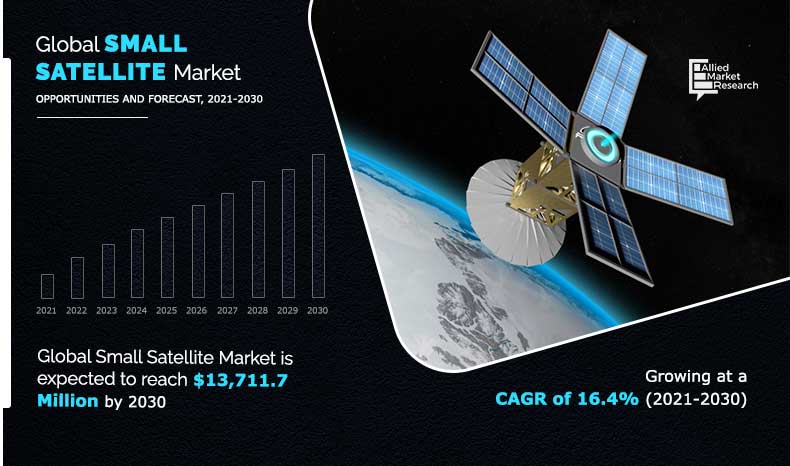
The global small satellite market size valued $3,251.9 million in 2020, and is projected to reach $13,711.7 million by 2030, registering a CAGR of 16.4% from 2021 to 2030. The global small satellite market is expected to grow due to increased technical innovation, lower launch costs, and the development of automation technologies during the forecast period.
Key Market Trends and Insights
Region wise, North America generated the highest revenue in 2020.
The global small satellite market share was dominated by the commercial segment in 2020 and is expected to maintain its dominance in the upcoming years
The minisatellite segment is expected to witness the highest growth during the forecast
Market Size & Forecast
- 2020 Market Size: USD 3,251.9 Million
- 2030 Projected Market Size: USD 13,711.7 Million
- Compound Annual Growth Rate (CAGR) (2021-2030): 16.4%
- North America: Generated the highest revenue in 2020
Small satellites are low-cost alternatives that have allowed commercial enterprises, non-profit groups, and educational institutions to conduct missions in low-Earth orbit. These small satellites make it possible to conduct a variety of scientific investigations and technological demonstrations in orbit at a low cost, in a timely manner, and with relative ease. Smaller and lighter satellites require smaller and less expensive launch vehicles, and multiple satellite launches are often possible. They can also be deployed 'piggyback' on larger launch vehicles to take advantage of additional launch vehicle capacity. Miniaturized satellites enable for more cost-effective designs and mass manufacture.
Small satellites offer completely new designs for a wide range of space operations, with the potential for exponential leaps in transformational research, thanks to technological innovation. For instance, SpaceX launched a Falcon 9 rocket with 143 small satellites from Cape Canaveral in January 2021. The development of reusable rocket technology has reduced the cost of launch services, allowing more people to use small satellites throughout the world.
Increase in demand for compact satellites
Small satellites built to CubeSat specifications save significant resources. This aids in the removal of hurdles to accessing and exploring space, resulting in a surge in the popularity of small satellites since their inception. In addition, depending on the requirements, a small satellite may be built and placed in orbit at lower costs when compared to the cost of traditional satellite missions. Apart from the advantages of lower weight and size, the major advantage of small satellites is the brief time it takes to develop them. While a traditional or large satellite takes 5 to 15 years to develop and deploy in orbit, a CubeSat may identify a requirement and place itself in the desired orbit in less than 8 months. Microsatellites and nanosatellites are also a type of small satellites which are more cost-effective than traditional satellites and are often designed for communication, commercial, and space research. Due to their lightweight characteristics, shorter development cycles, high capability of executing complex computing activities, and cheaper development and launch costs, demand for these satellites has grown substantially in the recent years. For instance, York Space Systems announced plans in May 2021 to build a massive manufacturing facility in Denver to increase the number of small satellites it produces by about 4 times its current manufacturing capacity. After the establishment of the manufacturing facility York will be able to produce up to 80 satellites at once in the new facility, compared to York's present production unit, which can only build 20 satellites at a time.
The increase in the focus of satellite manufacturers toward the development of compact satellites owing to the decreased cost and development time of small satellites is the key driving factor propelling the small satellite market growth forecast timeframe.
By Type
Nanosatellite is projected as the most lucrative segments
Rise in demand for high-resolution imaging services globally
In recent years, there has been substantial growth in demand for small satellites all around the world. According to nanosats.eu, more than 2,900 nanosatellites have been launched into Earth's orbit as of January 2021. Companies are launching constellations of small satellites namely nanosatellites or microsatellites into Earth's orbit for applications including earth observation and telecommunications, such as high-speed space-based internet services. For instance, Sateliot, a nanosatellite and telecommunications operator headquartered in Spain, signed a Memorandum of Understanding (MoU) with the European Space Agency (ESA) in January 2020 to research, develop, and deploy novel space-capable technologies, goods, and services leveraging 5G. The business plans to spend about $118.8 million to launch a constellation of 20 nanosatellites for hybrid terrestrial space networks, 5G network design, spectrum management, and spectrum exchange. Several countries across the globe are collaborating with small satellite manufacturers for satellite imaging. For instance, in 2020, Space-SI, Slovenia's Centre of Excellence for Space Sciences and Technologies, launched the country's first microsatellite, NEMO-HD, carrying a multispectral high-definition Earth observation equipment in collaboration with Space Flight Laboratory. This device records high-definition video at a rate of 25 frames per second. This satellite's video data and images will be utilized to monitor forestry, agricultural, urban growth, and marine transport.
The above-mentioned factors such as the rise in demand for high-resolution imaging services across the world by government and commercial research organizations fuel the growth of the small satellite market during the forecast timeframe.
By Application
Satellite communication is projected as the most lucrative segments
Limitations of small satellites regarding payload accommodation
Small satellites are low-cost alternatives that are increasingly being launched into orbit for scientific research and commercial applications. Small satellites are built in a fraction of the time and cost of larger satellites, reducing the reliance on deployable structures and complex mechanisms and allowing mission disaggregation. Small satellites, on the other hand, have their own set of restrictions. The ability of small satellites to conduct a range of missions is limited by their payload capacity. As small satellites are compact, there are severe constraints on the volume of propulsion, payload, and other subsystems that could be equipped in the small satellites. The increased impulse required for maneuver missions necessitates the use of additional propellant, which further limits the capacity for any scientific equipment or payload planned to be carried by the small satellites. Small satellites' lack of space also restricts their ability to carry key components which are required to carry out complicated missions.
Due to the limited volume of small satellites, another constraint has been observed, which is poor power generation. Small satellites are being used by a variety of researchers to carry out biological, interdisciplinary research, and planetary science missions. However, the capabilities or information that can be gathered are severely restricted, due to the lack of propulsion systems for on-orbit maneuvering, strong attitude determination and control systems, and power generation by small satellites.
By End User
Commercial is projected as the most lucrative segments
Increase in demand in the commercial sector for satellite services
Satellite manufacturers' intense emphasis on lowering the cost of small satellites has aided the adoption of small satellites for offering cutting-edge services such as broadband internet, satellite TV, and other services in commercial organizations. Small satellites can be built with reusable and low-cost hardware components and technology. Since small satellites are compact and lightweight, they do not require a specialized launch vehicle like regular satellites which further reduces launch costs by up to 40%. Miniaturization of components and related software has prompted established private companies and SMEs to invest in small satellites. Microelectronic innovations such as lightweight apertures, antennas, panels, trans-receivers, control sensors & actuators, and multispectral imagers are expected to boost the efficiency and processing power of small satellites while reducing the complexities associated with traditional satellites, making them easier to assemble and test. Industry leaders such as SpaceX, Virgin Galactic, and Blue Origin, are developing reusable space launch vehicles that may be used for many flights, thereby lowering the prices of small satellites and increasing the adoption of small satellites namely micro and nanosatellites.
The increase in focus of commercial organizations for the deployment of advanced satellite services presents an opportunity for the growth of the small satellite market.
By Region
Asia Pacific would exhibit the highest CAGR of 17.2% during 2020-2027.
Segments Overview
The small satellite market segmentation into type, application, and end user. By type, the market is divided into minisatellite, microsatellite, nanosatellite, and others. By application, it is classified into earth observation & remote sensing, satellite communication, science & exploration, mapping & navigation, space observation, and others. By end user, it is divided into commercial, academic, government & military, and others. Region-wise, the small satellite market is analyzed across North America, Europe, Asia-Pacific, and LAMEA.
Competitive Analysis
Key players operating in the small satellite market include Airbus S.A.S., GomSpace, L3Harris Technologies, Inc., Lockheed Martin Corporation, Northrop Grumman Corporation, Planet Labs Inc., Sierra Nevada Corporation, Thales Group, Aerospace Corporation, and The Boeing Company.
COVID-19 Impact Analysis
- The COVID-19 impact on the small satellite market is unpredictable and the growth of the small satellite industry is expected to remain restricted till the second quarter of 2021.
- The COVID-19 outbreak forced governments across the globe to implement strict lockdowns and made social distancing mandatory to contain the spread of the virus. Consequently, several organizations started work from home programs as safety measures. This led to a sudden decrease in demand for small satellites across the world.
- Moreover, nationwide lockdowns disrupted the supply-chain as several manufacturing facilities across the globe had to partially or fully shut down their operations.
- The adverse impacts of the COVID-19 pandemic resulted in huge supply-demand issues for the small satellite industry globally.
Key Benefits For Stakeholders
- This study presents the analytical depiction of the global small satellite market analysis along with the current small satellite market trends and future estimations to depict imminent investment pockets.
- The overall small satellite market opportunity is determined by understanding profitable trends to gain a stronger foothold.
- The report presents information related to the key drivers, restraints, and opportunities of the global small satellite market with detailed impact analysis.
- The current market is quantitatively analyzed from 2020 to 2030 to benchmark financial competency.
- Porter’s five forces analysis illustrates the potency of the buyers and suppliers in the industry.
Small Satellite Market Report Highlights
| Aspects | Details |
| By Type |
|
| By Application |
|
| By End User |
|
| By Region |
|
| Key Market Players | THALES GROUP, THE AEROSPACE CORPORATION, NORTHROP GRUMMAN CORPORATION, THE BOEING COMPANY, SIERRA NEVADA CORPORATION, LOCKHEED MARTIN CORPORATION, L3HARRIS TECHNOLOGIES, INC, AIRBUS S.A.S., GOMSPACE, PLANET LABS INC. |
Analyst Review
The small satellite market is expected to witness significant growth globally due to the rise in deployment of advanced communication and monitoring technologies across the world.
Small satellite adoption in the commercial sector is being driven by a greater focus on lowering costs associated with small satellites. Leading market players are creating customized platforms and applications to meet customers' growing demands, as well as investigating innovative technologies and applications through scientific research and technological demonstrations. Small satellites are employed in applications such as Earth observation and technological demonstration, which are projected to be profitable investment sectors. However, they are fast being embraced in other areas such as commercial, defense, and government for communication and scientific research. Collaborations and acquisitions are likely to help the market leaders grow their product portfolios and expand into new markets.
Factors such as increase in increase in demand for compact satellites, rising demand for high-resolution imaging services globally and increasing demand for LEO-based services accelerate the growth of the small satellite market. However, limitations of small satellites regarding payload accommodation and lack of dedicated small satellite launch vehicles hamper the growth of the small satellite market. Conversely, increasing demand in the commercial sector for satellite services and increase in demand for satellite data are expected to provide lucrative opportunities for the expansion of the growth of the small satellite market.
Small satellites are frequently utilised for space exploration by academics and specialists all around the world. Small satellites, such as CubeSats, are ideal for quick manufacturing and testing due to their small size and weight, making them an ideal and affordable platform for the research and development of new technologies and concepts.
Among the analyzed regions, North America is the highest revenue contributor, followed by Asia-Pacific, Europe, and LAMEA. Based on forecast analysis, North America is expected to maintain its lead during the forecast period, owing to the boom of private satellite manufacturers in the region.
The global small satellite market size was valued at USD 3,251.9 million in 2020, and is projected to reach USD 13,711.7 million by 2030
The global small satellite market is projected to grow at a compound annual growth rate of 16.4% from 2021-2030 to reach USD 13,711.7 million by 2030
The key players profiled in the reports includes PLANET LABS INC., THALES GROUP, THE AEROSPACE CORPORATION, GOMSPACE, AIRBUS S.A.S., LOCKHEED MARTIN CORPORATION, L3HARRIS TECHNOLOGIES, INC, THE BOEING COMPANY, NORTHROP GRUMMAN CORPORATION, SIERRA NEVADA CORPORATION.
North America dominated in 2020 and is projected to maintain its leading position throughout the forecast period.
Increase in demand for compact satellites, Rise in demand for high-resolution imaging services globally, Increase in demand in the commercial sector for satellite services majorly contribute toward the growth of the market.
Loading Table Of Content...

