✷ Report Code: A00833 | Mar 2022 | Pages: 345 | ||
Tables: 142 | Charts: 80 |
|
The global small wind power market was valued at $7.4 billion in 2020, and is projected to reach $17.1 billion by 2030, growing at a CAGR of 8.8% from 2021 to 2030.
Wind turbine market have been negatively impacted amid the lockdown imposed due to the COVID-19 outbreak and recorded a huge decline in Wind turbine. However, it also led to decrease in the small wind power market.
A small wind system is the power system which is connected to the electric grid through power provider or it can stand alone (off-grid). The small wind electric system is a good choice for rural areas that are not already connected to the electric grid. A wind electric system is made up of a wind turbine mounted on a tower to provide better access to stronger winds. In addition to the turbine and tower, small wind electric systems also require balance-of-system components.
Small wind electric system is one of the most cost-effective home-based renewable energy systems with zero emissions and pollution. In addition, according to U.S. department of energy, small wind electric systems can lower the electricity bills by 50%–90% and help to avoid the high costs of having utility power lines extended to a remote location. Moreover, it also helps uninterruptible power supplies ride through extended utility outages. Furthermore, Small wind electric systems can also be used for a variety of other applications, including water pumping on farms and ranches.
A small wind electric system only works if the following condition are fulfilled:
The main characteristics of small wind power system are as follows:
The government initiatives, such as incentives and energy-saving certificates by the governments in India, China, Malaysia, and Thailand, are also expected to encourage commercial units to adapt to power generation from small wind turbines during the forecast period. Moreover, With the rising pollution concerns across the world due to industrialization, especially in Asia-Pacific, the regional wind power generation has gained considerable momentum. The region has become one of the largest producers of wind energy, including small wind energy.
The Global small wind power industry is segmented on the basis of type, installation type, application and region. Depending on type, the market is categorized into Horizontal Axis Wind Turbine and Vertical Axis Wind Turbine. On the basis of installation type, it is segregated into On-Grid and Off-Grid. On the basis of Application, it is classified into residential, commercial, and Utility. Region wises it is analyzed across North America, Europe, Asia-Pacific and LAMEA.
The global small wind power market analysis covers in-depth information about the major industry participants. The key players operating and profiled in the report include Aeolos Wind Energy Ltd, Bergey Wind Power Co., City Windmills, Eocycle Technologies Inc., Northern Power Systems, Ryse Energy, SD Wind Energy Limited, Shanghai Ghrepower Green Energy Co. Ltd., UNITRON Energy Systems Pvt. Ltd. and Wind Energy Solutions.
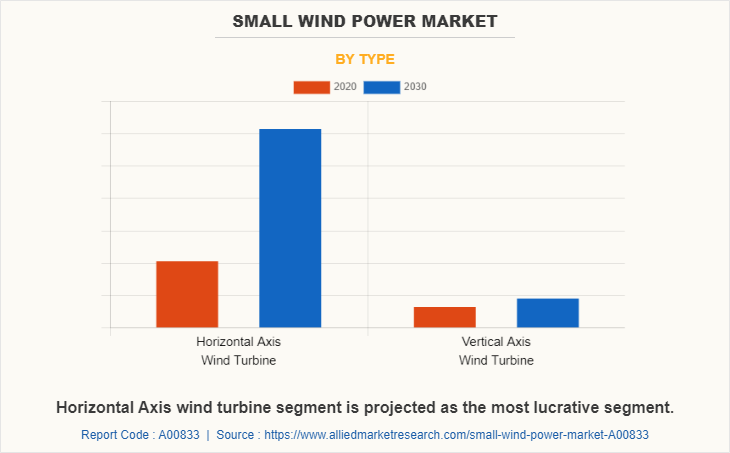
By type, the Vertical Axis Wind Turbines segment dominated the Global small wind power market share in 2020, and is projected to remain the fastest-growing segment during the forecast period. This is attributed to its high efficiency feature.
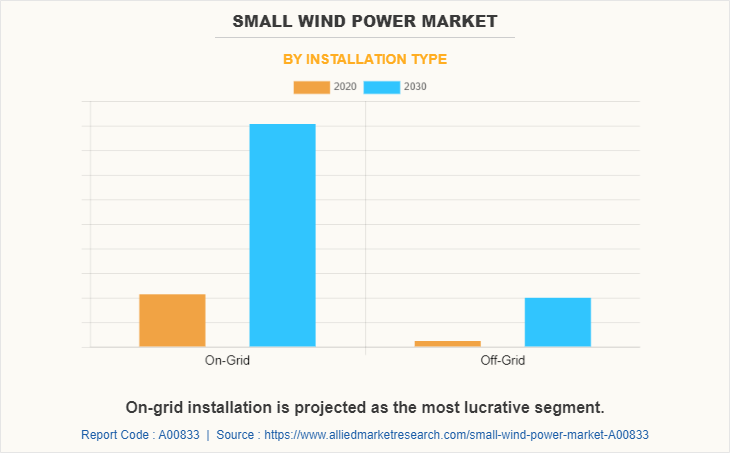
By installation type, the on-grid segment dominated the Global small wind power market size in 2020, and is projected to remain the fastest-growing segment during the forecast period. This is attributed due to rising environmental concerns and demand from off-grid applications are expected to drive the market
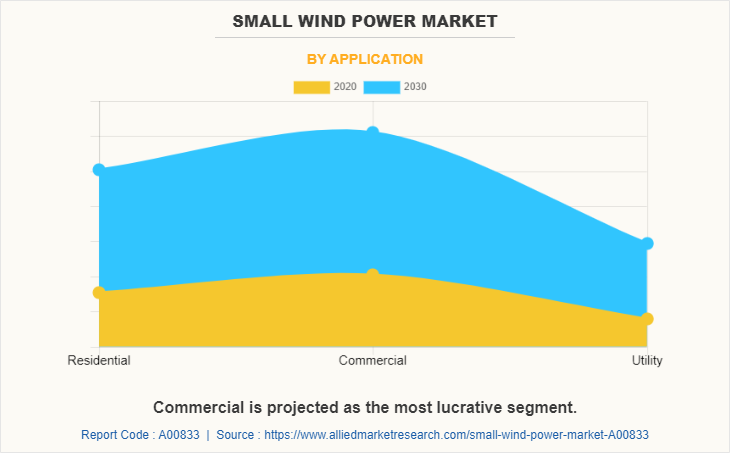
By Application, the commercial segment dominated the Global small wind power market in 2020, and is projected to remain the fastest-growing segment during the forecast period. This is attributed to rise in industrialization and rapid expansion of infrastructure across the globe.
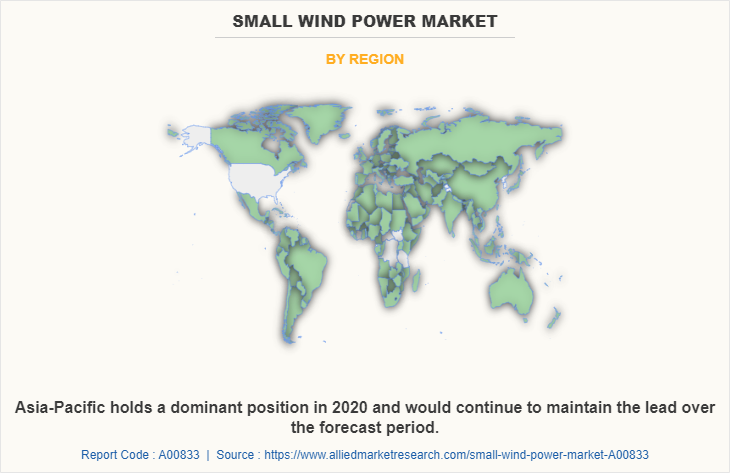
By region, Asia-pacific dominated the Global small wind power market in 2020, and is projected to remain the fastest-growing segment during the forecast period. This is attributed due to various government initiatives, such as incentives and energy-saving certificates by the governments in India, China, Malaysia, and Thailand, are also expected to encourage commercial units to adapt to power generation from small wind turbines during the forecast period.
IMPACT OF COVID-19 ON THE GLOBAL SMALL WIND POWER MARKET
Small Wind Power Market Report Highlights
Aspects | Details |
---|---|
By Type |
|
By Installation Type |
|
By Application |
|
By Region |
|
Key Market Players | Northern Power Systems, Eocycle Technologies Inc., Bergey Wind Power Co, Wind Energy Solutions, SD Wind Energy Limited, UNITRON Energy Systems Pvt. Ltd, Aeolos Wind Energy, City Windmills, Shanghai Ghrepower Green Energy Co. Ltd, Ryse Energy |
CHAPTER 1:INTRODUCTION
1.1.Report description
1.2.Key market segments
1.3.Key benefits for stakeholders
1.4.Research methodology
1.4.1.Primary research
1.4.2.Secondary research
1.4.3.Analyst tools and models
CHAPTER 2:EXECUTIVE SUMMARY
2.1.Key findings
2.2.CXO perspective
CHAPTER 3:MARKET OVERVIEW
3.1.Market definition and scope
3.2.Key findings
3.2.1.Top investment pockets
3.3.Key forces shaping the market
3.4.Market dynamics
3.4.1.Drivers
3.4.1.1.Increase in demand for efficient electricity in unconnected areas
3.4.1.2.Favorable government policies
3.4.1.3.Wind turbines are incredible and space efficient
3.4.2.Restraints
3.4.2.1.High initial costs
3.4.2.2.Area dependency of wind power plant
3.4.3.Opportunity
3.4.3.1.Technological advancements in the small wind power industry
3.5.Value Chain Analysis
3.6.Regulatory Guidelines:
3.7.Impact of CORONA (COVID-19) outbreak on the market
CHAPTER 4:GLOBAL SMALL WIND POWER MARKET, BY TYPE
4.1.Overview
4.1.1.Market size and forecast, by Type
4.2.Horizontal axis wind turbine
4.2.1.Key market trends, growth factors, and opportunities
4.2.2.Market size and forecast, 2020-2030
4.3.Vertical axis wind turbine
4.3.1.Key market trends, growth factors, and opportunities
4.3.2.Market size and forecast, 2020-2030
CHAPTER 5:GLOBAL SMALL WIND POWER MARKET, BY INSTALLATION TYPE
5.1.Overview
5.1.1.Market size and forecast, By Installation type
5.2.On-Grid
5.2.1.Key market trends, growth factors, and opportunities
5.2.2.Market size and forecast, 2020-2030
5.3.Off-Grid
5.3.1.Key market trends, growth factors, and opportunities
5.3.2.Market size and forecast, 2020-2030
CHAPTER 6:GLOBAL SMALL WIND POWER MARKET, BY APPLICATION
6.1.Overview
6.1.1.Market size and forecast, By Application
6.2.Residential
6.2.1.Key market trends, growth factors, and opportunities
6.2.2.Market size and forecast, 2020-2030
6.3.Commercial
6.3.1.Key market trends, growth factors, and opportunities
6.3.2.Market size and forecast, 2020-2030
6.4.Utility
6.4.1.Key market trends, growth factors, and opportunities
6.4.2.Market size and forecast, 2020-2030
CHAPTER 7:GLOBAL SMALL WIND POWER MARKET, BY REGION
7.1.Overview
7.1.1.Market size and forecast, by region
7.2.North America
7.2.1.Key market trends, growth factors, and opportunities
7.2.2.Market size and forecast, by Type
7.2.3.Market size and forecast, By Installation type
7.2.4.Market size and forecast, by Application
7.2.5.Market size and forecast, by country
7.2.5.1.U.S.
7.2.5.1.1.Market size and forecast, by Type
7.2.5.1.2.Market size and forecast, By Installation type
7.2.5.1.3.Market size and forecast, by Application
7.2.5.2.Canada
7.2.5.2.1.Market size and forecast, by Type
7.2.5.2.2.Market size and forecast, By Installation type
7.2.5.2.3.Market size and forecast, by Application
7.2.5.3.Mexico
7.2.5.3.1.Market size and forecast, by Type
7.2.5.3.2.Market size and forecast, By Installation type
7.2.5.3.3.Market size and forecast, by Application
7.3.Europe
7.3.1.Key market trends, growth factors, and opportunities
7.3.2.Market size and forecast, by Type
7.3.3.Market size and forecast, By Installation type
7.3.4.Market size and forecast, by Application
7.3.5.Market size and forecast, by country
7.3.5.1.Germany
7.3.5.1.1.Market size and forecast, by Type
7.3.5.1.2.Market size and forecast, By Installation type
7.3.5.1.3.Market size and forecast, by Application
7.3.5.2.France
7.3.5.2.1.Market size and forecast, by Type
7.3.5.2.2.Market size and forecast, By Installation type
7.3.5.2.3.Market size and forecast, by Application
7.3.5.3.UK
7.3.5.3.1.Market size and forecast, by Type
7.3.5.3.2.Market size and forecast, By Installation type
7.3.5.3.3.Market size and forecast, by Application
7.3.5.4.Spain
7.3.5.4.1.Market size and forecast, by Type
7.3.5.4.2.Market size and forecast, By Installation type
7.3.5.4.3.Market size and forecast, by Application
7.3.5.5.Italy
7.3.5.5.1.Market size and forecast, by Type
7.3.5.5.2.Market size and forecast, By Installation type
7.3.5.5.3.Market size and forecast, by Application
7.3.5.6.Rest of Europe
7.3.5.6.1.Market size and forecast, by Type
7.3.5.6.2.Market size and forecast, By Installation type
7.3.5.6.3.Market size and forecast, by Application
7.4.Asia-Pacific
7.4.1.Key market trends, growth factors, and opportunities
7.4.2.Market size and forecast, by Type
7.4.3.Market size and forecast, By Installation type
7.4.4.Market size and forecast, by Application
7.4.5.Market size and forecast, by country
7.4.5.1.China
7.4.5.1.1.Market size and forecast, by Type
7.4.5.1.2.Market size and forecast, By Installation type
7.4.5.1.3.Market size and forecast, by Application
7.4.5.2.Japan
7.4.5.2.1.Market size and forecast, by Type
7.4.5.2.2.Market size and forecast, By Installation type
7.4.5.2.3.Market size and forecast, by Application
7.4.5.3.India
7.4.5.3.1.Market size and forecast, by Type
7.4.5.3.2.Market size and forecast, By Installation type
7.4.5.3.3.Market size and forecast, by Application
7.4.5.4.South Korea
7.4.5.4.1.Market size and forecast, by Type
7.4.5.4.2.Market size and forecast, By Installation type
7.4.5.4.3.Market size and forecast, by Application
7.4.5.5.Australia
7.4.5.5.1.Market size and forecast, by Type
7.4.5.5.2.Market size and forecast, By Installation type
7.4.5.5.3.Market size and forecast, by Application
7.4.5.6.Rest of Asia-Pacific
7.4.5.6.1.Market size and forecast, by Type
7.4.5.6.2.Market size and forecast, By Installation type
7.4.5.6.3.Market size and forecast, by Application
7.5.LAMEA
7.5.1.Key market trends, growth factors, and opportunities
7.5.2.Market size and forecast, by Type
7.5.3.Market size and forecast, By Installation type
7.5.4.Market size and forecast, by Application
7.5.5.Market size and forecast, by country
7.5.5.1.Brazil
7.5.5.1.1.Market size and forecast, by Type
7.5.5.1.2.Market size and forecast, By Installation type
7.5.5.1.3.Market size and forecast, by Application
7.5.5.2.Saudi Arabia
7.5.5.2.1.Market size and forecast, by Type
7.5.5.2.2.Market size and forecast, By Installation type
7.5.5.2.3.Market size and forecast, by Application
7.5.5.3.South Africa
7.5.5.3.1.Market size and forecast, by Type
7.5.5.3.2.Market size and forecast, By Installation type
7.5.5.3.3.Market size and forecast, by Application
7.5.5.4.Rest of LAMEA
7.5.5.4.1.Market size and forecast, by Type
7.5.5.4.2.Market size and forecast, By Installation type
7.5.5.4.3.Market size and forecast, by Application
CHAPTER 8:COMPETITIVE LANDSCAPE
8.1.Introduction
8.1.1.Market player positioning, 2022
8.1.2.Top winning strategies
8.1.3.Top winning strategies, by year
8.1.4.Top winning strategies, by development
8.1.5.Top winning strategies, by company
8.2.Product mapping of top 10 players
8.3.Competitive heatmap
8.4.Key developments
8.4.1.Business Expansion
8.4.2.Partnership
CHAPTER 9:COMPANY PROFILES
9.1.AEOLOS WIND ENERGY LTD
9.1.1.Company overview
9.1.2.Key executives
9.1.3.Company snapshot
9.1.4.Product portfolio
9.1.5.Key strategic moves and developments
9.2.BERGEY WIND POWER CO.
9.2.1.Company overview
9.2.2.Company snapshot
9.2.3.Key executives
9.2.4.Product portfolio
9.3.CITY WINDMILLS
9.3.1.Company overview
9.3.2.Key executives
9.3.3.Company snapshot
9.3.4.Product portfolio
9.4.EOCYCLE TECHNOLOGIES INC.
9.4.1.Company overview
9.4.2.Company snapshot
9.4.3.Key executives
9.4.4.Product portfolio
9.4.5.Key strategic moves and developments
9.5.SD WIND ENERGY LIMITED
9.5.1.Company overview
9.5.2.Key executives
9.5.3.Company snapshot
9.5.4.Product portfolio
9.6.RYSE ENERGY
9.6.1.Company overview
9.6.2.Company snapshot
9.6.3.Key executives
9.6.4.Product portfolio
9.7.SIEMENS
9.7.1.Company overview
9.7.2.Company snapshot
9.7.3.Key executives
9.7.4.Operating business segments
9.7.5.Product portfolio
9.7.6.Business performance
9.7.7.Key strategic moves and developments
9.8.SHANGHAI GHREPOWER GREEN ENERGY CO., LTD
9.8.1.Company overview
9.8.2.Company snapshot
9.8.3.Key executives
9.8.4.Product portfolio
9.9.UNITRON ENERGY SYSTEMS PVT. LTD.
9.9.1.Company overview
9.9.2.Company snapshot
9.9.3.Key executives
9.9.4.Product portfolio
9.10.WIND ENERGY SOLUTIONS
9.10.1.Company overview
9.10.2.Company snapshot
9.10.3.Key executives
9.10.4.Product portfolio
LIST OF TABLES
TABLE 01.GLOBAL SMALL WIND POWER MARKET, BY TYPE, 2020–2030 ($MILLION)
TABLE 02.GLOBAL SMALL WIND POWER MARKET, BY TYPE, 2020–2030 (MEGAWATTS)
TABLE 03.GLOBAL SMALL WIND POWER MARKET, BY INSTALLATION TYPE 2020–2030 ($MILLION)
TABLE 04.GLOBAL SMALL WIND POWER MARKET, BY INSTALLATION TYPE 2020–2030 (MEGAWATTS)
TABLE 05.GLOBAL SMALL WIND POWER MARKET, BY APPLICATION 2020–2030 ($MILLION)
TABLE 06.GLOBAL SMALL WIND POWER MARKET, BY APPLICATION 2020–2030 (MEGAWATTS)
TABLE 07.GLOBAL SMALL WIND POWER MARKET, BY REGION 2020–2030 ($MILLION)
TABLE 08.GLOBAL SMALL WIND POWER MARKET, BY REGION 2020–2030 (MEGAWATTS)
TABLE 09.NORTH AMERICA SMALL WIND POWER, BY TYPE, 2020–2030 ($MILLION)
TABLE 10.NORTH AMERICA SMALL WIND POWER, BY TYPE, 2020–2030 (MEGAWATTS)
TABLE 11.NORTH AMERICA SMALL WIND POWER, BY INSTALLATION TYPE 2020–2030 ($MILLION)
TABLE 12.NORTH AMERICA SMALL WIND POWER, BY TYPE, 2020–2030 (MEGAWATTS)
TABLE 13.NORTH AMERICA SMALL WIND POWER, BY APPLICATION 2020–2030 ($MILLION)
TABLE 14.NORTH AMERICA SMALL WIND POWER, BY TYPE, 2020–2030 (MEGAWATTS)
TABLE 15.NORTH AMERICA SMALL WIND POWER MARKET, BY COUNTRY 2020–2030 ($MILLION)
TABLE 16.NORTH AMERICA SMALL WIND POWER, BY TYPE, 2020–2030 (MEGAWATTS)
TABLE 17.U.S. SMALL WIND POWER, BY TYPE, 2020–2030 ($MILLION)
TABLE 18.U.S. SMALL WIND POWER, BY TYPE, 2020–2030 (MEGAWATTS)
TABLE 19.U.S. SMALL WIND POWER, BY INSTALLATION TYPE 2020–2030 ($MILLION)
TABLE 20.U.S. SMALL WIND POWER, BY TYPE, 2020–2030 (MEGAWATTS)
TABLE 21.U.S. SMALL WIND POWER, BY APPLICATION 2020–2030 ($MILLION)
TABLE 22.U.S. SMALL WIND POWER, BY TYPE, 2020–2030 (MEGAWATTS)
TABLE 23.CANADA SMALL WIND POWER, BY TYPE, 2020–2030 ($MILLION)
TABLE 24.CANADA SMALL WIND POWER, BY TYPE, 2020–2030 (MEGAWATTS)
TABLE 25.CANADA SMALL WIND POWER, BY INSTALLATION TYPE 2020–2030 ($MILLION)
TABLE 26.CANADA SMALL WIND POWER, BY TYPE, 2020–2030 (MEGAWATTS)
TABLE 27.CANADA SMALL WIND POWER, BY APPLICATION 2020–2030 ($MILLION)
TABLE 28.CANADA SMALL WIND POWER, BY TYPE, 2020–2030 (MEGAWATTS)
TABLE 29.MEXICO SMALL WIND POWER, BY TYPE, 2020–2030 ($MILLION)
TABLE 30.MEXICO SMALL WIND POWER, BY TYPE, 2020–2030 (MEGAWATTS)
TABLE 31.MEXICO SMALL WIND POWER, BY INSTALLATION TYPE 2020–2030 ($MILLION)
TABLE 32.MEXICO SMALL WIND POWER, BY INSTALLATION TYPE, 2020–2030 (MEGAWATTS)
TABLE 33.MEXICO SMALL WIND POWER, BY APPLICATION 2020–2030 ($MILLION)
TABLE 34.MEXICO SMALL WIND POWER, BY APPLICATION, 2020–2030 (MEGAWATTS)
TABLE 35.EUROPE SMALL WIND POWER, BY TYPE, 2020–2030 ($MILLION)
TABLE 36.EUROPE SMALL WIND POWER, BY TYPE, 2020–2030 (MEGAWATTS)
TABLE 37.EUROPE SMALL WIND POWER, BY INSTALLATION TYPE 2020–2030 ($MILLION)
TABLE 38.EUROPE SMALL WIND POWER, BY INSTALLATION TYPE 2020–2030 (MEGAWATTS)
TABLE 39.EUROPE SMALL WIND POWER, BY APPLICATION 2020–2030 ($MILLION)
TABLE 40.EUROPE SMALL WIND POWER, BY APPLICATION 2020–2030 (MEGAWATTS)
TABLE 41.EUROPE SMALL WIND POWER MARKET, BY COUNTRY 2020–2030 ($MILLION)
TABLE 42.EUROPE SMALL WIND POWER, BY COUNTRY 2020–2030 (MEGAWATTS)
TABLE 43.GERMANY SMALL WIND POWER, BY TYPE, 2020–2030 ($MILLION)
TABLE 44.GERMANY SMALL WIND POWER, BY TYPE, 2020–2030 (MEGAWATTS)
TABLE 45.GERMANY SMALL WIND POWER, BY INSTALLATION TYPE 2020–2030 ($MILLION)
TABLE 46.GERMANY SMALL WIND POWER, BY INSTALLATION TYPE, 2020–2030 (MEGAWATTS)
TABLE 47.GERMANY SMALL WIND POWER, BY APPLICATION 2020–2030 ($MILLION)
TABLE 48.GERMANY SMALL WIND POWER, BY APPLICATION, 2020–2030 (MEGAWATTS)
TABLE 49.FRANCE SMALL WIND POWER, BY TYPE, 2020–2030 ($MILLION)
TABLE 50.FRANCE SMALL WIND POWER, BY TYPE, 2020–2030 (MEGAWATTS)
TABLE 51.FRANCE SMALL WIND POWER, BY INSTALLATION TYPE 2020–2030 ($MILLION)
TABLE 52.FRANCE SMALL WIND POWER, BY INSTALLATION TYPE, 2020–2030 (MEGAWATTS)
TABLE 53.FRANCE SMALL WIND POWER, BY APPLICATION 2020–2030 ($MILLION)
TABLE 54.FRANCE SMALL WIND POWER, BY APPLICATION, 2020–2030 (MEGAWATTS)
TABLE 55.UK SMALL WIND POWER, BY TYPE, 2020–2030 ($MILLION)
TABLE 56.UK SMALL WIND POWER, BY TYPE, 2020–2030 (MEGAWATTS)
TABLE 57.UK SMALL WIND POWER, BY INSTALLATION TYPE 2020–2030 ($MILLION)
TABLE 58.UK SMALL WIND POWER, BY INSTALLATION TYPE, 2020–2030 (MEGAWATTS)
TABLE 59.UK SMALL WIND POWER, BY APPLICATION 2020–2030 ($MILLION)
TABLE 60.UK SMALL WIND POWER, BY APPLICATION, 2020–2030 (MEGAWATTS)
TABLE 61.SPAIN SMALL WIND POWER, BY TYPE, 2020–2030 ($MILLION)
TABLE 62.SPAIN SMALL WIND POWER, BY TYPE, 2020–2030 (MEGAWATTS)
TABLE 63.SPAIN SMALL WIND POWER, BY INSTALLATION TYPE 2020–2030 ($MILLION)
TABLE 64.SPAIN SMALL WIND POWER, BY INSTALLATION TYPE, 2020–2030 (MEGAWATTS)
TABLE 65.SPAIN SMALL WIND POWER, BY APPLICATION 2020–2030 ($MILLION)
TABLE 66.SPAIN SMALL WIND POWER, BY APPLICATION, 2020–2030 (MEGAWATTS)
TABLE 67.ITALY SMALL WIND POWER, BY TYPE, 2020–2030 ($MILLION)
TABLE 68.ITALY SMALL WIND POWER, BY TYPE, 2020–2030 (MEGAWATTS)
TABLE 69.ITALY SMALL WIND POWER, BY INSTALLATION TYPE 2020–2030 ($MILLION)
TABLE 70.ITALY SMALL WIND POWER, BY PRODUCY, 2020–2030 (MEGAWATTS)
TABLE 71.ITALY SMALL WIND POWER, BY APPLICATION 2020–2030 ($MILLION)
TABLE 72.ITALY SMALL WIND POWER, BY APPLICATION, 2020–2030 (MEGAWATTS)
TABLE 73.REST OF EUROPE SMALL WIND POWER, BY TYPE, 2020–2030 ($MILLION)
TABLE 74.REST OF EUROPE SMALL WIND POWER, BY TYPE, 2020–2030 (MEGAWATTS)
TABLE 75.REST OF EUROPE SMALL WIND POWER, BY INSTALLATION TYPE 2020–2030 ($MILLION)
TABLE 76.REST OF EUROPE SMALL WIND POWER, BY INSTALLATION TYPE, 2020–2030 (MEGAWATTS)
TABLE 77.REST OF EUROPE SMALL WIND POWER, BY APPLICATION 2020–2030 ($MILLION)
TABLE 78.REST OF EUROPE SMALL WIND POWER, BY APPLICATION, 2020–2030 (MEGAWATTS)
TABLE 79.ASIA-PACIFIC SMALL WIND POWER, BY TYPE, 2020–2030 ($MILLION)
TABLE 80.ASIA-PACIFIC SMALL WIND POWER, BY TYPE, 2020–2030 (MEGAWATTS)
TABLE 81.ASIA-PACIFIC SMALL WIND POWER, BY INSTALLATION TYPE 2020–2030 ($MILLION)
TABLE 82.ASIA-PACIFIC SMALL WIND POWER, BY INSTALLATION TYPE, 2020–2030 (MEGAWATTS)
TABLE 83.ASIA-PACIFIC SMALL WIND POWER, BY APPLICATION 2020–2030 ($MILLION)
TABLE 84.ASIA-PACIFIC SMALL WIND POWER, BY APPLICATION, 2020–2030 (MEGAWATTS)
TABLE 85.ASIA-PACIFIC SMALL WIND POWER MARKET, BY COUNTRY 2020–2030 ($MILLION)
TABLE 86.ASIA-PACIFIC SMALL WIND POWER, BY COUNTRY, 2020–2030 (MEGAWATTS)
TABLE 87.CHINA SMALL WIND POWER, BY TYPE, 2020–2030 ($MILLION)
TABLE 88.CHINA SMALL WIND POWER, BY TYPE, 2020–2030 (MEGAWATTS)
TABLE 89.CHINA SMALL WIND POWER, BY INSTALLATION TYPE 2020–2030 ($MILLION)
TABLE 90.CHINA SMALL WIND POWER, BY INSTALLATION TYPE, 2020–2030 (MEGAWATTS)
TABLE 91.CHINA SMALL WIND POWER, BY APPLICATION 2020–2030 ($MILLION)
TABLE 92.CHINA SMALL WIND POWER, BY APPLICATION, 2020–2030 (MEGAWATTS)
TABLE 93.JAPAN SMALL WIND POWER, BY TYPE, 2020–2030 ($MILLION)
TABLE 94.JAPAN SMALL WIND POWER, BY TYPE, 2020–2030 (MEGAWATTS)
TABLE 95.JAPAN SMALL WIND POWER, BY INSTALLATION TYPE 2020–2030 ($MILLION)
TABLE 96.JAPAN SMALL WIND POWER, BY INSTALLATION TYPE, 2020–2030 (MEGAWATTS)
TABLE 97.JAPAN SMALL WIND POWER, BY APPLICATION 2020–2030 ($MILLION)
TABLE 98.JAPAN SMALL WIND POWER, BY APPLICATION, 2020–2030 (MEGAWATTS)
TABLE 99.INDIAN SMALL WIND POWER, BY TYPE, 2020–2030 ($MILLION)
TABLE 100.INDIA SMALL WIND POWER, BY TYPE, 2020–2030 (MEGAWATTS)
TABLE 101.INDIAN SMALL WIND POWER, BY INSTALLATION TYPE 2020–2030 ($MILLION)
TABLE 102.INDIA SMALL WIND POWER, BY INSTALLATION TYPE, 2020–2030 (MEGAWATTS)
TABLE 103.INDIAN SMALL WIND POWER, BY APPLICATION 2020–2030 ($MILLION)
TABLE 104.INDIA SMALL WIND POWER, BY APPLICATION, 2020–2030 (MEGAWATTS)
TABLE 105.SOUTH KOREA SMALL WIND POWER, BY TYPE, 2020–2030 ($MILLION)
TABLE 106.SOUTH KOREA SMALL WIND POWER, BY TYPE, 2020–2030 (MEGAWATTS)
TABLE 107.SOUTH KOREA SMALL WIND POWER, BY INSTALLATION TYPE 2020–2030 ($MILLION)
TABLE 108.SOUTH KOREA SMALL WIND POWER, BY INSTALLATION TYPE, 2020–2030 (MEGAWATTS)
TABLE 109.SOUTH KOREA SMALL WIND POWER, BY APPLICATION 2020–2030 ($MILLION)
TABLE 110.SOUTH KOREA SMALL WIND POWER, BY APPLICATION, 2020–2030 (MEGAWATTS)
TABLE 111.AUSTRALIA SMALL WIND POWER, BY TYPE, 2020–2030 ($MILLION)
TABLE 112.AUSTRALIA SMALL WIND POWER, BY TYPE, 2020–2030 (MEGAWATTS)
TABLE 113.AUSTRALIA SMALL WIND POWER, BY INSTALLATION TYPE 2020–2030 ($MILLION)
TABLE 114.AUSTRALIA SMALL WIND POWER, BY INSTALLATION TYPE, 2020–2030 (MEGAWATTS)
TABLE 115.AUSTRALIA SMALL WIND POWER, BY APPLICATION 2020–2030 ($MILLION)
TABLE 116.AUSTRALIA SMALL WIND POWER, BY APPLICATION, 2020–2030 (MEGAWATTS)
TABLE 117.REST OF ASIA-PACIFIC SMALL WIND POWER, BY TYPE, 2020–2030 ($MILLION)
TABLE 118.REST OF ASIA-PACIFIC SMALL WIND POWER, BY TYPE, 2020–2030 (MEGAWATTS)
TABLE 119.REST OF ASIA-PACIFIC SMALL WIND POWER, BY INSTALLATION TYPE 2020–2030 ($MILLION)
TABLE 120.REST OF ASIA-PACIFIC SMALL WIND POWER, BY INSTALLATION TYPE, 2020–2030 (MEGAWATTS)
TABLE 121.REST OF ASIA-PACIFIC SMALL WIND POWER, BY APPLICATION 2020–2030 ($MILLION)
TABLE 122.REST OF ASIA-PACIFIC SMALL WIND POWER, BY APPLICATION, 2020–2030 (MEGAWATTS)
TABLE 123.LAMEA SMALL WIND POWER, BY TYPE, 2020–2030 ($MILLION)
TABLE 124.LAMEA SMALL WIND POWER, BY TYPE, 2020–2030 (MEGAWATTS)
TABLE 125.LAMEA SMALL WIND POWER, BY INSTALLATION TYPE 2020–2030 ($MILLION)
TABLE 126.LAMEA SMALL WIND POWER, BY INSTALLATION TYPE, 2020–2030 (MEGAWATTS)
TABLE 127.LAMEA SMALL WIND POWER, BY APPLICATION 2020–2030 ($MILLION)
TABLE 128.LAMEA SMALL WIND POWER, BY APPLICATION, 2020–2030 (MEGAWATTS)
TABLE 129.LAMEA SMALL WIND POWER MARKET, BY COUNTRY 2020–2030 ($MILLION)
TABLE 130.LAMEA SMALL WIND POWER, BY COUNTRY, 2020–2030 (MEGAWATTS)
TABLE 131.BRAZIL SMALL WIND POWER, BY TYPE, 2020–2030 ($MILLION)
TABLE 132.BRAZIL SMALL WIND POWER, BY TYPE, 2020–2030 (MEGAWATTS)
TABLE 133.BRAZIL SMALL WIND POWER, BY INSTALLATION TYPE 2020–2030 ($MILLION)
TABLE 134.BRAZIL SMALL WIND POWER, BY INSTALLATION TYPE, 2020–2030 (MEGAWATTS)
TABLE 135.BRAZIL SMALL WIND POWER, BY APPLICATION 2020–2030 ($MILLION)
TABLE 136.BRAZIL SMALL WIND POWER, BY APPLICATION, 2020–2030 (MEGAWATTS)
TABLE 137.SAUDI ARABIA SMALL WIND POWER, BY TYPE, 2020–2030 ($MILLION)
TABLE 138.SAUDI ARABIA SMALL WIND POWER, BY TYPE, 2020–2030 (MEGAWATTS)
TABLE 139.SAUDI ARABIA SMALL WIND POWER, BY INSTALLATION TYPE 2020–2030 ($MILLION)
TABLE 140.SAUDI ARABIA SMALL WIND POWER, BY INSTALLATION TYPE, 2020–2030 (MEGAWATTS)
TABLE 141.SAUDI ARABIA SMALL WIND POWER, BY APPLICATION 2020–2030 ($MILLION)
TABLE 142.SAUDI ARABIA SMALL WIND POWER, BY APPLICATION, 2020–2030 (MEGAWATTS)
TABLE 143.SOUTH AFRICA SMALL WIND POWER, BY TYPE, 2020–2030 ($MILLION)
TABLE 144.SOUTH AFRICA SMALL WIND POWER, BY TYPE, 2020–2030 (MEGAWATTS)
TABLE 145.SOUTH AFRICA SMALL WIND POWER, BY INSTALLATION TYPE 2020–2030 ($MILLION)
TABLE 146.SOUTH AFRICA SMALL WIND POWER, BY INSTALLATION TYPE, 2020–2030 (MEGAWATTS)
TABLE 147.SOUTH AFRICA SMALL WIND POWER, BY APPLICATION 2020–2030 ($MILLION)
TABLE 148.SOUTH AFRICA SMALL WIND POWER, BY APPLICATION, 2020–2030 (MEGAWATTS)
TABLE 149.REST OF LAMEA SMALL WIND POWER, BY TYPE, 2020–2030 ($MILLION)
TABLE 150.REST OF LAMEA SMALL WIND POWER, BY TYPE, 2020–2030 (MEGAWATTS)
TABLE 151.REST OF LAMEA SMALL WIND POWER, BY INSTALLATION TYPE 2020–2030 ($MILLION)
TABLE 152.REST OF LAMEA SMALL WIND POWER, BY INSTALLATION TYPE, 2020–2030 (MEGAWATTS)
TABLE 153.REST OF LAMEA SMALL WIND POWER, BY APPLICATION 2020–2030 ($MILLION)
TABLE 154.REST OF LAMEA SMALL WIND POWER, BY APPLICATION, 2020–2030 (MEGAWATTS)
TABLE 155.KEY BUSINESS EXPANSION (2018–2022)
TABLE 156.KEY PARTNERSHIP (2018–2022)
TABLE 157.AEOLOS WIND ENERGY LTD: KEY EXECUTIVES
TABLE 158.AEOLOS WIND ENERGY LTD: COMPANY SNAPSHOT
TABLE 159.AEOLOS WIND ENERGY LTD: PRODUCT PORTFOLIO
TABLE 160.AEOLOS WIND ENERGY LTD.: KEY STRATEGIC MOVES AND DEVELOPMENTS
TABLE 161.BERGEY WINDPOWER CO.: COMPANY SNAPSHOT
TABLE 162.BERGEY WINDPOWER CO.: KEY EXECUTIVES
TABLE 163.BERGEY WINDPOWER CO.: PRODUCT PORTFOLIO
TABLE 164.CITY WINDMILLS.: KEY EXECUTIVES
TABLE 165.CITY WINDMILLS.: COMPANY SNAPSHOT
TABLE 166.CITY WINDMILLS.: PRODUCT PORTFOLIO
TABLE 167.EOCYCLE TECHNOLOGIES INC: COMPANY SNAPSHOT
TABLE 168.EOCYCLE TECHNOLOGIES INC: KEY EXECUTIVES
TABLE 169.EOCYCLE TECHNOLOGIES INC: PRODUCT PORTFOLIO
TABLE 170.EOCYCLE TECHNOLOGIES INC.: KEY STRATEGIC MOVES AND DEVELOPMENTS
TABLE 171.SD WIND ENERGY LIMITED: KEY EXECUTIVES
TABLE 172.SD WIND ENERGY LIMITED.: COMPANY SNAPSHOT
TABLE 173.SD WIND ENERGY LIMITED.
TABLE 174.RYSE ENERGY.: COMPANY SNAPSHOT
TABLE 175.RYSE ENERGY.: KEY EXECUTIVES
TABLE 176.RYSE ENERGY.: PRODUCT PORTFOLIO
TABLE 177.SIEMENS: COMPANY SNAPSHOT
TABLE 178.SIEMENS: KEY EXECUTIVES
TABLE 179.SIEMENS: OPERATING SEGMENTS
TABLE 180.SIEMENS: PRODUCT PORTFOLIO
TABLE 181.OVERALL FINANCIAL STATUS ($MILLION)
TABLE 182.SIEMENS.: KEY STRATEGIC MOVES AND DEVELOPMENTS
TABLE 183.SHANGHAI GHREPOWER GREEN ENERGY CO., LTD.: COMPANY SNAPSHOT
TABLE 184.SHANGHAI GHREPOWER GREEN ENERGY CO., LTD..: KEY EXECUTIVES
TABLE 185.SHANGHAI GHREPOWER GREEN ENERGY CO., LTD.: PRODUCT PORTFOLIO
TABLE 186.UNITRON ENERGY SYSTEMS PVT. LTD..: COMPANY SNAPSHOT
TABLE 187.UNITRON ENERGY SYSTEMS PVT. LTD..: KEY EXECUTIVES
TABLE 188.UNITRON ENERGY SYSTEMS PVT. LTD..: PRODUCT PORTFOLIO
TABLE 189.WIND ENERGY SOLUTIONS: COMPANY SNAPSHOT
TABLE 190.WIND ENERGY SOLUTIONS.: KEY EXECUTIVES
TABLE 191.WIND ENERGY SOLUTIONS: PRODUCT PORTFOLIO
LIST OF FIGURES
FIGURE 01.GLOBAL SMALL WIND POWER MARKET SNAPSHOT, BY SEGMENTATION, 2021–2030
FIGURE 02.GLOBAL SMALL WIND POWER MARKET SNAPSHOT, BY REGION, 2021–2030
FIGURE 03.GLOBAL SMALL WIND POWER MARKET SEGMENTATION
FIGURE 04.TOP INVESTMENT POCKETS
FIGURE 05.MODERATE BARSGAINING POWER OF SUPPLIERS
FIGURE 06.MODERATE THREAT OF NEW ENTRANTS
FIGURE 07.MODERATE THREAT OF SUBSTITUTES
FIGURE 08.MODERATE INTENSITY OF COMPETITIVE RIVALRY
FIGURE 09.MODERATE BARSGAINING POWER OF BUYERS
FIGURE 10.GLOBAL SMALL WIND POWER MARKET DYNAMICS
FIGURE 11.VALUE CHAIN ANALYSIS
FIGURE 12.GLOBAL SMALL WIND POWER MARKET REVENUE, BY TYPE ($MILLION)
FIGURE 13.GLOBAL SMALL WIND POWER MARKET VOLUME, BY TYPE (MEGAWATTS)
FIGURE 14.MARKET SIZE AND FORECAST, 2020-2030
FIGURE 15.MARKET SIZE AND FORECAST, 2020-2030 (MEGAWATTS)
FIGURE 16.MARKET SIZE AND FORECAST, 2020-2030
FIGURE 17.MARKET SIZE AND FORECAST, 2020-2030 (MEGAWATTS)
FIGURE 18.GLOBAL SMALL WIND POWER MARKET REVENUE, BY INSTALLATION TYPE ($MILLION)
FIGURE 19.GLOBAL SMALL WIND POWER MARKET VOLUME, BY INSTALLATION TYPE (MEGAWATTS)
FIGURE 20.MARKET SIZE AND FORECAST, 2020-2030
FIGURE 21.MARKET SIZE AND FORECAST, 2020-2030
FIGURE 22.MARKET SIZE AND FORECAST, 2020-2030
FIGURE 23.MARKET SIZE AND FORECAST, 2020-2030
FIGURE 24.GLOBAL SMALL WIND POWER MARKET REVENUE, BY APPLICATION ($MILLION)
FIGURE 25.GLOBAL SMALL WIND POWER MARKET VOLUME, BY APPLICATION (MEGAWATTS)
FIGURE 26.MARKET SIZE AND FORECAST, 2020-2030
FIGURE 27.MARKET SIZE AND FORECAST, 2020-2030
FIGURE 28.MARKET SIZE AND FORECAST, 2020-2030
FIGURE 29.MARKET SIZE AND FORECAST, 2020-2030
FIGURE 30.MARKET SIZE AND FORECAST, 2020-2030
FIGURE 31.MARKET SIZE AND FORECAST, 2020-2030
FIGURE 32.GLOBAL SMALL WIND POWER MARKET REVENUE, BY REGION ($MILLION)
FIGURE 33.GLOBAL SMALL WIND POWER MARKET VOLUME, BY REGION (MEGAWATTS)
FIGURE 34.U.S. SMALL WIND POWER MARKET REVENUE, 2020–2030, ($MILLION)
FIGURE 35.U.S. SMALL WIND POWER MARKET REVENUE, 2020–2030, (MEGAWATTS)
FIGURE 36.CANADA SMALL WIND POWER MARKET REVENUE, 2020–2030, ($MILLION)
FIGURE 37.CANADA SMALL WIND POWER MARKET VOLUME, 2020–2030, (MEGAWATTS)
FIGURE 38.MEXICO SMALL WIND POWER MARKET REVENUE, 2020–2030, ($MILLION)
FIGURE 39.MEXICO SMALL WIND POWER MARKET VOLUME, 2020–2030, (MEGAWATTS)
FIGURE 40.GERMANY SMALL WIND POWER MARKET REVENUE, 2020–2030, ($MILLION)
FIGURE 41.GERMANY SMALL WIND POWER MARKET VOLUME, 2020–2030, (MEGAWATTS)
FIGURE 42.FRANCE SMALL WIND POWER MARKET REVENUE, 2020–2030, ($MILLION)
FIGURE 43.FRANCE SMALL WIND POWER MARKET VOLUME, 2020–2030, (MEGAWATTS)
FIGURE 44.UK SMALL WIND POWER MARKET REVENUE, 2020–2030, ($MILLION)
FIGURE 45.UK SMALL WIND POWER MARKET VOLUME, 2020–2030, (MEGAWATTS)
FIGURE 46.SPAIN SMALL WIND POWER MARKET REVENUE, 2020–2030, ($MILLION)
FIGURE 47.SPAIN SMALL WIND POWER MARKET VOLUME, 2020–2030, (MEGAWATTS)
FIGURE 48.ITALY SMALL WIND POWER MARKET REVENUE, 2020–2030, ($MILLION)
FIGURE 49.ITALY SMALL WIND POWER MARKET VOLUME, 2020–2030, (MEGAWATTS)
FIGURE 50.REST OF EUROPE SMALL WIND POWER MARKET REVENUE, 2020–2030, ($MILLION)
FIGURE 51.REST OF EUROPE SMALL WIND POWER MARKET VOLUME, 2020–2030, (MEGAWATTS)
FIGURE 52.CHINA SMALL WIND POWER MARKET REVENUE, 2020–2030, ($MILLION)
FIGURE 53.CHINA SMALL WIND POWER MARKET VOLUME, 2020–2030, (MEGAWATTS)
FIGURE 54.JAPAN SMALL WIND POWER MARKET REVENUE, 2020–2030, ($MILLION)
FIGURE 55.JAPAN SMALL WIND POWER MARKET VOLUME, 2020–2030, (MEGAWATTS)
FIGURE 56.INDIA SMALL WIND POWER MARKET REVENUE, 2020–2030, ($MILLION)
FIGURE 57.INDIA SMALL WIND POWER MARKET VOLUME, 2020–2030, (MEGAWATTS)
FIGURE 58.SOUTH KOREA SMALL WIND POWER MARKET REVENUE, 2020–2030, ($MILLION)
FIGURE 59.SOUTH KOREA SMALL WIND POWER MARKET VOLUME, 2020–2030, (MEGAWATTS)
FIGURE 60.AUSTRALIA SMALL WIND POWER MARKET REVENUE, 2020–2030, ($MILLION)
FIGURE 61.AUSTRALIA SMALL WIND POWER MARKET VOLUME, 2020–2030, (MEGAWATTS)
FIGURE 62.REST OF ASIA-PACIFIC SMALL WIND POWER MARKET REVENUE, 2020–2030, ($MILLION)
FIGURE 63.REST OF ASIA-PACIFIC SMALL WIND POWER MARKET VOLUME, 2020–2030, (MEGAWATTS)
FIGURE 64.BRAZIL SMALL WIND POWER MARKET REVENUE, 2020–2030, ($MILLION)
FIGURE 65.BRAZIL SMALL WIND POWER MARKET VOLUME, 2020–2030, (MEGAWATTS)
FIGURE 66.SAUDI ARABIA SMALL WIND POWER MARKET REVENUE, 2020–2030, ($MILLION)
FIGURE 67.SAUDI ARABIA SMALL WIND POWER MARKET VOLUME, 2020–2030, (MEGAWATTS)
FIGURE 68.SOUTH AFRICA SMALL WIND POWER MARKET REVENUE, 2020–2030, ($MILLION)
FIGURE 69.SOUTH AFRICA SMALL WIND POWER MARKET VOLUME, 2020–2030, (MEGAWATTS)
FIGURE 70.REST OF LAMEA SMALL WIND POWER MARKET REVENUE, 2020–2030, ($MILLION)
FIGURE 71.REST OF LAMEA SMALL WIND POWER MARKET VOLUME, 2020–2030, (MEGAWATTS)
FIGURE 72.MARKET PLAYER POSITIONING, 2022
FIGURE 73.TOP WINNING STRATEGIES, BY YEAR, 2018–2022
FIGURE 74.TOP WINNING STRATEGIES, BY DEVELOPMENT, 2018–2022 (%)
FIGURE 75.TOP WINNING STRATEGIES, BY COMPANY, 2018–2022
FIGURE 76.PRODUCT MAPPING OF TOP 10 PLAYERS
FIGURE 77.COMPETITIVE HEATMAP OF KEY PLAYERS
FIGURE 78.SIEMENS: REVENUE, 2018–2020 ($MILLION)
FIGURE 79.SIEMENS: REVENUE SHARE BY SEGMENT, 2020 (%)
FIGURE 80.SIEMENS: REVENUE SHARE BY REGION, 2020 (%)
Â
The global small wind power market has registered a dynamic growth over the past few years owing to drastic growth in urbanization and rise in sustainable& renewable energy demand. In addition, huge investment plans with respect to renewable source of energy to achieve a sustainable energy future led to boost in the demand for small wind power mills across the globe. Moreover, the Department of Energy Wind Energy Technologies U.S. invested in energy science R&D activities that enable the innovations needed to advance U.S. wind systems, reduce the cost of electricity, and accelerate the deployment of wind power. Furthermore, small wind turbines offer the benefits of modern electricity services to households that had no access to electricity, reduce electricity costs on islands and in other remote locations that are dependent on oil-fired generation and enable residents & small businesses to generate their own electricity.
A. North America will provide more business opportunities for global small wind power in future.
A. Aeolos Wind Energy Ltd, Bergey Wind Power Co., City Windmills, Eocycle Technologies Inc, Northern Power Systems, Ryse Energy, Sd Wind Energy Limited, Shanghai Ghrepower Green Energy Co. Ltd, Unitron Energy Systems Pvt. Ltd And Wind Energy Solutions are the leading market players active in the small wind power market.
A. Technological evolution of small wind power, increasing dependency on electricity and rapid expansion of favourable government policies with respect to pollution tend to increase the growth global small wind power market in the next few years.
A. Rise in urbanization, increase adoption of renewable energy sources are expected to drive the adoption of small wind power.
A. The report provides an extensive qualitative and quantitative analysis of the current trends and future estimations of the global small wind power market from 2020 to 2030 to determine the prevailing opportunities.
A. On-Grid segment holds the maximum share of the global small wind power market.
A. Residential & commercial users are the major customers of global small wind power market.
A. Rapid expansion of electricity infrastructure in remote areas, increase in adoption of renewable source of energy are the major driving factor for the market. In addition, Increase in governmental tariffs coupled with clean energy and rising urbanization may create lucrative opportunities for the market.
A. Agreement, business expansion and product launch are the key growth strategy of global small wind power market players.
Start reading instantly.
This Report and over 67,071+ more Reports, Available with Avenue Library. T&C*.
Enterprise
License/PDF
Library
Membership
*Taxes/Fees, if applicable will be added during checkout. All prices in USD
To ensure high-level data integrity, accurate analysis, and impeccable forecasts
For complete satisfaction
On-demand customization of scope of the report to exactly meet your needs
Targeted market view to provide pertinent information and save time of readers
Get insights on topics that are crucial for your business. Stay abreast of your interest areas.
Get Industry Data AlertsTo ensure high-level data integrity, accurate analysis, and impeccable forecasts
For complete satisfaction
On-demand customization of scope of the report to exactly meet your needs
Targeted market view to provide pertinent information and save time of readers